1. Introduction
Zinc is an essential nutrient strongly coupled with the marine organic carbon cycle. Zinc has the potential to limit marine primary productivity under certain conditions (Anderson et al., 1978; Moore et al., 2013; Morel et al., 1994; Shaked et al., 2006). The reversible scavenging of Zn onto organic matter and the downward transport of organic Zn are important processes of Zn cycling in ocean water (John & Conway, 2014; Weber et al., 2018). Further, the burial of Zn in marine sediments is likely linked to the extent of sulfide generated by sulfate reduction (Tribovillard et al., 2006). Therefore, the Zn concentration and isotopic compositions of ancient seawater recorded in marine sediments may provide vital information on the marine organic carbon cycle, which is a strong lever on climate and Earth’s redox budget (e.g., Berner, 2004; Xiao et al., 2023; Zhao et al., 2023).
Dissolved δ66Zn values of modern surface ocean waters (<1000 m) vary substantially from -1.1‰ to +0.9‰, probably due to isotopic fractionation related to biological uptake and adsorption on organic particles (Bermin et al., 2006; Conway & John, 2014, 2015; John et al., 2018; Lemaitre et al., 2020; Weber et al., 2018; Zhao et al., 2021). In contrast, the Zn isotopic composition in modern deep ocean (>1000 m) is relatively homogeneous with a mean δ66Zn value of ~0.5‰ (Conway & John, 2014, 2015; John et al., 2018; Lemaitre et al., 2020). On the other hand, low δ66Zn values ( -0.2 to 0.2‰) can occur regionally in the deep ocean that is strongly influenced by hydrothermal fluids or diffusion flux from Zn-rich porewaters in sediments (Conway & John, 2014; John et al., 2018; Lemaitre et al., 2020). Rivers are the largest Zn source to the oceans, with δ66Zn values in a narrow range of 0.19 to 0.56‰ (John et al., 2008; Little, Vance, et al., 2014). The two most important marine Zn burial fluxes are Fe-Mn oxides and organic-rich sediments along continental margins, with δ66Zn in the ranges of 0.53 to 1.42‰ and -0.15 to 0.47‰, respectively (Little et al., 2016; Weber et al., 2018). Therefore, the Zn isotope composition of the deep marine waters has the potential to provide new insights into the evolution of the biological pump (the export of organic matter from surface waters into the ocean interior).
There have been limited attempts to reconstruct the evolution of deep-ocean δ66Zn. So far, the only study from Fe-Mn crusts revealed relatively constant δ66Zn values (1.06 to 1.23‰ for crust D11-1) during the last 20 Myr (Little, Vance, et al., 2014). Here, we provide further Zn concentration and isotopic measurements on two previously extensively studied Fe-Mn crusts (D11-1 and CD29-2) from the Pacific Ocean, in order to reconstruct the δ66Zn composition of deep ocean for the last 90 Myr. We found that in the deep Pacific Ocean, the δ66Zn remains relatively constant during the Cenozoic, which implies limited changes in the marine zinc cycle and, by inference, the biological pump.
2. Materials and Methods
2.1. Samples
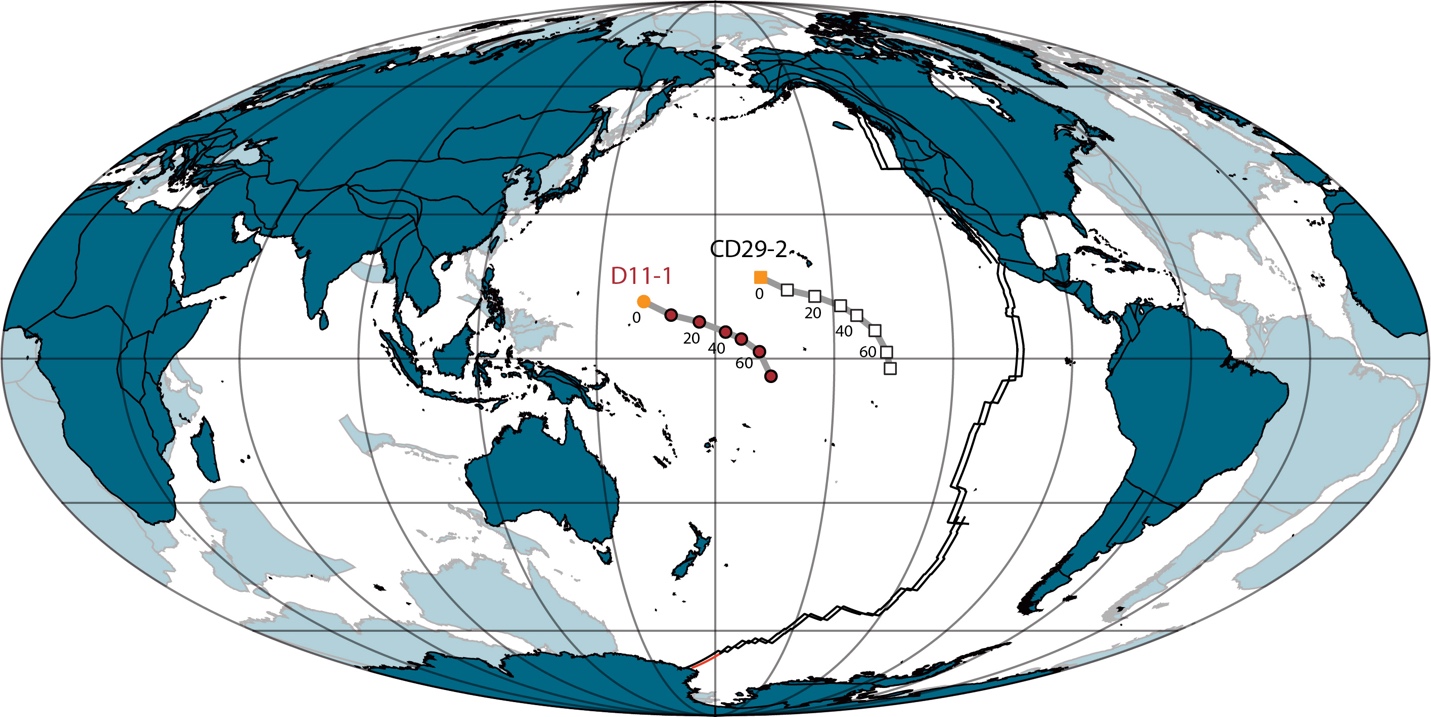
Two Fe-Mn crusts (D11-1 and CD29-2) from the Pacific Ocean (fig. 1) were investigated in this study. Crusts D11-1 and CD29-2 come from seamounts at water depths of 1690–1870 and 1970–2390 m, respectively (Christensen et al., 1997). Detailed information on the locations and the mineralogy of these two sites is provided in Christensen et al. (1997) and Ling et al. (1997). Samples at every 2 mm interval were drilled from the crusts. The age model of crust CD29-2 comes from Klemm et al. (2005), which was calibrated using the well-known marine Os isotopic evolution of the past 80 Ma. The age model of the crust D11-1 comes from Nielsen et al. (2009), which is also based on the Os isotope stratigraphy and shows a good match between crusts CD29-2 and D11-1. Based on the age models of the two sites, the each 2-mm sampling interval represents 1–2 Myr. Further, the presence of well-defined Os isotope variations rules out the presence of total diffusional overprinting of Zn isotope signature, as Os diffuses ~6000 times quicker than Zn (table 1).

2.2. Analytical method
An extended x-ray absorption fine structure (EXAFS) study indicates that Zn is mainly associated with birnessite (δ-MnO2) in the Fe-Mn crusts (Little, Sherman, et al., 2014). Thus, 10 mL 0.1M NH2OH-HCl solution was used to selectively dissolve Mn oxides in ~5 mg drilled samples (Neaman et al., 2004), which can avoid significant contamination from iron oxides and other minerals. About 5 mg drilled samples were dissolved in 10 mL 0.1M NH2OH-HCl solution for 2 days after ultrasonic vibration for 2–3 h. After centrifugation, the solutions were dried down and re-dissolved in 6N HCl.
A small portion of the solution was used for element analysis (including Zn and Mn) on a Thermo Element-XR inductively coupled plasma mass spectrometry (ICP-MS) at the Yale University Metal Geochemistry Center (Zhao et al., 2021). The solutions were further purified using anion-exchange resin AG MP-1 (100–200 mesh), following the protocols described by Isson et al. (2018) and Zhao et al. (2021). The Zn isotopic composition of purified samples with 100 ppb Zn in 5 % HNO3 were measured on a Thermo Finnigan Neptune Plus MC-ICP-MS at the Yale University Metal Geochemistry Center. One or two overall procedural blanks were run for each batch, with the Zn concentrations <1% of the samples. Zn isotope data are reported here relative to the standard JMC Lyon using delta notation. The external precision for Zn isotopic analysis is better than ± 0.05 ‰ (2σ), based on the repeated analyses of standards IRMM (δ66Zn=0.33±0.05‰, n=38) and Nod-P-1 (δ66Zn=0.85±0.03‰, n=4) (table 2). More detailed methods and information on Neptune operating conditions are given in Isson et al. (2018) and Zhao et al. (2021).
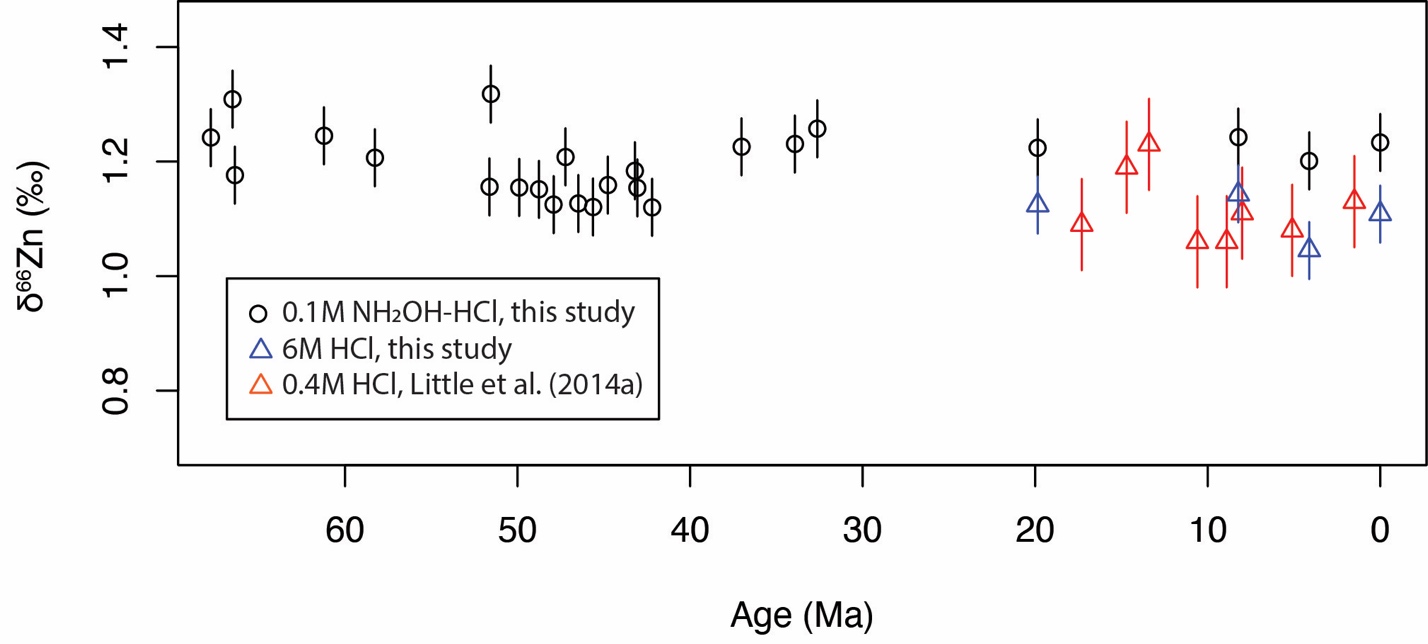
We have used 0.1M NH2OH-HCl solution to target only Mn oxides, in order to preclude significant contamination from iron oxides and other minerals (Neaman et al., 2004). The δ66Zn measured using this method is slightly higher (~0.1‰) than the results of Little, Vance et al. (2014) for the same crust D11-1 (figs. 2 and 3, and table 3), where 0.4M HCl was used to digest the samples. To compare with the results of Little, Vance et al. (2014), we have digested four samples using 6M HCl. As shown in figure 2, the results using 6M HCl compare well with the results of Little, Vance et al. (2014). This thus indicates that our analytical results are robust. The ~0.1‰ higher δ66Zn values of Fe-Mn crusts digested using 0.1M NH2OH-HCl solution likely results from less contamination from detrital materials and iron oxides. The detrital materials have a lower δ66Zn of ~0.3‰ (Little, Vance, et al., 2014), much lower than that of the Mn oxides (~1.2‰). It was also found that the adsorption of Zn to Fe oxides results in smaller fractionations than Mn oxides (Bryan et al., 2015; Juillot et al., 2008), with ∆66Znadsorbed-aqueous=+0.29‰ for goethite and ∆66Znadsorbed-aqueous=+0.53‰ for ferrihydrite.


2.3. The global mass-balance model
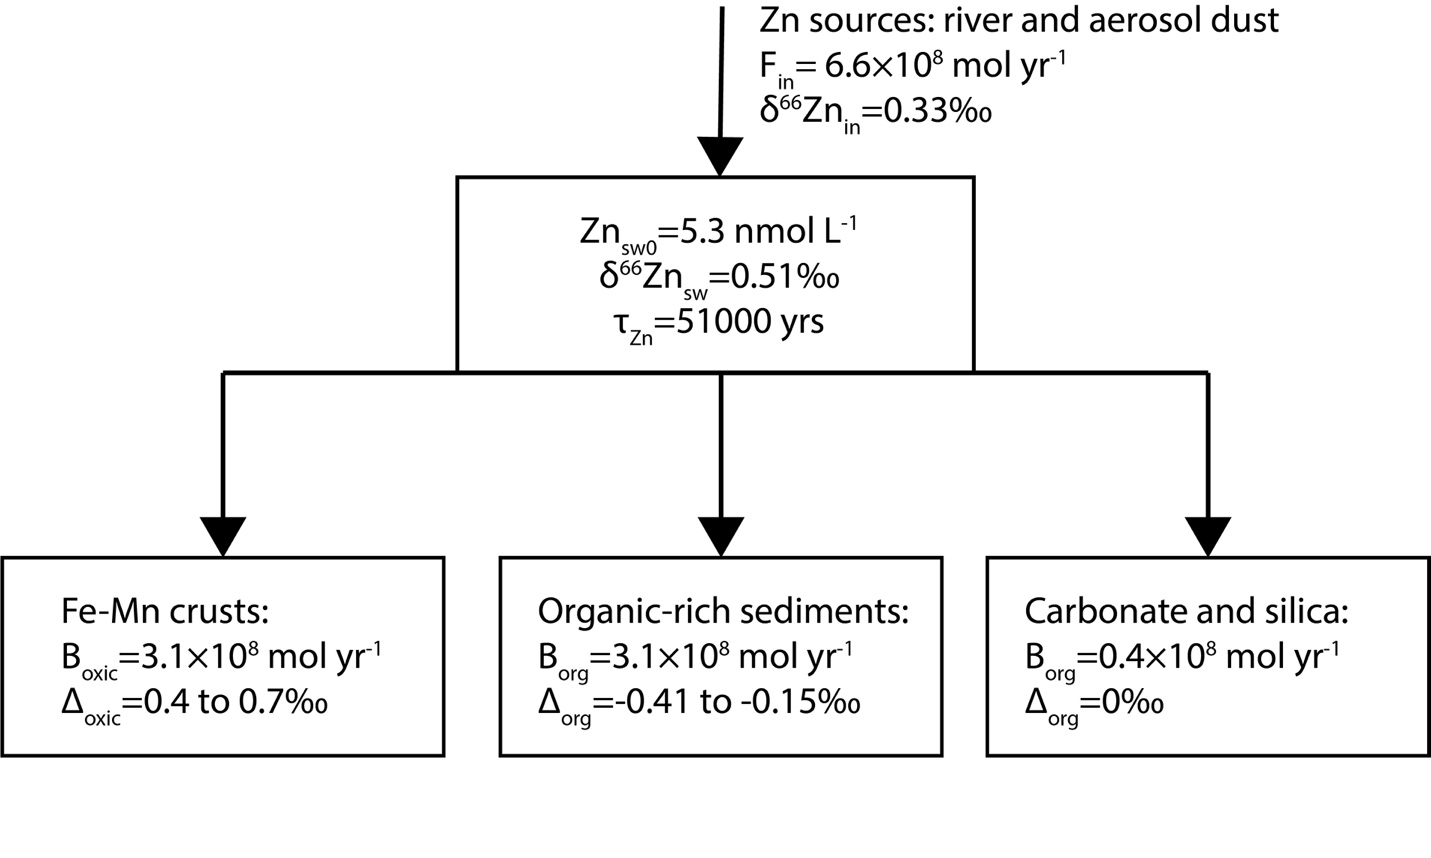
In order to understand variation of Zn cycle and perhaps biological pump during the Cenozoic, we built a simple global mass-balance model to simulate the variations of δ66Zn of seawater (δ66Znsw). In this simple model, the Zn flux from land to seawater through river and aerosol dust are lumped together into one term Fin (fig. 4). Following the previous studies (e.g., Isson et al., 2018; Little, Vance, et al., 2014), three Zn burial fluxes are included, which are Zn burial flux related to Fe-Mn crusts (Box), Zn burial flux in organic-rich sediments (Borg) and Zn burial flux associated with carbonate and silica (Bother).

The proportion of marine Zn burial in organic-rich sediments relative to the sum of Zn burial in the ocean (forg_Zn) is calculated as:
forg_Zn=BorgBorg+Box+Bother=BorgFin
Similarly, the proportion of marine Zn burial in carbonate and silica relative to the sum of Zn burial in the ocean (fother) is calculated using:
fother=BotherBorg+Box+Bother=BotherFin
The main equation for the time evolution of δ66Znsw is:
dδ66Znsw dt=Fin∗δ66Znin−Box∗(δ66Znsw+Δox)−Borg∗(δ66Znsw+Δorg)−Bother∗δ66ZnswZnsw0∗V=[Fin∗δ66Znin−Fin∗(1−forg_Zn−fother)∗(δ66Znsw+Δox)−Fin∗forg_Zn∗(δ66Znsw+Δorg)−Fin∗fother∗δ66Znsw]/(Znsw0∗V)
where δ66Znin is δ66Zn of Zn sources to seawater, is the Zn isotopic fractionation between Fe-Mn crusts and seawater, is the Zn isotopic fractionation between organic-rich sediments and seawater, and V is the total volume of seawater. Znsw0 represents the Zn concentration of modern ocean water, assuming that Zn concentration of deep ocean hasn’t change much throughout the Cenozoic, which is likely supported by the Zn/Mn data of this study. The values and ranges of each parameter can be found in table 4.
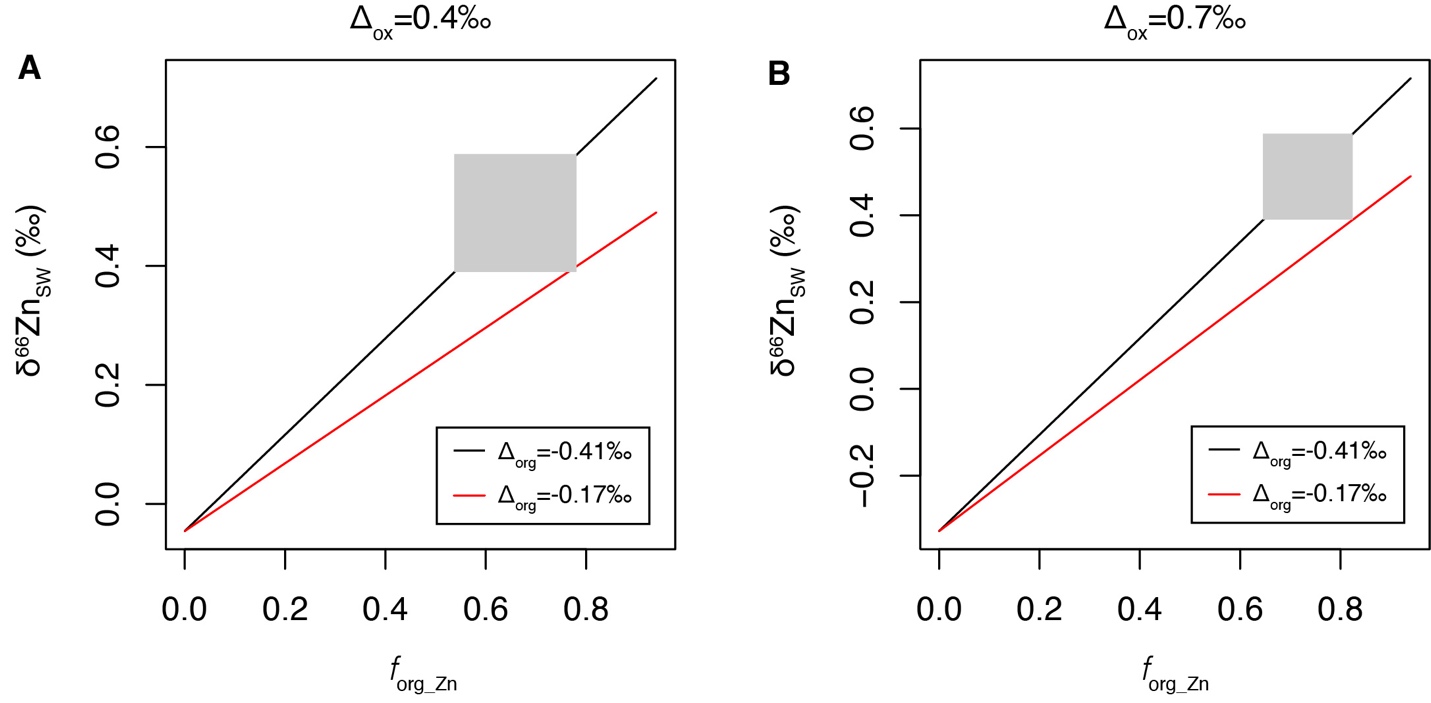
In modern ocean, the Zn burial flux associated with carbonate and silica is small relative to Zn burial associated with Fe-Mn crust and organic-rich sediments (table 4). Thus, for simplification, Bother and thus fother are fixed terms in the simulation of the Cenozoic Zn cycle. Following the previous finding on shallow-water carbonate (Zhao et al., 2021), no Zn isotopic fractionation is applied between carbonate/silica and seawater. The δ66Zn of organic-rich sediments in continental margin have a large range (-0.1 to 0.7‰, Horner et al., 2021; Little et al., 2016; Weber et al., 2018; Zhang et al., 2021). Thus, there is a large uncertainty in the estimation of the average in the global ocean, which could be in the range of -0.41 to -0.15‰ (Isson et al., 2018; Little et al., 2016; Weber et al., 2018). Similarly, there is also a considerable variation in among different sites (Bryan et al., 2015; Maréchal et al., 2000; Pokrovsky et al., 2005; this study), which is commonly in the range of 0.4 to 0.7‰. The average δ66Zn of Zn fluxes to seawater (δ66Znin) was estimated to be 0.33‰ (Little, Vance, et al., 2014). δ66Znin and Fin may have varied throughout the Cenozoic, which may have contributed to the variation in the δ66Zn of the Fe-Mn crusts observed in this study. However, these two terms are also fixed in the current simulation, as their variations during the Cenozoic are largely unknown. We further estimate the maximum possible change in forg_Zn during the Cenozoic under fixed δ66Znin and Fin. With the constraints discussed above, it is thus possible to calculate the relationship between δ66Znsw and forg_Zn under different and through running the model to steady state, which can further be used to estimate forg_Zn using the δ66Znsw values inferred from the record of the Fe-Mn crusts. The calculated relationships between δ66Znsw and forg_Zn are shown as figure 5.

3. Results
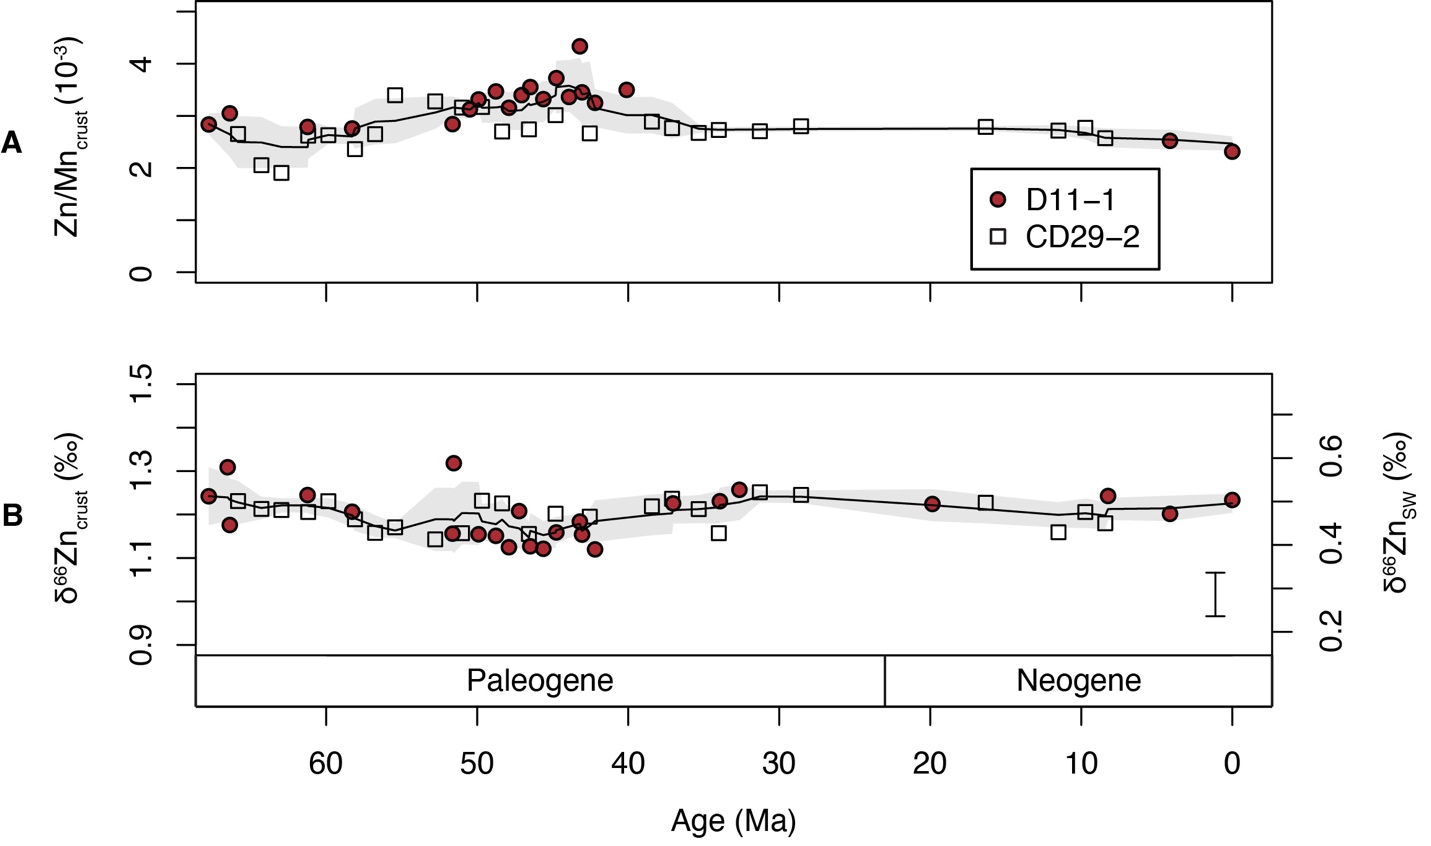
The measured Zn/Mn ratios are in the range of 1.9×10⁻³ to 4.3×10⁻³ (fig. 3 and table 3). We use Zn/Mn because much of the Zn in Fe-Mn crusts (61-83%) is shown to be associated with the Mn phase (Koschinsky & Hein, 2003) and the NH2OH-HCl used during digestion only attacks Mn oxides (Neaman et al., 2004). Measured δ66Zn values of the Fe-Mn crusts range from 1.12‰ to 1.32‰ (fig. 3 and table 3). The two measured crusts D11-1 and CD29-2 have similar Zn/Mn and δ66Zn values (fig. 3). Zn/Mn shows a small increase from ~2.5×10⁻³ to ~3.5×10⁻³ from 62 Ma to 43Ma, followed by a gradual decrease from ~3.5×10⁻³ to ~2.5×10⁻³ from 43 Ma to the present. δ66Zn is stable around 1.2‰ throughout the Cenozoic. The magnitude of variation in δ66Zn (±0.1‰) is slightly larger than the analytical error (±0.05‰, 2σ). The measured δ66Zn values for the last 20 Myrs is ~0.1‰ higher than the previous measured values of crust D11-1 (fig. 2, Little, Vance, et al., 2014). However, as discussed earlier, this offset can be linked to different digestion solution (0.1M NH2OH-HCl) from that of Little, Vance et al. (2014) (0.4M HCl). Stronger acid digests yield values similar to those reported by Little, Vance et al. (2014), perhaps due the attack of stronger acid on some silicate minerals (fig. 2). Zn and Al concentrations show no obvious correlation both crusts D11-1 (R2=0.21, n=20) and CD29-2 (R2=0.06, n=26; fig. S1).
4. Discussion
4.1 The evolution of seawater Zn isotopic composition
Seafloor Fe-Mn crusts have been extensively used as an archive for the seawater chemistry as they directly precipitate from seawater (e.g., Christensen et al., 1997; Klemm et al., 2005; Ling et al., 1997; Little, Vance, et al., 2014; Nielsen et al., 2009; Wang et al., 2016). Our measured δ66Zn values of the Cenozoic Fe-Mn crusts (~1.2‰) are consistent with the previous finding that Zn isotopic compositions of the Fe-Mn crusts are 0.5–0.7‰ higher than that of dissolved Zn in deep oceanic water (Boyle et al., 2012; Little, Sherman, et al., 2014; Little, Vance, et al., 2014). The lack of strong correlations between Zn and Al (R2=0.06 and 0.21 for crust D11-1 and CD29-2, respectively), suggests that the variations in δ66Zn and Zn/Mn do not reflect contamination from detrital minerals. Phosphorus concentration results indicate the occurrence of phosphatization only in the >30 Ma part of the crust D11-1 and CD29-2 (Ling et al., 1997). This is also supported by the measured P concentration in this study, which shows a significant shift in P concentration around 30 Ma (table 3). However, there are no obvious changes in δ66Zn and Zn/Mn around 30 Ma, consistent with a limited influence of phosphatization on the δ66Zn and Zn/Mn of the crusts. Therefore, there is strong basis for linking δ66Zn values of Fe-Mn crusts to seawater composition. The variations in Zn/Mn of the Fe-Mn crusts may reflect a change in seawater Zn concentration or the environmental forcings (such as pH, redox state and temperature etc.) that could have an influence on the adsorption of Zn by Mn oxides (birnessite, Little, Sherman, et al., 2014). Following Little, Vance, et al., 2014, the δ66Zn values of seawater (δ66ZnSW) were calculated with an application of 0.7‰ offset between Mn oxides in Fe-Mn crusts and seawater (fig. 3). This offset is applied because the δ66Zn value of the youngest sample of crust D11-1 at 0.0 Ma shows a value of 1.23‰ (table 3), which is ~0.7‰ higher than that of modern deep ocean water (~0.5‰). This offset is also consistent with the previous estimates based on modern Fe-Mn crusts (e.g., Little, Vance, et al., 2014; Maréchal et al., 2000).
In the modern ocean, deep-water δ66ZnSW (>1000 m) is generally homogeneous, with a mean value of ~0.4‰ to 0.5‰ (Conway & John, 2014, 2015; John et al., 2018; Lemaitre et al., 2020). The distance between the two studied Fe-Mn crusts is about 4000 km (fig. 1), with water depths of ~2000 m. Eruption and/or erosion of the seamount must had ceased before the continuous growth of the Fe-Mn crusts on it (Meynadier et al., 2008). Thus, these processes won’t have much influence on the long-term variations of water depths of the studied Fe-Mn crusts. However, due to the subsidence of oceanic crust with distance from the ridge, the studied two sites were likely shallower in the past.
The relatively constant δ66ZnSW since ~67 Ma suggest that the large part of the deep Pacific Ocean near the study sites has homogeneous δ66ZnSW of ~0.5‰ during this period, which is the same, within analytical error, as modern deep-ocean waters. Previous measurements on Fe-Mn crusts of the Atlantic and Indian oceans also show limited variation of δ66Zn in Fe-Mn crusts (~1‰) during the last 20 Myrs (fig. S2, Little, Vance, et al., 2014). The δ66Zn of Fe-Mn crusts of the Atlantic is ~0.1‰ lower than that of the Pacific (Little, Vance, et al., 2014), and whether this reflects changes in fractionation or deep seawater composition requires further investigation.
4.2 Implication for the evolution of organic Zn burial and biological pump
Zinc isotope compositions of ocean-water profiles are controlled by uptake and sorption of Zn and the interplay of those processes—likely along with fractionation during sulfide formation resulting in burial of isotopically light Zn in high productivity settings (Little et al., 2016; Weber et al., 2018). Although the δ66Zn of organic-rich sediments in continental margins have a large range (-0.1 to 0.7‰, Horner et al., 2021; Little et al., 2016; Weber et al., 2018; Zhang et al., 2021), the average δ66Zn of authigenic Zn in organic-rich sediments (0.1 to 0.35‰, Isson et al., 2018; Little et al., 2016; Weber et al., 2018) is likely lower than that of seawater (~0.5‰). This is also supported by a simple Zn isotopic mass balance model, which requires a major Zn sink with δ66Zn lower than that of the Zn sources to seawater (0.33‰, Little, Vance, et al., 2014). Intriguingly, our record suggests the suite of processes controlling the Zn cycle have no fundamental change over the entire Cenozoic despite a large change in ocean temperatures and marine ecosystems (e.g., Norris et al., 2013; Zachos et al., 2001), which is typically envisioned to have changed the operation of the biological pump (e.g., Boscolo-Galazzo et al., 2021; Fakhraee et al., 2020).
We have used a simple mass balance model to understand the implication of the δ66Zn results of Fe-Mn crusts on the evolution of global Zn cycle throughout the Cenozoic (figs. 4 and 5), assuming that the δ66Zn variations (1.12‰ to 1.32‰) of the Fe-Mn crusts only reflect variations in δ66Zn of deep ocean water and perturbations in global Zn cycle. This allows us to estimate the maximum possible perturbation of global Zn cycle during the Cenozoic, as other factors such as local ocean water conditions and Zn speciation may also have some contribution to the δ66Zn variations (1.12‰ to 1.32‰) of the Fe-Mn crust. For example, in the normal pH range of ocean water (7–8.2), changes in Zn speciation can have a small influence (<0.1‰) on the δ66Zn of free Zn2+ that can be adsorbed by Fe-Mn crusts (e.g., Mavromatis et al., 2019).
Using a simple mass balance model for global Zn cycle, we have calculated the possible proportation of marine Zn burial in organic-rich sediments relative to the sum of Zn burial (forg_Zn) that could explain the δ66Zn results in this study (fig. 5). In the situation of = 0.4‰ and = -0.41‰, a forg_Zn variation in the range of 0.54 to 0.78 would be required to explain the range of δ66Znsw inferred from the results of Fe-Mn crusts. The required forg_Zn would be in the range of 0.65 to 0.82, when = 0.7‰ and = -0.41‰. However, under = -0.17‰, it is not possible to explain the highest δ66Znsw inferred from the results of Fe-Mn crusts (0.59‰) even if forg_Zn =0.94, which means that there is no Zn burial with Fe-Mn crusts. Thus, = -0.17‰ is not a possible situation under current model framework. Thus, our results limit the extent of change in organic zinc burial through the Cenozoic. However, given uncertainties in the global mass balance and analytical error, variations of roughly 20% in organic zinc burial (i.e., a range of forg_Zn from 0.65 to 0.82 when = -0.41‰) are still possible.
5. Conclusions
Our δ66Zn results from two central Pacific Fe-Mn crusts suggest that the δ66Zn values of Pacific Ocean deep water remained stable around ~0.5‰ through the entire Cenozoic. Using a simple mass balance model of global Zn cycle, we can constrain the evolution of organic Zn burial during the Cenozoic. Considering the uncertainties in the global mass balance and analytical error, our model results show that variations of ~20% in organic zinc burial through the Cenozoic are still possible.
Acknowledgments
We greatly thank Dan Asael for his help in the lab work and Zheng Gong for his help on the tectonic maps. M.Z. is funded by the programme of the Chinese Academy of Sciences (E251520401) and the IGGCAS Key programme (no. IGGCAS-202201). We thank two anonymous reviewers for critical feedback that improved this manuscript.
Data Availability
https://data.mendeley.com/datasets/h4nrs68zvy/1
Editor: C. Page Chamberlain, Associate Editor: Timothy W. Lyons