Issue with response() function (DISMO package)
105 views
Skip to first unread message

luca gregnanin
Jan 12, 2021, 10:03:45 AM1/12/21
to Maxent
Hi all!
I built 3 climatic models with different sets of bioclimatic variables from WorldClim, with ENMeval package in R (maxent.jar algorithm).
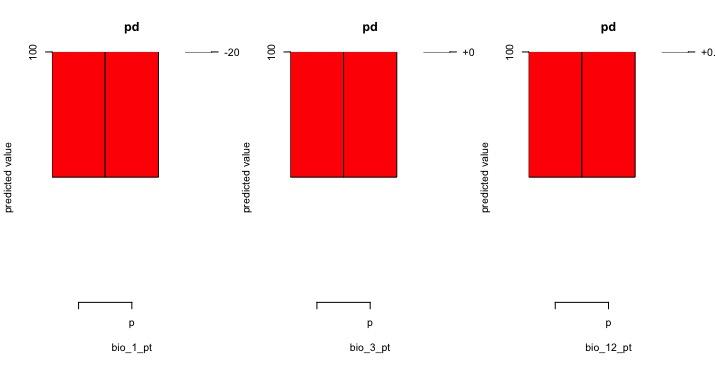
When i run response() function I get one warning for each variable included:
1: In rug(quantile(d[, i], probs = seq(0, 1, 0.1)), col = "blue") :
some values will be clipped
and the plot of the response curves appears quite wrong (I attach an example).
I think the reason is something linked to margin sizes of the plot, but I could not fix it.
Any idea on how to solve?
I use ENMeval v. 0.3.1, dismo 1.1-4, maxent 3.4.1, R v. 3.6.3 on Mac OS X Catalina.
Thank you a lot!
Luca Gregnanin

Bede-Fazekas Ákos
Jan 12, 2021, 10:21:06 AM1/12/21
to max...@googlegroups.com
Dear Luca,
Although without more information (data, script, traceback) I cannot help, but I'm quite sure that the issue is nothing to do with margin sizes (as you concluded) but is more related to the data or improper parameterization of response().
Have a nice week,
Ákos Bede-Fazekas
Hungarian Academy of Sciences
--
You received this message because you are subscribed to the Google Groups "Maxent" group.
To unsubscribe from this group and stop receiving emails from it, send an email to maxent+un...@googlegroups.com.
To view this discussion on the web visit https://groups.google.com/d/msgid/maxent/e3b83d45-970f-4757-aab0-eb2507c34b10o%40googlegroups.com.
luca gregnanin
Jan 12, 2021, 11:04:34 AM1/12/21
to max...@googlegroups.com
Dear Ákos,
thank you a lot for your answer.
I get this issue with all the sets of variables, and the predictions of the models are reasonable, so I could not imagine an issue related with the data.
What does it mean parameterization of response()? I’m very new to ENM.
Luca Gregnanin
To view this discussion on the web visit https://groups.google.com/d/msgid/maxent/a3e38a1f-cd75-9e3d-35af-6eb49b175718%40gmail.com.

Jamie M. Kass
Mar 8, 2021, 6:14:21 PM3/8/21
to Maxent
For some reason, it looks like your response curves are for categorical variables. Make sure these variables are not class factor in your data frame.
Jamie M. Kass
JSPS Postdoctoral Scholar
Okinawa Institute of Science and Technology Graduate Univ.
Reply all
Reply to author
Forward
0 new messages