Introduction
Bogue (Boops boops, Linnaeus, 1758), family Sparidae, is an important demersal and semi-pelagic species in the Mediterranean Sea. This species lives in the Eastern Atlantic, in an area reaching from Norway in the north, where it is occasionally to Angola in the south and throughout the Mediterranean Sea including the Black Sea.1 Capture production of bogue in Turkey ranks 10th with an amount of 2310.6 tones in 2022 after anchovy, Atlantic bonito, pilchard, mackerel, sprat, whiting, blue fish, twaite shad, and chup mackerel.2
Age, growth, and mortality of B. boops, have been studied from the Portuguese coast, Egyptian waters, western Mediterranean coast of Egypt, Tunisian waters, Algarve (South of Portugal), northern Aegean Sea, İzmir Bay, Adriatic coasts (Velebit Channel), Egyptian Mediterranean waters off Alexandria Egypt, İzmir Bay, Montenegrin waters, northern and central Adriatic Sea, Gulf of Antalya, southern Tyrrhenian Sea, between Nador and Sidia (Morocco), Güllük Bay, Mediterranean waters front Alexandria, Algerian East coast,and Saros Bay.3–22 Despite its commercial importance, the biology and population parameters of B. boops are not well known in the northeastern Mediterranean Sea, Türkiye.
The purpose of this study was to investigate the age, growth, and mortality of the B. boops species from the Gulf of Antalya. Results are important for future improvement and sustainable fishery management plans for this species.
Materials and Methods
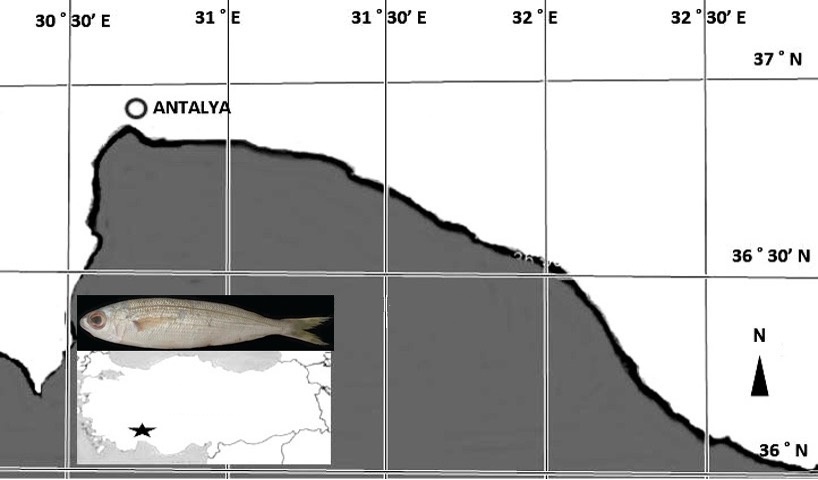
The samples of B. boops were collected monthly from the commercial landings from October 2020 to September 2021 from the Gulf of Antalya (Figure 1). Samplings of fish were made by a bottom trawl net with a 44 mm mesh size. Total length was measured to the nearest 0.1 mm and body weight to the nearest 0.01 g. Sex was determined by macroscopic observation of the gonads. Gonads of all individuals were dissected and weighed to the nearest 0.01 g. Age determination was carried out by reading annual rings on B. boops right and left sagittal otoliths. The number of opaque zones and the presence of marginal translucent zone were checked by two readers.

The growth, condition factor, length-weight relationship, and exploitation were statistically analyzed using FiSAT II as detailed in detail by Gayanilo et al.23 Length and weight relative growth rate were calculated by following equations Ricker.24 The relative growth in length (L2 - L1 / L1) x 100, the relative growth in weight (W2 - W1 / W1) x 100, where L1: the mean length of the first age group (cm), L2: the mean length of the next age group (cm), W1: the mean weight of the first age group (g), W2: the mean weight of the next age group (g).
The condition factor (K) determined changes in the species’ nutritional condition. K was estimated using the equation proposed by Ricker24: K = (W / L3) x 100, where W = Total weight of fish (g), L = Total length of fish (cm). The gonad-somatic index (GSI) was calculated using the GSI = Wg / W x 100; where Wg is gonad weight and W is body weight. The length-weight relationship was described by the equation: W = aLb, where W is the weight of fish (g), L is the total length (cm), b is the allometric rate and a is a constant.25 The linear regression relationship for females and males was tested for significance using analysis of variance (ANOVA).
The von Bertalanffy growth model was fitted to the observed lengths at age. The model is described by the equation 24 where L∞ is the asymptotic total length, Lt is the total length at age t, k is the growth curvature parameter and t0 is the theoretical age that fish would have been at zero length.26 The growth performance index (ɸ) was computed from the expression given by Pauly and Munro27: ɸ = log10k + 2 log10L∞.
The total mortality rate (Z) was estimated by using the length converted catch curve. The natural mortality rate (M) was estimated using by the equation of Pauly28: logM= - 0.0066 - 0.279 log L∞ + 0.6543 logk + 0.4634 logT. Where T is the mean annual temperature, estimated in the study area at 22.2 °C, k and L∞ are the constants of the von Bertalanffy equation. The fishing mortality rate F was estimated using the relationship of Pauly29: F = Z - M. The exploitation rate E was obtained by the relationship of Gulland30: E = F / Z. The stock is in equilibrium when E = 0.5, it is under-exploited when E < 0.5 and is overexploited when E > 0.5.
A t-test was used for possible variations in the length-weight of females, and males, and the overall sex ratio was assessed using the chi-square test.31 An analysis of covariance was used to compare relative growth, condition factor, and the linear regression relationship for females and males was tested for significance using analysis of variance (ANOVA).
Results
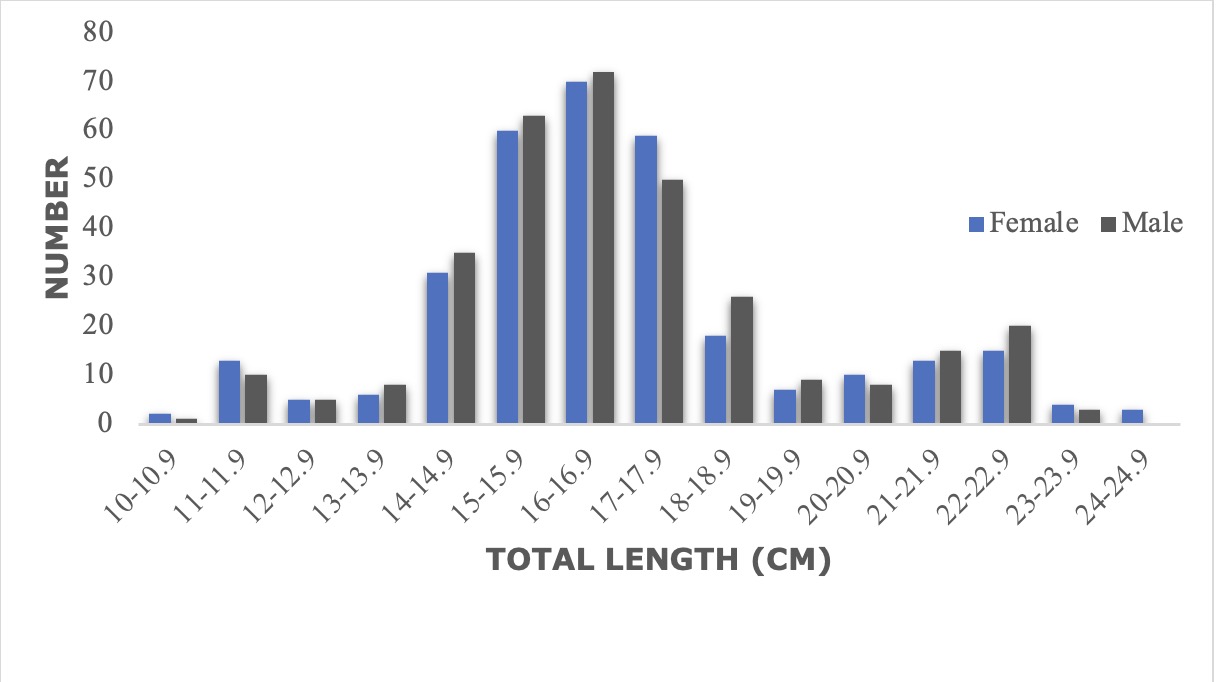
A total of 641 specimens of B. boops ranging from 10.8 to 24.9 cm in total length and 12.99 to 141.11 g weight were sampled. There were 316 females (10.8 - 24.9 cm, TL; 12.99 - 141.11 g, W) and 325 males (10.9 - 23.0 cm, TL; 13.47 - 119.60 g, W). Females dominated length sizes were 14.0 to 17.9 cm (16.13 ± 0.06), whereas males were 14.0 to 18.9 cm (16.09 ± 0.07) (Figure 2).

The female: male ratio was 1:0.97, it was not significantly different from the expected 1:1 ratio (χ2 = 0.126, P>0.05). The ages of individuals ranged from 1 to 5 years. In our study, the RG rates calculated according to ages: in weight and length, for 1 to 2, 2 to 3, 3 to 4 and 4 to 5 ages: 159.25 g / 28.77 cm, 58.19 g / 21.81 cm, 29.17 g / 17.56 cm, and 18.97 g / 8.78 cm, respectively.
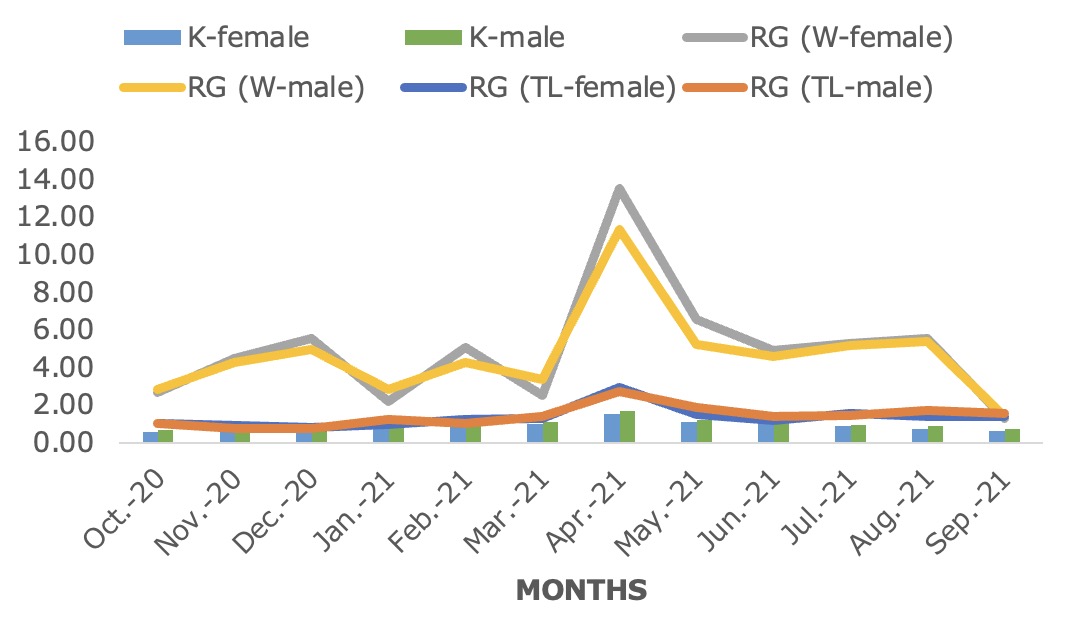
Figure 3 show monthly variations in the relative growth (RG) and condition factor (K) calculated from 316 females and 325 males of B. boops. The highest relative growth values were calculated in April (13.48) after which a decrease in relative growth values was calculated with increase of age reaching in September (1.29). Values of the condition factor are relatively low for both sexes. The highest values were noticed in April 1.55 for females and 1.69 for males and the lowest values in October 0.57 for females and 0.69 for males. No significant correlation was found between relative growth and condition factor (P > 0.05, t-test).

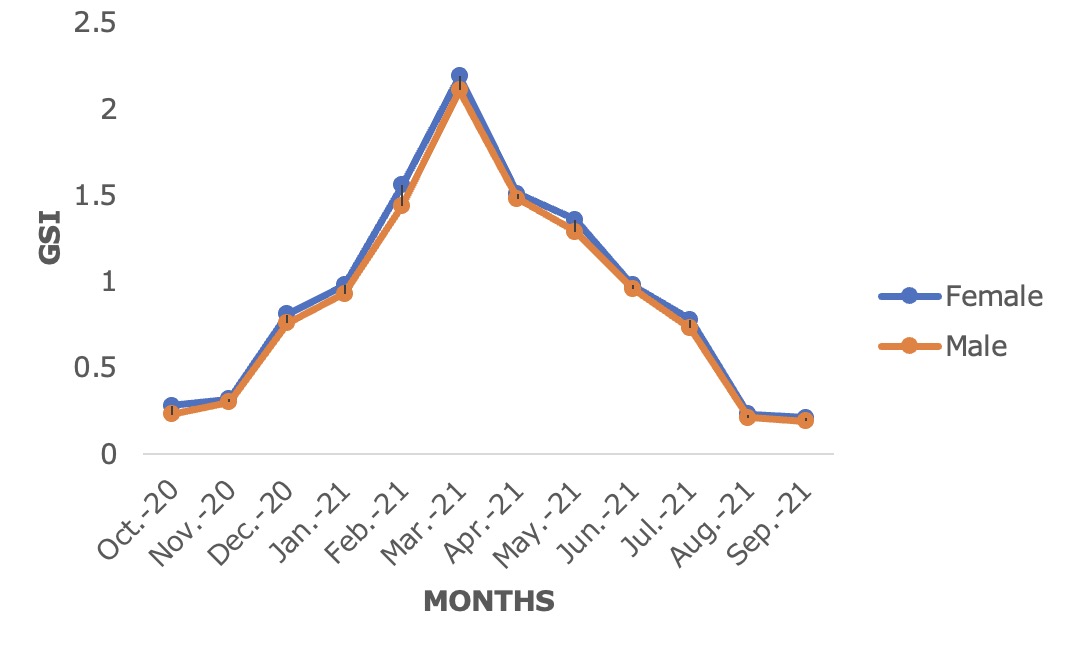
In the B. boops from the Antalya Bay, the mean monthly gonadosomatic index (GSI) values were the highest in March (2.19-2.11). Spawning occurred both females and males between January (0.98-0.93) and ends in September (0.21-0.19) (Figure 4).

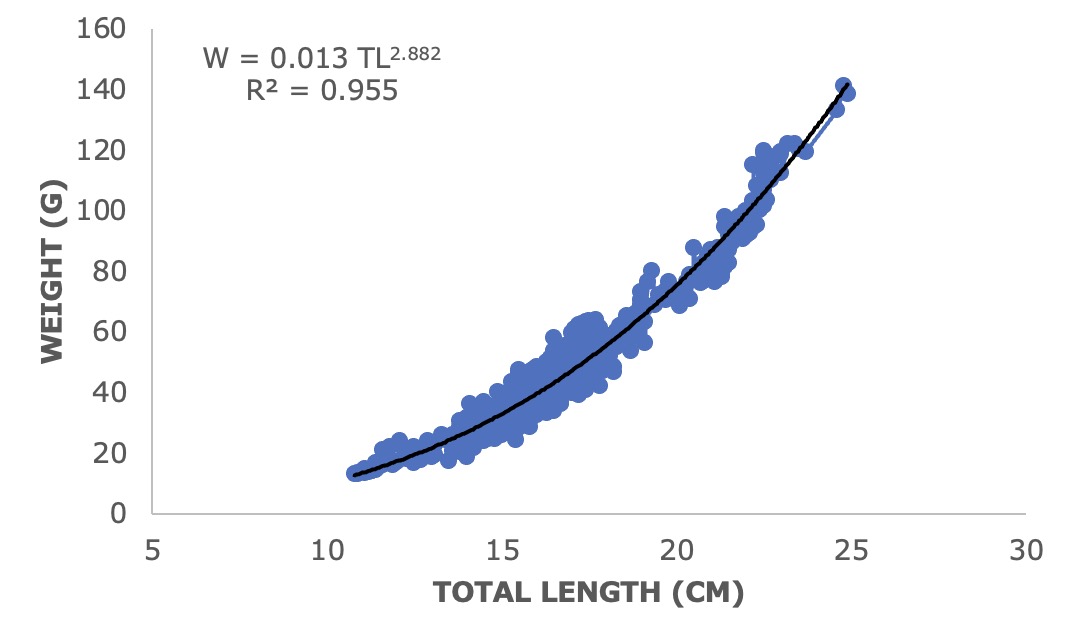
The total length-weight relationships were calculated respectively for females, males and overall, W = 0.013 TL2.897, W = 0.014 TL2.867 and W = 0.013 TL2.882, respectively (Figure 5).

The slopes of the total length-weight relationships, which do not differ significantly between sexes (one-way ANOVA, P < 0.001), indicate the negative allometric growth (b ranged 2.867 and 2.897), respectively had a significant difference from the value 3.0 (t-test, P > 0.05).
Right and left sagittal otoliths were collected from 641 individuals of B. boops. The results of reading otolith rings in females, males, and overall, of bogue are shown in Table 1. The observed lengths of individuals determined for each group were used to appropriate the von Bertalanffy growth model. The von Bertalanffy growth formulas:
in females, Lt = 37.14 (1 - e-0.15(t+1.33)) (R2 = 0.918); Wt = 237.38 (1 - e-0.14(t-0.43)) (R2 = 0.996), in males, Lt = 29.95 (1 - e-0.22(t+0.95)) (R2 = 0.881); Wt = 173.74 (1 - e-0.21(t-0.62)) (R2 = 0.979), and overall, Lt = 37.50 (1 - e-0.15(t+1.32)) (R2 = 0.988); Wt = 199.56(1 - e-0.17(t-0.53)) (R2 = 0.989).
The performance index parameters estimated for B. boops using the length frequency data revealed the best fit for L∞ = 37.14 cm, k = 0.15 (in females), L∞ = 29.95 cm, k = 0.22 (in males), L∞= 37.50 cm, k = 0.15 (total) per year while the growth performance was estimated as 2.32, 2.29 and 2.33, respectively.
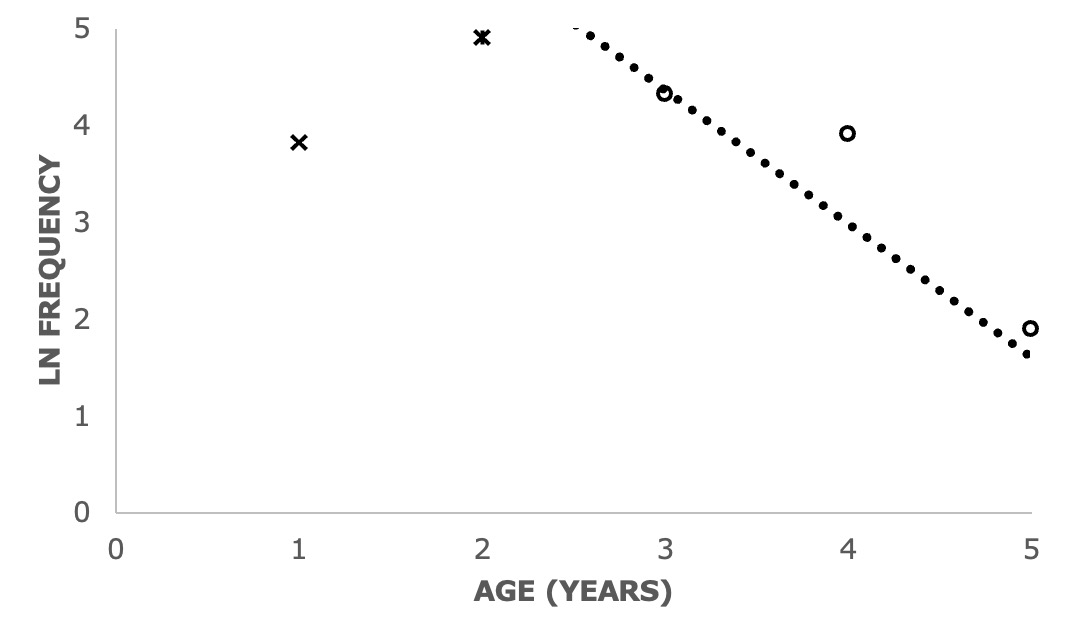
The total mortality (Z) of bogue estimated by the length converted catch curve was 1.12 (Figure 6). The natural mortality (M) as per Pauly’s empirical formula was found to be 0.36. The estimated fishing mortality (F) is 0.76 and the exploitation ratio (E) is 0.68. The exploitation ratio E > 0.50. The values of E obtained indicated that the fishing pressure exerted on the B. boops in the area under study was excessive fishing (TÜİK2 reported that it is around 2300 tones in 2022).

Discussion
The length and weight, however, varied from various localities (Table 2). The variable in bogue growth may result from a few factors including environmental conditions or genetic variations. There are in agreement with the findings of this study. Five age groups (1 - 5) were determined in both sexes. Two and three-year-old fish dominated the population (82.84 %). In the previous studies, age classes for bogue were determined as 1 - 6; 1 - 4; 1 – 5, and 1 - 5 by El-Haweet5; El-Okda11; Kara and Bayhan12, and Dahel et al.,10 respectively. The different exploitation patterns and/or ecological conditions related to habitat quality and temperature could explain age class variations.32
The condition factor is an index that expresses the degree of well-being, relative robustness, and interactions between abiotic and biotic factors in fish physiological conditions.33 In the study, the mean ratio of the condition factors for females (0.97 ± 0.007), males (0.98 ± 0.006), and overall (0.97 ± 0.005) for B. boops were all ∼1.0. No significant difference was found between the mean condition factors of individuals females and males for bogue (P = 0.36, P > 0.05).
The estimated b values of the regression for B. boops showed a negative allometric growth pattern (b < 3) fort his study. Allen34 chose to keep the value of the b exponent constant at 3 for isometrical fish growth. The negative allometric growth were recorded from the Gulf of Antalya,16 in the Morocco waters,18 in the Egypt waters,20 and in the Algerian waters,21 while the positive allometric growth were in the Greece waters,35 in the Adriatic Sea,15 and in the Aegean Sea.13 Variations in fish shape, and growth increase some of the environmental conditions like temperature, season, habitat and food presence.36 The factors are affected by sequences factors including gonad maturity, stomach fullness, sex, diet, and health.37
Table 2 shows the von Bertalanffy growth parameters and the growth performance in the different localities for bogue species. The primary input data for several models used to manage overfished fish stocks were 37.50 cm, 0.15 yr-1, and 1.32 for the von Bertalanffy growth parameters (L∞, K, and t0). The potential causes of these discrepancies could be the variable maximum lengths recorded in the captures or the diverse sample methodologies and calculating methods utilized by various authors at various times and locations. Therefore, geographical dispersion, changes in environmental circumstances, climate influences, quality of available food, and fishing effort would all be factors in the variability of growth.
Estimates of the total mortality (Z), the natural mortality (M), the fishing mortality (F), and exploitation ratio (E) for the presently reported species were 1.12 y-1, 0.36 y-1, 0.76 y-1 and 0.68 which is similar to those for other references: between 1.02 to 2.26 y-1; 0.15 to 0.67 y-1; 0.66 to 1.59 y-1 and 0.46 to 0.87, respectively.4,7,20,21,38,39 Our estimate E was 0.68 and higher than 0.50. Gulland30 suggested that a fish stock is optimally exploited at a level of F which generates E = 0.50, Fopt = M. Based on these suggestions, our results mean that the available stock is being heavily exploited.
Generally, many Sparidae species are long-lived fishes and have a low value of natural mortality; for instance, the natural mortality of Pagrus pagrus42 and Pagellus erythrinus43 were 0.22 and 0.43. In the bogue, the natural mortality was between 0.15 y-1 and 0.67 y-1. While Pauly29 estimated the natural mortality of fishes via von Bertalanffy growth parameters and assumed that there is a relation between fish size and natural mortality. The optimum exploitation rate (E) is assumed to be close to 0.50.30 E of bogue was 0.68 showing the stock at a higher optimum level of exploitation. Similar to these results, in Algarve, Algerian, Turkey, and Egypt waters.
High rates of fishing mortality (0.76) impact the population structure and growth rates of many species in addition to environmental considerations. Fishing generally alters the length structure of fishing stocks. In fact, B. boops catch increased in the waters of Türkiye in 2016, 2017, and 2018 (2795.1, 3175.0, and 3559.3 tones).2 Other species, like bogue, have also shown this link between growth and exploitation. The relationship between fishing mortality and growth performance may ultimately be due to commercial fishermen’s adaptation to changing fishing practices and fishing gear selectivity, which has the effect of continuously removing larger individuals from populations. This study investigated the age, growth, and mortality of bogue, B. boops (Linnaeus, 1758) and provides basic biological data that are useful in sustainable fishery management of this species in Turkey waters (Antalya Bay, northeastern Mediterranean Sea).
Acknowledgments
I am pleased to thank Prof. Dr. Seval BAHADIR KOCA (Isparta) for improving the language and proofreading the manuscript.
Declaration of competing interests
The author declare that he has no known competing financial interests or personal relationships that could have appeared to influence the work reported in this paper.
Data availability statement
The data that support the findings of this study are available from the corresponding author upon reasonable request.
Ethics approval
No ethical approval was the need for this study. Fish specimens came from commercial fisheries.
Authors’ Contribution - CRediT
Conceptualization, Investigation, Data curation, Methodology, Formal Analysis, Writing – original draft, and Writing – review & editing: Habil Uğur Koca