Article

Exploitation and Conservation Status of the Thornback Ray (Raja clavata) in the Balearic Islands (Western Mediterranean)

by
Francesca Ferragut-Perello
1,*,
Sergio Ramírez-Amaro
1,2,
Athanassios C. Tsikliras
3,
Natalia Petit-Marty
4,
Donna Dimarchopoulou
5,6,
Enric Massutí
1,
Alba Serrat
1 and
Francesc Ordines
1
1
Centre Oceanogràfic de les Balears (COB-IEO), CSIC, Moll de Ponent s/n, 07015 Palma, Spain
2
Laboratori de Genètica, Universitat de les Illes Balears, Cra. de Valldemossa km 7.5, 07122 Palma, Spain
3
Laboratory of Ichthyology, School of Biology, Aristotle University of Thessaloniki, 541 24 Thessaloniki, Greece
4
Institute of Marine Research (IIM-CSIC), Avenida Eduardo Cabello 7, 36208 Vigo, Spain
5
Department of Biology, Dalhousie University, 1355 Oxford St, P.O. Box 15000, Halifax, NS B3H4R2, Canada
6
Department of Biology, Woods Hole Oceanographic Institution, 360 Woods Hole Rd, Woods Hole, MA 02540, USA
*
Author to whom correspondence should be addressed.
Fishes 2023, 8(2), 117; https://doi.org/10.3390/fishes8020117
Submission received: 13 January 2023 / Revised: 16 February 2023 / Accepted: 17 February 2023 / Published: 19 February 2023
(This article belongs to the Special Issue Cartilaginous Fishes: Stock Assessment and Population Dynamics)

Abstract

:
Fisheries management requires the best scientific knowledge on the exploitation and conservation status of stocks. This is challenging for by-catch species, for which necessary data for their assessment is more limited than for target ones. That is the case for the thornback ray, Raja clavata, in the Balearic Islands (western Mediterranean), whose exploitation and conservation status are addressed here for the first time, in an integrative approach, by using innovative assessment methods and genetic diversity analysis. The time series of fishing landings from 1964 and MEDITS trawl survey data from 2004 were used to apply CMSY++ and Bayesian state-space Schaefer production models. We also estimated the genetic diversity of the Cytochrome C Oxidase subunit I mitochondrial gene from 31 individuals collected during MEDITS surveys. The species showed overexploitation with a current fishing mortality (F) below that producing maximum sustainable yield (FMSY), but with a current stock biomass (B) lower than BMSY. Despite the fact that the exploitation status is stable or even has improved in the last decades, the overexploitation period since the late 1970s seems to have reduced levels of genetic diversity, below those of related species and other populations of R. clavata. This low genetic diversity may entail the loss of adaptive potential, making the species more vulnerable to fishing and the current climate change.

Graphical Abstract

1. Introduction

During the last decades, the assessment and management of fisheries is progressively changing from a single-species to an ecosystem approach [1]. Although the level of exploitation and status of most target stocks are periodically assessed, and used for the management of fisheries, the sustainability of marine ecosystems and fisheries also requires avoiding the degradation of ecosystems, considering not only the fisheries target species, but also the other components of the ecosystem, such as non-target species, non-commercial species, vulnerable species, trophic webs and environmental conditions [2], among others.
Elasmobranchs are a vulnerable group usually exploited by fisheries as a by-catch [3], and consequently not a priority of stock assessments. Many species are top predators playing an important role in marine ecosystems with top-down control [4], but despite being a key group, there are large gaps in the knowledge of the exploitation and conservation status of most of these species.
The thornback ray (Raja clavata Linnaeus, 1758) is a batoid species belonging to the Rajidae family. It is widely distributed throughout the Atlantic Ocean from Norway to South Africa, the south-western Indian Ocean and the Mediterranean and the Black Sea [5,6] and exploited in all these areas, especially in the Mediterranean [7]. This skate species is mainly found in sandy-muddy bottoms, from the shallow continental shelf to the upper slope [5,8].
Like most elasmobranchs, R. clavata is a vulnerable species, with a low-recovery capacity from overfishing and other anthropogenic impacts, due to its life-history traits [3]. It exhibits a k-selected strategy, with biological characteristics such as: (i) large body size, up to almost 90 cm in length and around 4 kg, and slow growth with a long life span, up to 12–15 years [9,10]; (ii) late sexual maturity, with sizes at first maturity reaching around 65–70 and 75–80 cm total length for males and females, respectively, when individuals are approximately between 5 and 7 years old [9,11,12]; and (iii) low fecundity, with the highest estimations of annual production barely exceeding 200 eggs [13,14,15].
In the western Mediterranean, elasmobranchs have been overexploited since the 1970s [11]. In this area, R. clavata is the batoid species with the highest economic importance, and it is commonly caught with bottom trawl, trammel nets and longlines (e.g., [10,16,17,18]). The species was assessed as “Near Threatened” by the International Union for Conservation of Nature (IUCN) at both global and Mediterranean Sea levels [19]. In general, most available studies on its abundance trend or assessments have shown a decline or an overexploitation status in the Mediterranean populations. In the Gulf of Lions, the species showed a continuous declining trend in landings since the middle eighties, confirmed by trawl surveys, also showing an important decrease in its distribution [20]. In the Strait of Sicily, low abundances of R. clavata were reported, although with a recovering trend since 1985 [21,22] and recently assessed as being in a healthy condition [22]. In the Adriatic Sea, negative changes occurred since the late 1940s, including an important reduction in the distributional area and a significant decline in abundance [16]. In the Ligurian Sea, northern Tyrrhenian Sea, Malta and southern Sicily, the species was assessed as overfished [23].
In the Balearic Islands, R. clavata has shown an increasing trend in both density and biomass recorded from trawl surveys during the last decades [11]. This last study analysed the recent trends of this species and other elasmobranchs, but without assessing their exploitation status, due to the lack of enough data to apply stock assessment methods.
For by-catch species, age-based stock assessments are not commonly used due to a lack of age data. Therefore, the status of stocks and their fisheries exploitation pattern can be assessed using surplus production models, which require catch and effort data or an index of biomass or relative abundance (e.g., catch per unit of effort) as input [24]. As current fisheries management is based on fishing mortality and biomass reference points that correspond to maximum sustainable yield (MSY), CMSY++ is a stock assessment method that uses a surplus production model to estimate biological and fisheries-related reference points within the MSY concept [24,25].
On the other hand, a more direct methodology has been recently proposed to assess the conservation status of species [26]. Considering genetic diversity is the raw material for natural selection, allowing species to adapt to new environmental conditions [27,28,29,30,31,32,33], several authors developed a genetic approach based on the genetic diversity in the COI (Cytochrome C Oxidase subunit I) mitochondrial gene, commonly known as “DNA barcode”. They demonstrated that the nucleotide diversity of this gene can be used as a proxy for species’ conservation status by showing that declining species, categorized as threatened by IUCN, have lower genetic diversity. The usefulness of this approach for the diagnosis of the conservation status of exploited teleost fish species has been validated more recently [34]. This study has shown that genetic diversity in COI matches the expectations and theoretical predictions, based on commercial importance, biological characteristics and stock assessments of long-term exploited species.
The present work aims to diagnose the exploitation and conservation status of R. clavata population in the Balearic Islands from innovative assessment methods allowing for the use of the long time series of catches and relative biomass of this species in the area, and genetic diversity analysis. To implement this last approach, we develop different comparative genetic diversity benchmarks at three levels: populations, species within Rajiformes order and species within Elasmobranchii class. The relationship between exploitation status and conservation is also discussed.

2. Materials and Methods

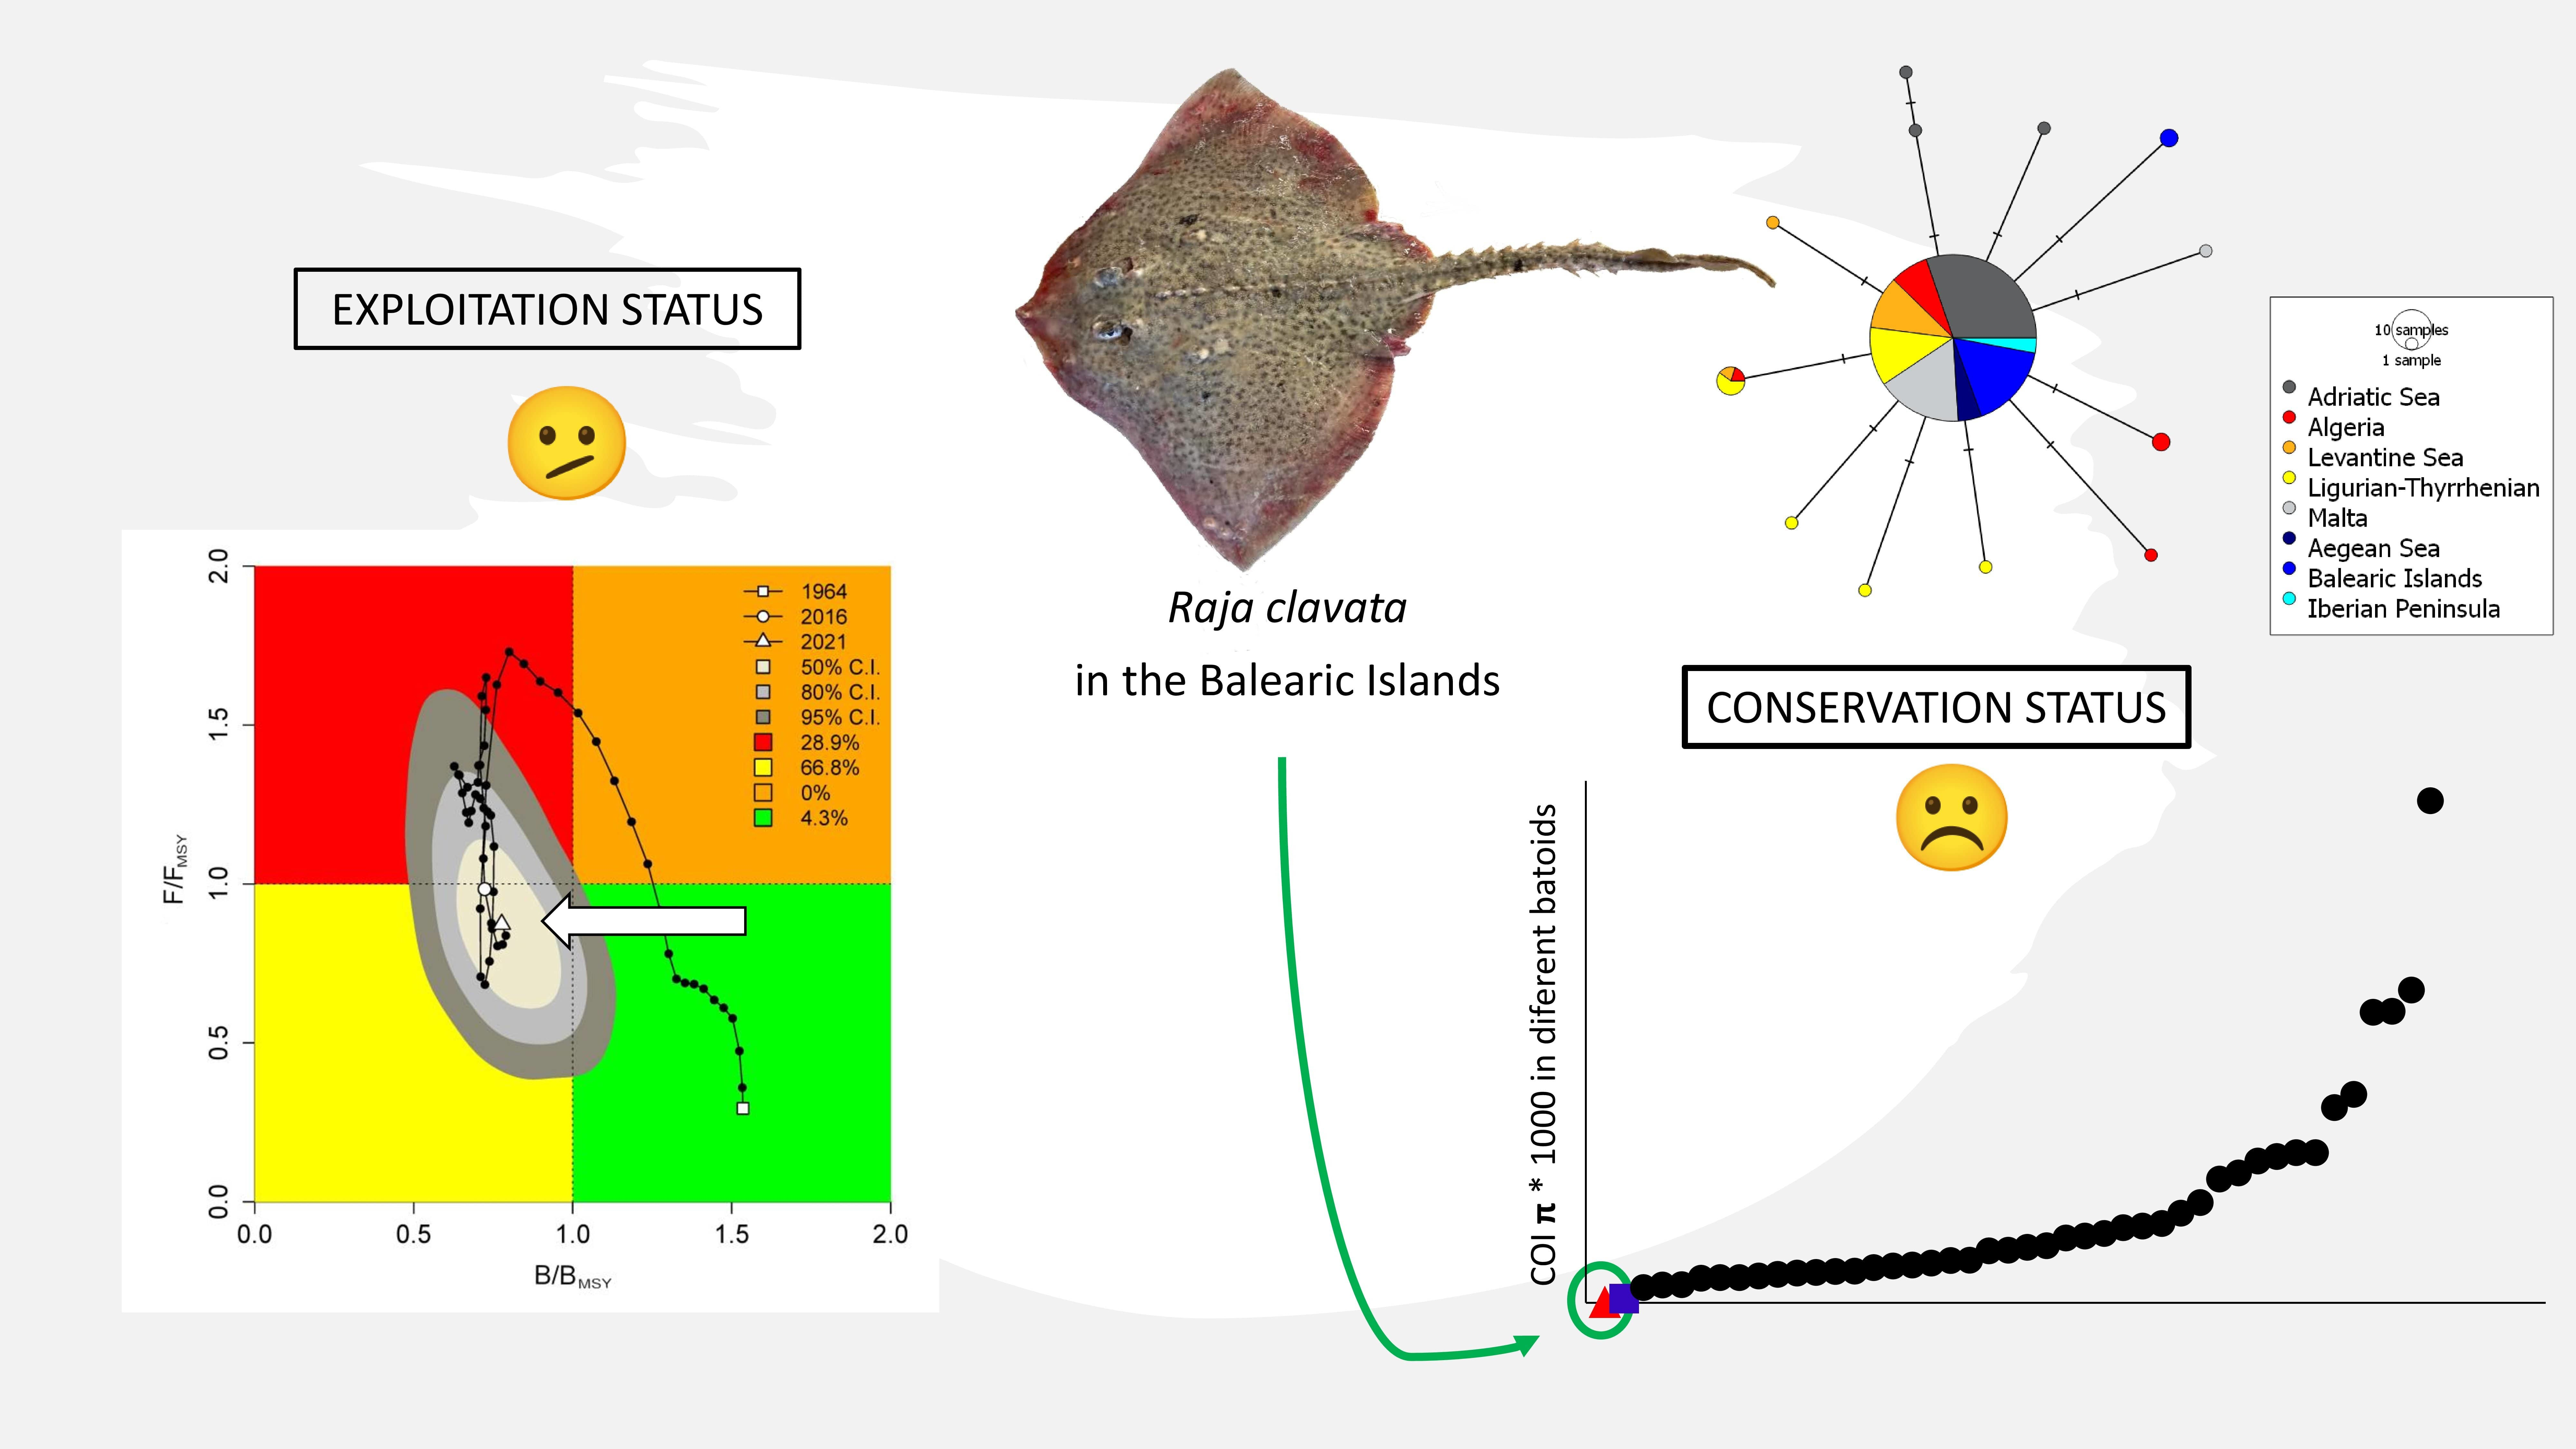
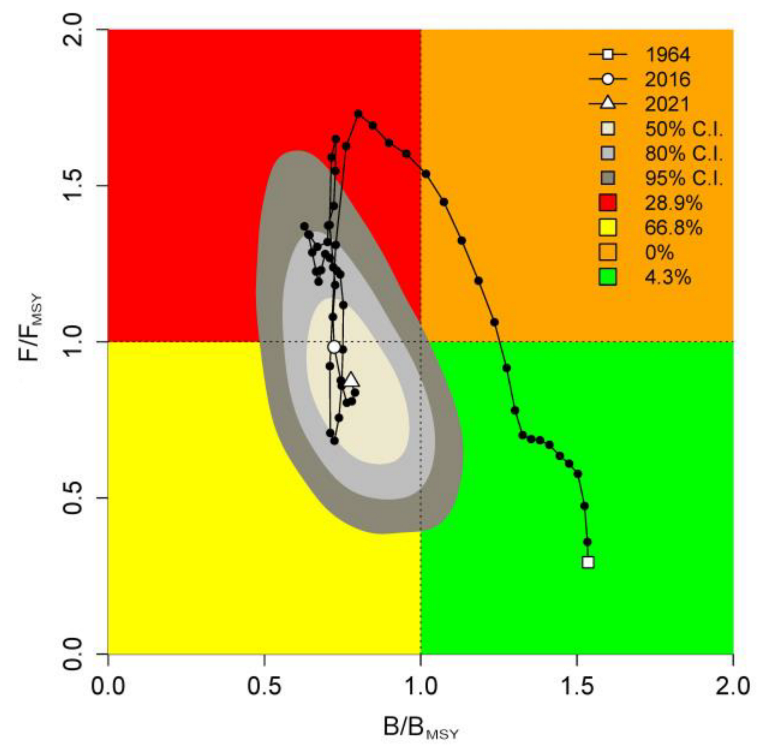
2.1. Stock Assessment for Exploitation Status

The open-source CMSY++ tool [25] is a data-limited method that from fishing catch or landings data and scientific survey fisheries-independent data, combined with species resilience (estimated based on previous assessments and available in FishBase [35]), estimates the following fisheries reference points regarding stock status:
  • Relative biomass (B/BMSY): the ratio between the current biomass (B) and the biomass that would provide the maximum sustainable yield (BMSY).
  • Exploitation rate (F/FMSY): the ratio between the current fishing mortality (F), and the fishing mortality associated with the Maximum Sustainable Yield (FMSY) [33].
CMSY++ combines information on the stock’s productivity and exploitation history and can also account for gaps (or absence) in abundance information, which is its main advantage with respect to other models [36]. When both fisheries catch (weight) and biomass or abundance (weight or individuals per km2, respectively) indices from scientific surveys are available, a Bayesian state-space Schaefer surplus production model (BSM component) is used to produce refined stock status estimates for MSY, FMSY, BMSY, B/BMSY and F/FMSY [36]. The method also estimates MSY, FMSY, BMSY, B/BMSY and F/FMSY based on catch data only (CMSY component). Both components (CMSY and BSM) are presented in the results but the BSM one is considered to produce more robust results.
A long-time series of landings data was obtained from Palma’s fish market sales bills from 1964 to 2021. Catches from all ports of Mallorca are commercialised in this fish market. In the sales bills, skates are not specified at the species level but as the commercial category Rajada in which most of the Rajidae species are gathered. However, most of the Rajidae species are discarded due to their low economic value and small size, making the great majority of the Rajada category R. clavata. To determine the percentage that this species represents within the Rajada category, we analysed the composition of this category from the data collected by scientific observers on board the commercial fishing fleet of the Balearic Islands during 22 years (2000–2021), which includes the weight of the different Rajidae species in this commercial category (species belonging to genera Leucoraja spp. and Raja spp.). The mean percentage represented by R. clavata during this period was used to rebuild the whole time series of the landings of this species since 1964.
For the CMSY++ method, we used catch data (landings) and also estimations of R. clavata standardised biomass data (from 2004) from the Balearic Islands. This data is annually collected during the MEDITS scientific surveys (International bottom trawl survey in the Mediterranean [37]) carried out in Mallorca and Menorca since 2001 [38]. These surveys take place during spring and use the GOC-73 experimental bottom trawl to sample demersal communities and resources of the fishing exploited bottoms (for more specific information see [39]). Hauls are carried out during the daytime, with an effective duration between 20 and 60 min, depending on the bathymetric stratum, at 2.5–3 knots of mean speed. Horizontal and vertical openings of the net during the haul (18–22 and 2.5–3.2 m, respectively) are recorded using SCANMAR or MARPORT systems. Using the horizontal opening of the net and the covered distance, estimated from GPS, we calculated the swept area by sampling station, which was finally used to standardise biomass data (in tonne per km2). The sampling scheme followed a standardized protocol [40] approved by international authorities (EU/DG Mare, FAO/GFCM). If a live specimen of a rare species or a species subject to conservation measures was caught, it was quickly sampled (4–5 min) and returned to the sea unharmed, giving it a chance for survival, following the recommendation GFCM/36/2012/3 (http://www.gfcmonline.org/decisions/, accessed on 16 February 2023) on fisheries management measures for conservation of sharks and rays in the GFCM (General Fisheries Commission for the Mediterranean) area.

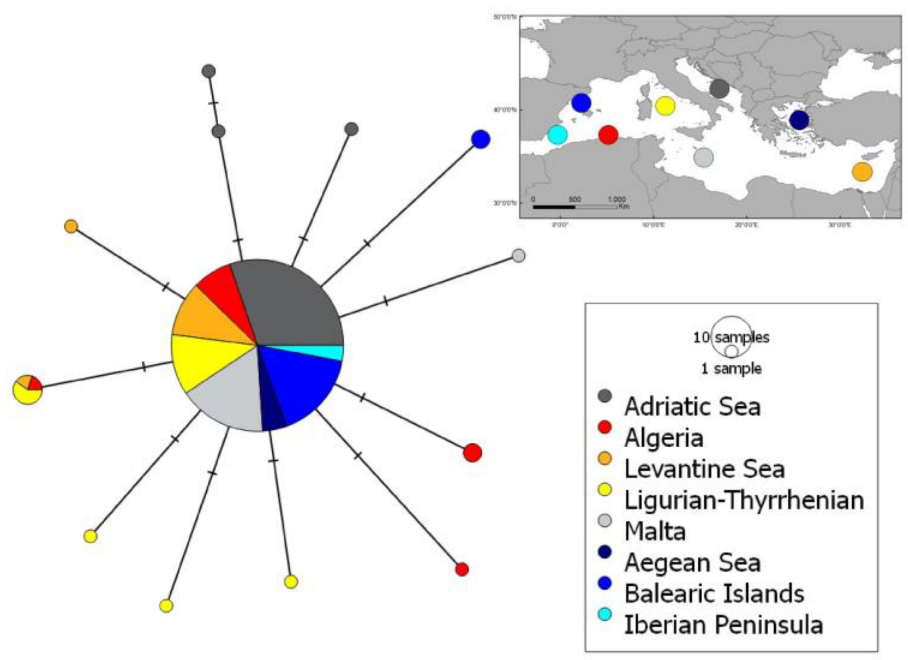
2.2. Genetic Analyses for Conservation Status

A small piece (1 cm2) of pelvic fin tissue from R. clavata individuals was collected and preserved in 96% ethanol during MEDITS surveys in 2021 and 2022 around Mallorca and Menorca, between 60 and 420 m of depth (Figure 1). DNA was extracted with the DNeasy Blood and Tissue Extraction kit (Qiagen, West Sussex, UK). Polymerase Chain Reaction (PCR) was used to amplify the partial mitochondrial gen Cytochrome C Oxidase subunit I (COI; DNA barcode), with universal Fish primers FF2d/FR1d [41]. The PCR conditions were 35 cycles of 2 min at 95 °C, 1 min at 94 °C, 1 min at 54 °C and 11 min at 72 °C. The PCR products were purified using QIAquick® PCR Purification Kit (QUIAGEN) and sent to sequence by the Sanger method to the laboratory of the MACROGEN company in Madrid.
Sequences were edited and aligned with the BioEdit 7.0.5.2 software [42]. These sequences were deposited in the GenBank database (http://www.ncbi.nlm.nih.gov/genbank/, accessed on 11 November 2022) under the following IDs numbers: OP757665–OP757692. Additionally, three COI sequences of R. clavata from the Balearic Islands were added (GenBank IDs: KY949088, KY949091, KY949093 [43]).
In order to get insight into the conservation status of the of R. clavata in the Balearic Islands according to its genetic diversity level [34], different comparative datasets were built up using the bootstrapped mean and median values of the genetic diversity estimates (nucleotide diversity, π = n n 1 i j x i x j π i j ; where xi and xj are the frequencies of the ith and jth sequences, πij is the number of nucleotide differences per nucleotide site between the ith and jth sequences, and n is the number of sequences [44]) of different datasets:
  • R. clavata populations (N= 7): COI sequences data from different populations of R. clavata from the Mediterranean Sea and the Atlantic Ocean were obtained from GenBank. Only populations with 20 or more sequences from different individuals were kept (Supplementary Table S1).
  • Rajiformes species (N= 42): this dataset was obtained by selecting the Rajiformes species from the Elasmobranchii dataset, once it was prepared (see below).
  • Elasmobranchii species (N= 258): COI sequences from Elasmobranchii species with more than 15 sequences were downloaded from BOLDSystem v4 [45]. Only sequences with associated complete species names were included (i.e., sequences with abbreviations as sp. cf. var. in the species name were not considered). Sequences from complete mitochondrial genome projects and duplicate sequences were not included and IUPAC ambiguity codes were masked to N.
Sequences were grouped by population for R. clavata and by species for Rajiformes and Elasmobranchii datasets, and then aligned using the Muscle v5 software [46]. After alignments, sequences with less than 400 aligned sites and with indels not multiple of three were eliminated. The resulting alignments were analyzed with DnaSP v6 [47], using the function multi-files analysis. After DnaSP analysis, the percentages of polymorphic sites were calculated as S/NetSites for each species dataset, where S is the number of polymorphic sites and NetSites is the number of sites with information in all individuals. Alignments with percentages of polymorphic sites higher than 10% of NetSites were checked and divergent sequences with more than 10% of polymorphic sites and at less 50% of these polymorphic sites in a frequency lower than 0.10 were eliminated. Finally, alignments with less than 15 analyzed sequences were eliminated [34].
For Rajiformes and Elasmobranchii datasets, 95% Confidence Intervals (95%CI) of the mean and median values of genetic diversity by datasets were obtained by bootstrapping the genetic diversities estimates (π) by species (R = 10,000) using the Boot function in R with BCa method. For the population dataset, bootstrapping was performed for genetic diversity estimates of 100 re-samplings of 30 individuals of the Mediterranean and global (Mediterranean+Atlantic) populations without including Balearic Islands individuals. For R. clavata populations, additional genetic statistics were estimated using DnaSP v6 software [47]: number of haplotypes (NH), haplotype diversity ( h = n n 1 1 i p i 2 ; where pi is the frequency of the ith haplotype and n is the number of sequences [44]), nucleotide diversity (π) and Chi-Square test (gene flow and genetic differentiation analysis). Finally, a haplotype network was created with the dataset including all sequences from the Mediterranean (also the ones from populations with less than 20 sequences) with the PopART software, applying the TCS Network [48].

3. Results

3.1. Exploitation Status

The majority of the landed biomass, sold in the Rajada commercial category, corresponded to R. clavata. The mean proportion represented by this species in the registers of Rajada category during the last 22 years of samplings carried out by scientific observers on board the commercial fishing fleet was estimated to be 83% (±1.19).
The results of the CMSY++ method for the R. clavata stock in the Balearic Islands showed an MSY of 48.7 tonnes, which would be achieved at an FMSY of 0.054 and a BMSY of 829 tonnes. Although current fishing mortality is below FMSY (F/FMSY = 0.887), the CMSY++ method showed that the current stock biomass is below BMSY (B/BMSY = 0.766).
The exploitation rate showed an initial sharp increase from values around 0.3 to values around 1.5 during the first half of the 1980′s decade (Figure 2). This increase was followed by a sharp and brief decrease during the second half of this decade when F/FMSY values fell again below 1, and a subsequent increase until 2010, when the F/FMSY value reached its maximum, situated above 1.5. Since then, F has decreased until the current exploitation rate, slightly below 1. The stock biomass follows more or less the inverse trend to that of F/FMSY, with values decreasing from the first years of the time series until the beginning of the present century, although this decrease is different depending on the model applied. CMSY prediction shows a smoother decrease at the start of the time series and stabilization since 2010, whereas BSM prediction shows a more abrupt decrease at the beginning and stabilization since the early 2000s, and even a slight increase during the most recent years. However, both models’ predictions show the stock biomass decreases below BMSY since the beginning of the 1980′s and it has not recovered yet (Figure 2).
According to the Kobe diagram of the results obtained with the CMSY++ method, specifically with BSM since observed abundance data were available (Figure 3), the exploitation level of the studied stock increased through the time series which led to the deterioration of stock biomass. Specifically, the stock went from a healthy stock size and sustainable fishing pressure (green area) starting in 1964 and lasting for about 12 years, to higher exploitation levels (orange and red areas) and eventually starting to recover from low stock biomass, with reduced fishing pressure (yellow area, 65% probability) in 2021.

3.2. Conservation Status

A total of 537 base pairs (bp) for COI fragments were sequenced from the Balearic Islands samples. A set of 193 sequences from different areas in the Mediterranean was used: 31 sequences from the Balearic Islands (28 sequenced specifically in this work), 5 from the Iberian Peninsula, 17 from the Algerian coast, 26 from the Ligurian–Tyrrhenian Sea, 56 from the Adriatic Sea, 20 from the Levantine Sea, 30 from Malta and 8 from the Aegean Sea (see Supplementary Table S1).
A total of 13 haplotypes were identified in the Mediterranean (Figure 4). The main haplotype is found in all the analysed areas of the Mediterranean Sea and the second main haplotype is found in three areas: the Levantine Sea, Ligurian–Tyrrhenian Sea and Algerian coasts. All the other haplotypes were found exclusively in one area (Figure 4). We used a set of 163 sequences to create a comparative benchmark for Mediterranean R. clavata nucleotide diversity (COI-π). The areas with less than 20 sequences that therefore were removed were: the Algerian coasts, Aegean Sea and Iberian Peninsula. The number of haplotypes and haplotype and nucleotide diversity of all the Mediterranean analysed areas, the Mediterranean Sea, the Atlantic Ocean and the global population can be found in Table 1.
The results of genetic differentiation analysis (Chi-squared) between populations from the considered areas in the Mediterranean showed no significant differences between the Balearic Islands and other areas in the Mediterranean nor between the other areas, except between the Ligurian–Thyrrenian Sea and Adriatic Sea (Table 2).
The levels of genetic diversity of the Balearic Islands population (Table 1) fell below the low boundary of the 95%CI of all analysed datasets (Table 3). The Balearic Islands and Malta showed the lowest nucleotide diversity values, while the Ligurian–Tyrrhenian Sea presented the highest values (Table 1). Nucleotide diversity estimates were obtained for 258 species of Elasmobranchii (see Supplementary Table S2 for sequences IDs and Supplementary Table S3 for estimations of the genetic diversity of these species), including 42 Rajidae species. These nucleotide diversity levels for every analysed Rajiformes species are in all cases higher than the estimates estimated for R. clavata global population and the population in the Balearic Islands (Figure 5).

4. Discussion

Fisheries management involves a broad and complex set of tasks in order to achieve levels of sustainability. Therefore, the best scientific knowledge on the exploitation and conservation status of stocks is needed. In light of this requirement, fishery assessment has incorporated new approaches, including genetics [34,49,50]. In the present study, we use innovative assessment models (CMSY and BSM) and genetic methods (nucleotide diversity) to diagnose the exploitation and conservation status of the population of R. clavata in the Balearic Islands.
Our results suggest that R. clavata is currently overexploited. However, its biomass levels in recent years, although they are still unsustainable (i.e., below BMSY levels), seem to be stabilizing according to CMSY results and even increasing according to the BSM results. This finding agrees with previous publications studying the abundance and biomass trends of elasmobranchs and this particular species in the Balearic Islands [11,17]. This stability trend has also been observed in demersal elasmobranchs off Sardinia, such as Scyliorhinus canicula, Raja brachyura, Raja miraletus and also in R. clavata [51]
Moreover, the exploitation rate is currently below 1 (according to the BSM results) or barely above 1 for CMSY results, revealing a different pattern of overexploitation than that shown by the European hake (Merluccius merluccius) and the striped red mullet (Mullus surmuletus), two of the main target species of the demersal fisheries, which have been assessed in the Balearic Archipelago and are also distributed at similar depths than R. clavata, with F/FMSY of 4.4 and 2, respectively [52]. Currently, the only target species in the area showing values of fishing mortality (F) below FMSY is the Norway lobster (Nephrops norvegicus), which is mainly distributed in the upper slope, between 300 and 500 m depth [52], the bathymetric range less exploited by the trawling fleet of Mallorca and Menorca [53]. Raja clavata has a wide bathymetric range in the Balearic Islands, from 47 to 420 m depth, with an optimum around 220 m depth [54], hence presenting a large part of its population in the less exploited bottoms of the area, a fact that could have allowed keeping the exploitation level of this species relatively low compared to main target species of the trawl fishery.
According to the framework for describing the stock status and providing management advice in relation to reference points, established by the General Fisheries Commission for the Mediterranean (GFCM) [55], R. clavata population in the Balearic Islands, with low fishing mortality, since B/BMSY<1 and F/FMSY<1, is also in a status of overexploitation. Based on these reference points and this scenario, the recommended management advice by GFCM is to reduce F and/or implement a recovery plan [55].
Regarding the genetic diversity of the species, the Mediterranean areas with the lowest values of nucleotide and haplotype diversity were the Adriatic Sea, Malta and the Balearic Islands. By contrast, Ligurian and Tyrrhenian Seas showed the highest genetic diversity levels of the Mediterranean and some evidence of genetic differentiation. These two areas have been described as important nursery areas for several elasmobranch species [56]. This could explain the higher diversity values, since individuals from different areas of the Mediterranean would be mating there.
All the Mediterranean areas analysed here shared the most frequent haplotype, suggesting a unique population. This was also supported by the Chi-square test. This genetic homogeneity of R. clavata in the Mediterranean has also been observed in previous works, probably related to the narrowing in its distribution area and consequent isolation in refugial areas at lower latitudes during the Last Glacial Maximum (20,000 years ago) [57,58].
The comparisons of the R. clavata nucleotide diversity (COI-π) in the Balearic Islands against the comparative dataset, indicated significantly lower (<95%CI) genetic diversity levels than expected for the species globally and within the Mediterranean Sea, and also lower than the expected for Rajiformes and Elasmobranchii species. This was an unexpected result as this species is relatively common in the Mediterranean, being even the most abundant species among batoids in some areas. Genetic diversity values in COI may be influenced by historic changes in population sizes and species-specific traits [59]. As the population declines, a decrease in the levels of genetic diversity is expected, with a recovery time proportional to the generation time of the species [34]. Therefore, for species with a long generation time, as is the case of R. clavata (9–12 years; [57]), the levels of COI-π could reflect not only historical past events, such as the glacial period, but also high exploitation in the past decades. However, historical demographic analysis indicates that thornback ray populations started to expand between 580,000 and 362,000 years ago, and suggests that the Last Glacial Maximum (20,000 years ago) had mainly affected the distribution of populations rather than population size [57]. Thus, the low genetic diversity estimates for R. clavata in the Balearic Islands can be related with its high fishing exploitation during the past decades, even though the fishing effort has decreased in recent years. The effect of past overexploitation events is likely to drastically decrease the population size of R. clavata, resulting in small populations which are more susceptible to suffer from inbreeding and genetic drift and plausibly lead to a population bottleneck event [60]. This event produces a decrease in the gene pool of the population, because many gene variants, that were present in the original population, are lost [61]. Therefore, the remaining population has a very low level of genetic diversity, as is the case for the Mediterranean population of R. clavata.
The low genetic diversity of R. clavata makes this species especially vulnerable to fishing exploitation, as well as to changes in the marine environment. The conservation of genetic diversity within and among populations stems from the need to: (i) maintain the adaptability of natural populations; (ii) minimize changes in life-history traits (e.g., age, size at maturity, growth); and (iii) minimize changes in behaviour that influence dynamics of fish populations [62]. Therefore, it is important to continue monitoring genetic diversity, both spatially and temporally.
Overall, the results of this study indicate an unfavourable scenario for the conservation of R. clavata. On the one hand, the assessment results suggest that R. clavata is currently overexploited. Although the biomass levels in recent years seem to be stabilising, or even slightly recovering, according to CMSY or BSM components of the CMSY++ method, respectively, they are still under BMSY, probably because of the slow growth and late maturation of this species. On the other hand, the low genetic diversity of R. clavata indicates that it is especially vulnerable to global change, requiring the adoption of urgent measures to reduce the fishing pressure on its population both in the Balearic Islands and throughout the Mediterranean. Despite the recent decrease in its exploitation rate and increase in its stock size, the low genetic diversity of R. clavata in the Balearic Islands is concerning and can be clearly related to the long period of overfishing that this species population experienced in the past decades. This high exploitation was also experienced by other elasmobranchs that were abundant in the past in the Balearic Islands, such as Rhinobatos spp., Squatina spp. and Pristis pristis [63,64,65,66], but that could not resist it and nowadays are considered critically endangered or locally extinct in the area [67,68].
In conclusion, R. clavata is still far from a biomass size compatible with MSY in the Balearic Islands. The low genetic diversity this species shows in this area, and in the Mediterranean in general, makes it still very vulnerable to overexploitation, as the loss of genetic diversity decreases the capacity of adaptive responses, making the species more vulnerable to environmental changes caused by the current global change. For this reason, it is very important to assess the exploitation status of batoid species, prioritizing them in fisheries monitoring and also including the conservation status assessment, because, as it is shown in this study, although for R. clavata the exploitation rate has recently improved, stock biomass and conservation status are not optimal yet, and may require longer times to recover due to its biological characteristics.

Supplementary Materials

The following supporting information can be downloaded at: https://www.mdpi.com/article/10.3390/fishes8020117/s1, Table S1: Raja clavata sequences IDs and location; Table S2: Filtered worldwide Elasmobranchii sequences IDs; Table S3: Estimates of genetic diversity for Elasmobranchii species.

Author Contributions

Conceptualization, F.F.-P., F.O. and S.R.-A.; methodology, F.F.-P., F.O., S.R.-A., A.C.T., D.D. and N.P.-M.; writing—original draft preparation, F.F.-P., F.O. and S.R.-A.; writing—review and editing, F.F.-P., S.R.-A., A.C.T., N.P.-M., D.D., E.M., A.S. and F.O. All authors have read and agreed to the published version of the manuscript.

Funding

This study has been cofunded by the EU through the European Maritime and Fisheries Fund (EMFF) within the Data Collection National Program, management and use of data from fisheries sector; also by the Ministry of European Funds, University and Culture of the Baleric Islands through the grants for the training of research personnel 2021 (F. Ferragut-Perelló) and the Post-doctoral contract (S. Ramírez-Amaro) of the Vicenç Mut Estabilitat program co-financed by the Government of the Balearic Islands and the European Social Fund. N. Petit-Marty is supported by MSCA-PF FishAdapt 101066785. This research was partly funded by the European Union’s Horizon 2020 Research and Innovation Program (H2020-BG-10-2020-2), grant number No. 101000302—EcoScope (Ecocentric management for sustainable fisheries and healthy marine ecosystems). The funders had no role in study design, data collection and analysis, decision to publish or preparation of the manuscript.

Institutional Review Board Statement

The sampling scheme followed a standardized protocol [40] approved by international authorities (EU/DG Mare, FAO/GFCM). If a live specimen of a rare species or a species subject to conservation measures was caught, it was quickly sampled (4–5 min) and returned back to the sea unharmed, giving it a chance for survival, following the recommendation GFCM/36/2012/3 (http://www.gfcmonline.org/decisions/, accessed on 16 February 2023) on fisheries management measures for conservation of sharks and rays in the GFCM area.

Data Availability Statement

Restrictions apply to the availability of these data. Data was obtained from the fisheries sector and bottom trawl surveys and are available from the authors with the permission of the providers.

Acknowledgments

The authors thank the participants of the MEDITS surveys and the crew of the R/V Miguel Oliver.

Conflicts of Interest

The authors declare no conflict of interest.

References

  1. Browman, H.I.; Stergiou, K.I. Marine Protected Areas as a Central Element of Ecosystem-Based Management: Defining Their Location, Size and Number. Mar. Ecol. Prog. Ser. 2004, 274, 202–269. [Google Scholar] [CrossRef] [Green Version]
  2. Pikitch, E.K.; Santora, C.; Babcock, E.A.; Bakun, A.; Bonfil, R.; Conover, D.O.; Dayton, P.; Doukakis, P.; Fluharty, D.; Heneman, B.; et al. Ecosystem-Based Fishery Management. Science 2004, 305, 346–347. [Google Scholar] [CrossRef]
  3. Stevens, J.D.; Bonfil, R.; Dulvy, N.K.; Walker, P.A. The Effects of Fishing on Sharks, Rays, and Chimaeras (Chondrichthyans), and the Implications for Marine Ecosystems. ICES J. Mar. Sci. 2000, 57, 476–494. [Google Scholar] [CrossRef]
  4. Wetherbee, B.M.; Cortés, E. Food Consumption and Feeding Habits. In Biology of Sharks and Their Relatives; CRC press: Boca Raton, FL, USA, 2004; pp. 223–244. [Google Scholar]
  5. Ebert, D.; Stehmann, M. Sharks, Batoids, and Chimaeras of the North Atlantic. FAO Species Catalogue for Fishery Purposes. No. 7; FAO: Rome, Italy, 2013; ISBN 978-92-5-107466-4. [Google Scholar]
  6. Serena, F. Field Identification Guide to the Sharks and Rays of the Mediterranean and Black Sea. FAO Species identification guide for Fishery Purposes; Food and Agriculture Organization: Rome, Italy, 2005; p. 97. [Google Scholar]
  7. Bottari, T.; Rinelli, P.; Bianchini, M.L.; Ragonese, S. Stock Identification of Raja clavata L. (Chondrichthyes, Rajidae) in Two Contiguous Areas of the Mediterranean. Hydrobiologia 2013, 703, 215–224. [Google Scholar] [CrossRef]
  8. Follesa, M.C.; Marongiu, M.F.; Zupa, W.; Bellodi, A.; Cau, A.; Cannas, R.; Colloca, F.; Djurovic, M.; Isajlovic, I.; Jadaud, A.; et al. Spatial Variability of Chondrichthyes in the Northern Mediterranean. Sci. Mar. 2019, 83, 81–100. [Google Scholar] [CrossRef] [Green Version]
  9. Kadri, H.; Marouani, S.; Saïdi, B.; Bradai, M.N.; Bouaïn, A.; Morize, E. Age, Growth, Sexual Maturity and Reproduction of the Thornback Ray, Raja clavata (L.), of the Gulf of Gabès (South-Central Mediterranean Sea). Mar. Biol. Res. 2014, 10, 416–425. [Google Scholar] [CrossRef]
  10. Carbonara, P.; Bellodi, A.; Palmisano, M.; Mulas, A.; Porcu, C.; Zupa, W.; Donnaloia, M.; Carlucci, R.; Sion, L.; Follesa, M.C. Growth and Age Validation of the Thornback Ray (Raja clavata Linnaeus, 1758) in the South Adriatic Sea (Central Mediterranean). Front. Mar. Sci. 2020, 7, 586094. [Google Scholar] [CrossRef]
  11. Ramírez-Amaro, S.; Ordines, F.; Esteban, A.; García, C.; Guijarro, B.; Salmerón, F.; Terrasa, B.; Massutí, E. The Diversity of Recent Trends for Chondrichthyans in the Mediterranean Reflects Fishing Exploitation and a Potential Evolutionary Pressure towards Early Maturation. Sci. Rep. 2020, 10, 547. [Google Scholar] [CrossRef] [Green Version]
  12. Saglam, H.; Orhan, A. Reproductive Biology of Raja Clavata (Elasmobranchii: Rajidae) from Southern Black Sea Coast around Turkey. Helgol. Mar. Res. 2012, 66, 117–126. [Google Scholar] [CrossRef] [Green Version]
  13. Ellis, J.R.; Shackley, S.E. Observations on Egg-Laying in the Thornback Ray. J. Fish Biol. 1995, 46, 903–904. [Google Scholar] [CrossRef]
  14. Capapé, C.; Guélorget, O.; Vergne, Y.; Quignard, J.P. Reproductive Biology of the Thornback Ray Raja clavata (Chondrichthyes: Rajidae) from the Coast of Languedoc (Southern France, Northern Mediterranean). Vie et Milieu 2007, 57, 83–90. [Google Scholar]
  15. Serra-Pereira, B.; Figueiredo, I.; Gordo, L.S. Maturation, Fecundity, and Spawning Strategy of the Thornback Ray, Raja Clavata: Do Reproductive Characteristics Vary Regionally? Mar. Biol. 2011, 158, 2187–2197. [Google Scholar] [CrossRef]
  16. Krstulović Šifner, S.; Vrgoč, N.; Dadić, V.; Isajlović, I.; Peharda, M.; Piccinetti, C. Long-Term Changes in Distribution and Demographic Composition of Thornback Ray, Raja clavata, in the Northern and Central Adriatic Sea. J. Appl. Ichthyol. 2009, 25, 40–46. [Google Scholar] [CrossRef]
  17. Guijarro, B.; Quetglas, A.; Moranta, J.; Ordines, F.; Valls, M.; González, N.; Massutí, E. Inter- and Intra-Annual Trends and Status Indicators of Nektobenthic Elasmobranchs off the Balearic Islands (Northwestern Mediterranean). Sci. Mar. 2012, 76, 87–96. [Google Scholar] [CrossRef] [Green Version]
  18. Serena, F.; Mancusi, C.; Barone, M. Guida Pratica Di Identificazione Delle Razze (Rajidae) Del Mar Mediterraneo. Linee Guida per La Raccolte e l’analisis dei dati. Field Identification Guide to the Skates (Rajidae) of the Mediterranean Sea. Guidelines for Data Collection and Analysis. Biol. Mar. Mediterr. 2010, 17 (Suppl. 2), 204. [Google Scholar]
  19. Ellis, J. Raja clavata. The IUCN Red List of Threatened Species; 2016. [Google Scholar]
  20. Poisson, F. Review of the Available Data on Four Elasmobranches Species Caught by the French Fleets on the Mediterranean Coast (Gulf of Lions and Corsica). In Proceedings of the Workshop on Stock Assessment of Selected Species of Elasmobranchs in the GFCM area, Brussels, Belgium, 12–16 December 2011. [Google Scholar]
  21. Garofalo, G.; Gristina, M.; Fiorentino, F.; Cigala Fulgosi, F.; Norrito, G.; Sinacori, G. Distributional Pattern of Rays (Pisces, Rajidae) in the Strait of Sicily in Relation to Fishing Pressure. Hydrobiologia 2003, 503, 245–250. [Google Scholar] [CrossRef]
  22. Falsone, F.; Gancitano, V.; Geraci, M.L.; Sardo, G.; Scannella, D.; Serena, F.; Vitale, S.; Fiorentino, F. Assessing the Stock Dynamics of Elasmobranchii off the Southern Coast of Sicily by Using Trawl Survey Data. Fishes 2022, 7, 136. [Google Scholar] [CrossRef]
  23. Proceedings of the General Fisheries Commission for the Mediterranean Report of the Fourteenth Session of the Scientific Advisory Committee; Scientific Advisory Committee: Sofia, Bulgaria.
  24. Tsikliras, A.; Froese, R. Maximum Sustainable Yield. In Encyclopedia of Ecology; Fath, B., Ed.; Elsevier: Oxford, UK, 2019; Volume 1, pp. 108–115. [Google Scholar]
  25. Froese, R.; Winker, H.; Coro, G.; Palomares, M.L.D.; Tsikliras, A.C.; Dimarchopouplou, D.; Touloumis, K.; Demirel, N.; Scarcella, G.; de Souza Vianna, G.M.; et al. Catch Time Series as the Basis for Fish Stock Assessments: CMSY++ and Its Applications.; GEOMAR: Kiel, Germany, 2021. [Google Scholar]
  26. Petit-Marty, N.; Vázquez-Luis, M.; Hendriks, I.E. Use of the Nucleotide Diversity in COI Mitochondrial Gene as an Early Diagnostic of Conservation Status of Animal Species. Conserv. Lett. 2021, 14, e12756. [Google Scholar] [CrossRef]
  27. Spielman, D.; Brook, B.W.; Frankham, R. Most Species Are Not Driven to Extinction before Genetic Factors Impact Them. Proc. Natl. Acad. Sci. USA 2004, 101, 15261–15264. [Google Scholar] [CrossRef] [Green Version]
  28. Conover, D.O.; Clarke, L.M.; Munch, S.B.; Wagner, G.N. Spatial and Temporal Scales of Adaptive Divergence in Marine Fishes and the Implications for Conservation. J. Fish Biol. 2006, 69, 21–47. [Google Scholar] [CrossRef]
  29. Allendorf, F.W.; England, P.R.; Luikart, G.; Ritchie, P.A.; Ryman, N. Genetic Effects of Harvest on Wild Animal Populations. Trends Ecol. Evol. 2008, 23, 327–337. [Google Scholar] [CrossRef]
  30. Hare, M.; Nunney, L.; Schwartz, M.K.; Ruzzante, D.; Burford, M.; Waples, R.S.; Ruegg, K.; Palstra, F. Understanding and Estimating Effective Population Size for Practical Application in Marine Species Management. Conserv. Biol. 2011, 25, 438–449. [Google Scholar] [CrossRef] [Green Version]
  31. Pinsky, M.L.; Palumbi, S.R. Meta-Analysis Reveals Lower Genetic Diversity in Overfished Populations. Mol. Ecol. 2014, 23, 29–39. [Google Scholar] [CrossRef]
  32. Bernatchez, L.; Wellenreuther, M.; Araneda, C.; Ashton, D.T.; Barth, J.M.I.; Beacham, T.D.; Maes, G.E.; Martinsohn, J.T.; Miller, K.M.; Naish, K.A.; et al. Harnessing the Power of Genomics to Secure the Future of Seafood. Trends Ecol. Evol. 2017, 32, 665–680. [Google Scholar] [CrossRef] [Green Version]
  33. Gandra, M.; Assis, J.; Martins, M.R.; Abecasis, D. Reduced Global Genetic Differentiation of Exploited Marine Fish Species. Mol. Biol. Evol. 2021, 38, 1402–1412. [Google Scholar] [CrossRef]
  34. Petit-Marty, N.; Liu, M.; Tan, I.Z.; Chung, A.; Terrasa, B.; Guijarro, B.; Ordines, F.; Ramírez-Amaro, S.; Massutí, E.; Schunter, C. Declining Population Sizes and Loss of Genetic Diversity in Commercial Fishes: A Simple Method for a First Diagnostic. Front. Mar. Sci. 2022, 9, 872537. [Google Scholar] [CrossRef]
  35. Froese, R.; Pauly, D. FishBase: A Global Information System on Fishes. Available online: https://www.fishbase.se/summary/Raja-clavata.html (accessed on 9 November 2022).
  36. Froese, R.; Winker, H.; Coro, G.; Demirel, N.; Tsikliras, A.C.; Dimarchopoulou, D.; Scarcella, G.; Quaas, M.; Matz-Lück, N. Status and Rebuilding of European Fisheries. Mar. Policy 2018, 93, 159–170. [Google Scholar] [CrossRef]
  37. Bertrand, J.A.; Gil de Sola, L.; Papaconstantinou, C.; Relini, G.; Souplet, A. The General Specifications of the MEDITS Surveys. Sci. Mar. 2002, 66, 9–17. [Google Scholar] [CrossRef] [Green Version]
  38. Massuti, E.; Reñones, O. Demersal Resource Assemblages in the Trawl Fishing Grounds off the Balearic Islands (Western Mediterranean). Sci. Mar. 2005, 69, 167–181. [Google Scholar] [CrossRef] [Green Version]
  39. Spedicato, M.T.; Massutí, E.; Mérigot, B.; Tserpes, G.; Jadaud, A.; Relini, G. The MEDITS Trawl Survey Specifications in an Ecosystem Approach to Fishery Management. Sci. Mar. 2019, 83, 9–20. [Google Scholar] [CrossRef] [Green Version]
  40. Anonymous. MEDITS Handbook, ninth version; MEDITS Working Group, 2017; p. 106. [Google Scholar]
  41. Ivanova, N.; Zemlak, T.S.; Hanner, R.H.; Hebert, P.D.N. Universal Primer Cocktails for Fish DNA Barcoding. Mol. Ecol. Notes 2007, 7, 544–548. [Google Scholar] [CrossRef]
  42. Hall, T.A. BioEdit: A User-Friendly Biological Sequence Alignment Editor and Analysis Program for Windows 95/98/NT. Nucl. Acids. Symp. Ser. 1999, 41, 95–98. [Google Scholar]
  43. Ramírez-Amaro, S.; Ordines, F.; Picornell, A.; Castro, J.A.; Ramon, C.; Massutí, E.; Terrasa, B. The Evolutionary History of Mediterranean Batoidea (Chondrichthyes: Neoselachii). Zool. Scr. 2018, 47, 686–698. [Google Scholar] [CrossRef]
  44. Nei, M. Genetic Distance between Populations. In Molecular Evolutionary Genetics; Columbia University Press: New York, NY, USA, 1987; pp. 208–253. [Google Scholar]
  45. Ratnasingham, S.; Hebert, P.D.N. A DNA-Based Registry for All Animal Species: The Barcode Index Number (BIN) System. PLoS ONE 2013, 8, e66213. [Google Scholar] [CrossRef] [Green Version]
  46. Edgar, R.C. MUSCLE v5 Enables Improved Estimates of Phylogenetic Tree Confidence by Ensemble Bootstrapping. bioRxiv 2021. bioRxiv:2021.06.20.449169. [Google Scholar] [CrossRef]
  47. Rozas, J.; Ferrer-Mata, A.; Sánchez-DelBarrio, J.C.; Guirao-Rico, S.; Librado, P.; Ramos-Onsins, S.E.; Sánchez-Gracia, A. DnaSP v6: DNA Sequence Polymorphism Analysis of Large Datasets. Mol. Biol. Evol. 2017, 34, 3299–3302. [Google Scholar] [CrossRef]
  48. Bandelt, H.; Forster, P.; Röhl, A. Median-Joining Networks for Inferring Intraspecific Phylogenies. Mol. Biol. Evol. 1999, 16, 37–48. [Google Scholar] [CrossRef]
  49. Ovenden, J.R.; Berry, O.; Welch, D.J.; Buckworth, R.C.; Dichmont, C.M. Ocean’s Eleven: A Critical Evaluation of the Role of Population, Evolutionary and Molecular Genetics in the Management of Wild Fisheries. Fish Fish. 2015, 16, 125–159. [Google Scholar] [CrossRef]
  50. Ramírez-Amaro, S.; Bassitta, M.; Picornell, A.; Ramon, C.; Terrasa, B. Environmental DNA: State-of-the-Art of Its Application for Fisheries Assessment in Marine Environments. Front. Mar. Sci. 2022, 9, 1004674. [Google Scholar] [CrossRef]
  51. Marongiu, M.F.; Porcu, C.; Bellodi, A.; Cannas, R.; Cau, A.; Cuccu, D.; Mulas, A.; Follesa, M.C. Temporal Dynamics of Demersal Chondrichthyan Species in the Central Western Mediterranean Sea: The Case Study in Sardinia Island. Fish Res. 2017, 193, 81–94. [Google Scholar] [CrossRef]
  52. FAO. Proceedings of the General Fisheries Commission for the Mediterranean-Report of the Twenty-Third Session of the Scientific Advisory Committee on Fisheries; FAO Fisheries and Aquaculture Report No. 1395; Scientific Advisory Committee on Fisheries: Rome, Italy. [CrossRef]
  53. Quetglas, A.; Guijarro, B.; Ordines, F.; Massutí, E. Stock Boundaries for Fisheries Assessment and Management in the Mediterranean: The Balearic Islands as a Case Study. Sci. Mar. 2012, 76, 17–28. [Google Scholar] [CrossRef] [Green Version]
  54. Ordines, F.; Massutí, E.; Moranta, J.; Quetglas, A.; Guijarro, B.; Fliti, K. Balearic Islands vs Algeria: Two Nearby Western Mediterranean Elasmobranch Assemblages with Different Oceanographic Scenarios and Fishing Histories. Sci. Mar. 2011, 75, 707–717. [Google Scholar] [CrossRef]
  55. FAO. Proceedings of the General Fisheries Commission for the Mediterranean-Report of the sixteenth session of the Scientific Advisory Committee; FAO Fisheries and Aquaculture Report No. R1102; Scientific Advisory Committee on Fisheries: Rome, Italy; p. 251.
  56. Catalano, G.; Crobe, V.; Ferrari, A.; Baino, R.; Massi, D.; Titone, A.; Mancusi, C.; Serena, F.; Cannas, R.; Carugati, L.; et al. Strongly Structured Populations and Reproductive Habitat Fragmentation Increase the Vulnerability of the Mediterranean Starry Ray Raja asterias (Elasmobranchii, Rajidae). Aquat. Conserv. 2022, 32, 66–84. [Google Scholar] [CrossRef]
  57. Chevolot, M.; Hoarau, G.; Rijnsdorp, A.D.; Stam, W.T.; Olsen, J.L. Phylogeography and Population Structure of Thornback Rays (Raja clavata L., Rajidae). Mol. Ecol. 2006, 15, 3693–3705. [Google Scholar] [CrossRef]
  58. Pasolini, P.; Ragazzini, C.; Zaccaro, Z.; Cariani, A.; Ferrara, G.; Gonzalez, E.G.; Landi, M.; Milano, I.; Stagioni, M.; Guarniero, I.; et al. Quaternary Geographical Sibling Speciation and Population Structuring in the Eastern Atlantic Skates (Suborder Rajoidea) Raja clavata and R. straeleni. Mar. Biol. 2011, 158, 2173–2186. [Google Scholar] [CrossRef] [Green Version]
  59. Ballard, J.W.O.; Whitlock, M.C. The Incomplete Natural History of Mitochondria. Mol. Ecol. 2004, 13, 729–744. [Google Scholar] [CrossRef] [Green Version]
  60. Frankham, R.; Ballou, J.D.; Briscoe, D.A. Introduction to Conservation Genetics; Cambridge University Press: Cambridge, UK, 2002; ISBN 0521639859. [Google Scholar]
  61. Nei, M.; Maruyama, T.; Chakraborty, R. The Bottleneck Effect and Genetic Variability in Populations. Evolution 1975, 29, 1–10. [Google Scholar] [CrossRef]
  62. Kenchington, E.; Heino, M.; Nielsen, E.E. Managing Marine Genetic Diversity: Time for Action? ICES J. Mar. Sci. 2003, 60, 1172–1176. [Google Scholar] [CrossRef] [Green Version]
  63. Oliver, F. Catálogo de La Fauna Marítima de Mallorca; Publicaciones del Instituto Social de la Marina: Palma, Spain, 1944. [Google Scholar]
  64. Maurin, C. Ecologie Ichthyologique Des Fonds Chalutables Atlantiques (de La Baie Ibéro-Marocaine à La Mauritanie) et de La Méditerranée Occidentale. Rev. Des Trav. De L’institut Des Pêches Marit. 1968, 32, 1–144. [Google Scholar]
  65. Barceló, F. Catálogo Metódico de Los Peces Que Habitan o Frecuentan Las Costas de Las Islas Baleares. Rev. De Los Prog. De Las Cienc. Exactas Físicas Y Nat. 1868, 18, 1–46. [Google Scholar]
  66. Lozano Rey, L. Ictiología Ibérica (Fauna Ibérica). Peces (Generalidades, Ciclóstomos y Elasmobranquios). Mus. Nac. De Cienc. Nat. 1928, 1, 1–692. [Google Scholar]
  67. Farriols, M.T.; Ordines, F.; Somerfield, P.J.; Pasqual, C.; Hidalgo, M.; Guijarro, B.; Massutí, E. Bottom Trawl Impacts on Mediterranean Demersal Fish Diversity: Not so Obvious or Are We Too Late? Cont. Shelf. Res. 2017, 137, 84–102. [Google Scholar] [CrossRef] [Green Version]
  68. Grau, A.M.; Mayol, J.; Oliver, J.; Riera, F.; Riera, I. Llibre Vermell Dels Peixos de Les Illes Balears; Conselleria de Medi Ambient, Agricultura i Pesca: Palma, Spain, 2015. [Google Scholar]
Figure 1. Location of the Raja clavata samples that were genetically analysed. Isobaths: 50, 100, 200, 400 and 800 m.
Fishes 08 00117 g001
Figure 2. Relative stock size B/k (proxy for B/BMSY) and exploitation rate (F/FMSY) of Raja clavata in the Balearic Islands between 1964 and 2021. Blue and red lines show the predictions estimated from CMSY and the Bayesian state-space Schaefer surplus production (BSM) components of the CMSY++ method, respectively. The dots indicate the observed abundance data scaled by BSM. The horizontal dashed lines represent BMSY and FMSY and the dotted line in the stock size plot indicates 0.5BMSY.
Fishes 08 00117 g002
Figure 3. KOBE phase plot obtained with the CMSY++ method, representing the time series of exploitation rate (F/FMSY) and relative stock size (B/BMSY) of Raja clavata in the Balearic Islands during the period 1964–2021. Colour code: red (top-left quadrant), F/FMSY > 1 and B/BMSY < 1 (experiencing overfishing and overfished); orange (top-right quadrant), F/FMSY > 1 and B/BMSY > 1 (healthy stock size about to be depleted by overfishing); yellow (bottom-left quadrant), F/FMSY > 1 and B/BMSY < 1 (reduced fishing pressure on stock recovering from low biomass level); green (bottom-right quadrant), F/FMSY > 1 and B/BMSY < 1 (sustainably exploited). CI: confidence intervals.
Fishes 08 00117 g003
Figure 4. Haplotype network for the COI (Cytochrome C Oxidase subunit I) mitochondrial gene fragment from Raja clavata in the Mediterranean Sea. Circles in the network are proportional to haplotype frequencies and colours indicate the area where the samples are from. Perpendicular little black lines indicate mutations.
Fishes 08 00117 g004
Figure 5. Levels of genetic diversity for the COI fragment (Cytochrome C Oxidase subunit I) mitochondrial gene (COI π) of Rajiformes species (black dots), Raja clavata global population Atlantic-Mediterranean (blue square) and Raja clavata in the Balearic Islands (red triangle). Species were ordered by their levels of COI π; these were multiplied by 1000 for graphical purposes.
Fishes 08 00117 g005
Table 1. Genetic diversity estimates for the COI (Cytochrome C Oxidase subunit I) mitochondrial gene fragment from Raja clavata for the different areas of the Mediterranean, including all of this area as well as the Atlantic Ocean and worldwide populations. N: number of samples, NH: number of haplotypes, h: haplotype diversity and π: nucleotide diversity; last two with their standard deviations (SD).
Geographical AreaNNHh ± SDπ ± SD
Balearic Islands3120.125 ± 0.0770.0002 ± 0.0004
Ligurian–Tyrrhenian Sea2650.406 ± 0.1160.0008 ± 0.0008
Adriatic Sea5640.105 ± 0.0560.0003 ± 0.0004
Levantine Sea2030.195 ± 0.1150.0004 ± 0.0005
Malta3020.067 ± 0.0610.0001 ± 0.0003
Mediterranean Sea163110.164 ± 0.0400.0003 ± 0.0005
Atlantic Ocean3130.471 ± 0.0740.0038 ± 0.0024
Worldwide194130.230 ± 0.0400.0011 ± 0.0010
Table 2. Results of the genetic differentiation analysis (Chi-squared) for the COI (Cytochrome C Oxidase subunit I) mitochondrial gene fragment between populations of Raja clavata in the Mediterranean Sea. X2: Chi-squared estimates; p: p-values; *: statistical significance.
Balearic IslandsLigurian-Tyrrhenian SeaAdriatic SeaLevantine SeaMalta
Balearic Islands X2 = 9.286
p = 0.098
X2 = 5.276
p = 0.260
X2 = 4.407
p = 0.221
X2 = 2.984
p = 0.225
Ligurian–Tyrrhenian SeaX2 = 9.286
p = 0.098
X2 = 14.942
p = 0.037 *
X2 = 4.397
p = 0.494
X2 = 8.410
p = 0.135
Adriatic SeaX2 = 5.276
p = 0.260
X2 = 14.942
p = 0.037 *
X2 = 6.705
p = 0.244
X2 = 3.482
p = 0.481
Levantine SeaX2 = 4.407
p = 0.221
X2 = 4.397
p = 0.493
X2 = 6.705
p = 0.244
X2 = 3.723
p = 0.293
MaltaX2 = 2.984
p = 0.225
X2 = 8.410
p = 0.135
X2 = 3.482
p = 0.481
X2 = 3.723
p = 0.293
Table 3. Mean and median values, with their 95% confidence intervals (CI), of genetic diversity (nucleotide diversity) for the COI (Cytochrome C Oxidase subunit I) mitochondrial gene fragment estimated for the Mediterranean and global (Atlantic-Mediterranean) populations of Raja clavata and for Rajiformes and Elasmobranchii species.
DatasetMean (95% CI)Median (95% CI)
Mediterranean0.00034 (0.0003–0.0004)0.00036 (0.0002–0.0004)
Global0.0012 (0.0011–0.0013)0.00115 (0.0010–0.0012)
Rajiformes0.0040 (0.0032–0.0069)0.0030 (0.0022–0.0032)
Elasmobranchii0.0070 (0.0054–0.0077)0.0030 (0.0024–0.0033)
Disclaimer/Publisher’s Note: The statements, opinions and data contained in all publications are solely those of the individual author(s) and contributor(s) and not of MDPI and/or the editor(s). MDPI and/or the editor(s) disclaim responsibility for any injury to people or property resulting from any ideas, methods, instructions or products referred to in the content.

