fish ecology report - The Cichlid Fishes of Lake Malawi, Africa
fish ecology report - The Cichlid Fishes of Lake Malawi, Africa
fish ecology report - The Cichlid Fishes of Lake Malawi, Africa

Create successful ePaper yourself
Turn your PDF publications into a flip-book with our unique Google optimized e-Paper software.
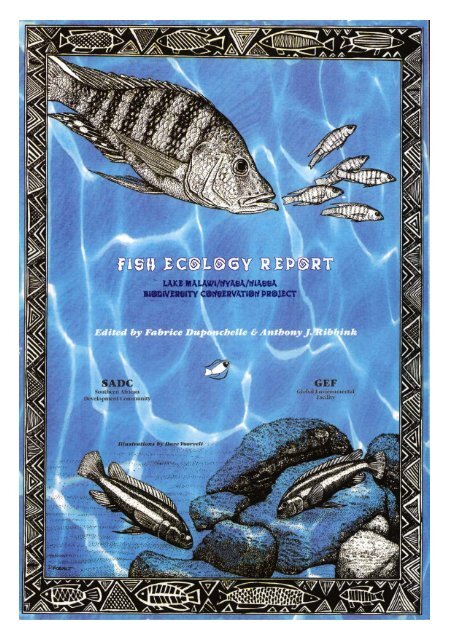
FISH ECOLOGY REPORT<br />
LAKE MALAWI/NYASA/NIASSA<br />
BIODIVERSITY CONSERVATION PROJECT<br />
Edited by<br />
Fabrice Duponchelle<br />
Institut de Recherche pour le Développement, Lab. GAMET, 361 rue J.F.<br />
Breton, BP 5095, 34033 Montpellier, France.<br />
Email: Fabrice.Duponchelle@mpl.ird.fr<br />
&<br />
Anthony J. Ribbink<br />
JLB Smith Institute <strong>of</strong> Ichthyology P Bag 1015, Grahamstown, 6140 South<br />
<strong>Africa</strong>.<br />
Email: A.Ribbink@ru.ac.za<br />
© 2000
Contents<br />
Acknowledgements<br />
General introduction<br />
F. Duponchelle & A.J. Ribbink …………….……………………………………………………… 1<br />
Chapter 1: Temporal trends <strong>of</strong> trawl catches in the North <strong>of</strong> the South West<br />
Arm, <strong>Lake</strong> <strong>Malawi</strong><br />
F. Duponchelle, A.J. Ribbink, A. Msukwa, J. Mafuka & D. Mandere ………………………..………….. 5<br />
Chapter 2: Depth distribution and breeding patterns <strong>of</strong> the demersal species<br />
most commonly caught by trawling in the South West Arm <strong>of</strong><br />
<strong>Lake</strong> <strong>Malawi</strong><br />
F. Duponchelle, A.J. Ribbink, A. Msukwa, J. Mafuka & D. Mandere …………………..……….………15<br />
Chapter 3: Growth patterns <strong>of</strong> some <strong>of</strong> the most important demersal <strong>fish</strong><br />
species caught by trawling in the South West Arm <strong>of</strong> <strong>Lake</strong> <strong>Malawi</strong><br />
F. Duponchelle, A.J. Ribbink, A. Msukwa, J. Mafuka & D. Mandere …………………………..…..… 169<br />
Chapter 4: Temporal diet patterns <strong>of</strong> some <strong>Lake</strong> <strong>Malawi</strong> demersal <strong>fish</strong><br />
species as revealed by stomach contents and stable isotope<br />
analysis<br />
F. Duponchelle, H. Bootsma, A.J. Ribbink, C. Davis, A. Msukwa, J. Mafuka & D. Mandere ……..………189<br />
Chapter 5: Morphometric, genetic and ecological comparison <strong>of</strong> two<br />
important demersal species along a gradient from the South West<br />
Arm to Nkhata Bay<br />
F. Duponchelle, J. Snoeks, M. Hanssens, J-F. Agnèse, A.J. Ribbink, A. Msukwa, J. Mafuka & D. Mandere ..202<br />
Chapter 6: <strong>The</strong> potential influence <strong>of</strong> fluvial sediments on rock-dwelling <strong>fish</strong><br />
communities<br />
F. Duponchelle, A.J. Ribbink, A. Msukwa, J. Mafuka & D. Mandere ………………….….227<br />
References cited ……………………………………………………………………………….....265<br />
Appendixes
Acknowledgements<br />
(F. Duponchelle)<br />
This <strong>report</strong> covers the work <strong>of</strong> the Ecology team <strong>of</strong> the SADC/GEF, <strong>Lake</strong><br />
<strong>Malawi</strong>/Nyasa Biodiversity Conservation Project for the period from June 1998 to the end <strong>of</strong><br />
the Project in July 1999. Given the late start <strong>of</strong> this part <strong>of</strong> the <strong>ecology</strong> work and the time<br />
constraints before the end <strong>of</strong> the project, the success <strong>of</strong> the several research programs<br />
undertaken by the Ecology team is indebted to many people for their support and assistance.<br />
We owe a special thank to the Fisheries Department <strong>of</strong> <strong>Malawi</strong> and to Alex Bulirani in<br />
particular for allowing Davis Mandere to join the Ecology team, for making the research<br />
vessel Ndunduma available in July and August 1998 and for the assistance and support he<br />
provided during the course <strong>of</strong> the Project and the writing up <strong>of</strong> the <strong>report</strong>.<br />
Most <strong>of</strong> the nearshore <strong>ecology</strong> research was done at the Maleri Islands and Thumbi<br />
West in Cape Maclear. We are grateful to the Department <strong>of</strong> National Parks and Wildlife for<br />
granting permission to work and collect <strong>fish</strong> and algae samples within the park.<br />
We would like to thank the Senga Bay station staff, including the two drivers, whose<br />
kindness and availability was precious, the administrative staff, the boat driver (Elias<br />
Mnenula), the ground and boat keepers.<br />
<strong>The</strong> implementation <strong>of</strong> the largest research program would not have been possible<br />
without the great help <strong>of</strong> Captain Mark Day and the crew <strong>of</strong> the research vessel Usipa, who<br />
always managed to make our trips successful and cheerful.<br />
Arriving in the last phase <strong>of</strong> such a large Project could have been uncomfortable both<br />
on the personal side without the warm welcome <strong>of</strong> every family on the compound and overall<br />
on the pr<strong>of</strong>essional side without the kind support <strong>of</strong> the senior Limnologist and Taxonomist,<br />
Dr H.A. Bootsma and Dr J. Snoeks, respectively. We acknowledge their respective teams,<br />
who put in many hours <strong>of</strong> work in support to our research programs, especially Mr A.<br />
Abdallah, Mr. M. Hanssens, Mr. J. Mwitta and Mr. B. Mwichande, Mr B. Ngatunga, Mr R.<br />
Sululu. We would also like to thank Dr R. Hecky for useful discussions and reviewing some<br />
chapters.<br />
People who are not much interested in pure science will acknowledge as much as us<br />
the artist, Mr David Voorvelt for the beautiful cover <strong>of</strong> the <strong>report</strong> and excellent <strong>fish</strong><br />
illustrations he provided. Once again he added pr<strong>of</strong>essional quality to products <strong>of</strong> the project.<br />
A mutually beneficial collaboration developed between the Ecology team and the local<br />
members <strong>of</strong> the European Union Project: "<strong>The</strong> trophic <strong>ecology</strong> <strong>of</strong> the demersal <strong>fish</strong><br />
community <strong>of</strong> <strong>Lake</strong> <strong>Malawi</strong>/Niassa", Mr W. Darwall and Dr P. Buat. We really appreciated<br />
the several interesting and motivating discussions we shared.<br />
Finally, as this section is not meant to be longer than the <strong>report</strong> itself, we have pleasure<br />
in acknowledging some <strong>of</strong> the many people who helped in various ways:<br />
E. Allison, E. Andre, T. Andrew, A. Banda, D.Barber, P.Bloch, R.Brooks, G. Chilambo, J.<br />
Chisambo, P. Cooley, M. Genner, S. Grant, G. Hartman, S. Higgins, K. Irvine, S. Kamoto, K.<br />
Kidd, H. Kling, B. Kumchedwa, R. Lowe-McConnell, W. Mark, F. Mkanda, T. Nyasulu, J.<br />
Manuel, G. McCullough, J. Moreau, P. Ramlal, R. Robinson, S. Smith, G. Turner.
General introduction
General introduction<br />
<strong>Lake</strong> <strong>Malawi</strong>/Niassa/Nyasa is the southern most <strong>of</strong> the East <strong>Africa</strong>n Rift <strong>Lake</strong>s, lying<br />
from 9°30'S to 14°30'S between three riparian countries: <strong>Malawi</strong>, Tanzania and Mozambique<br />
(Figure 1). It is one <strong>of</strong> the oldest (many million years, Lowe-McConnell et al. 1994, Konings<br />
1995, Stiassny & Meyer 1999) and largest lakes <strong>of</strong> the world. Its mean area (29 000 km²,<br />
Bootsma & Hecky 1993) makes it the 9 th largest lake in the world and 3 rd largest lake <strong>of</strong><br />
<strong>Africa</strong> after the lakes Victoria and Tanganyika (Lowe-McConnell 1993, Ribbink 1994,<br />
Konings 1995). <strong>Lake</strong> <strong>Malawi</strong> is located 472 m above the sea level, its maximum depth is 785<br />
m and averaged about 292 m (Bootsma & Hecky 1993). An important characteristic is that<br />
more than 80% <strong>of</strong> the lake is deeper than 200m (Thompson et al. 1996), depth under which it<br />
is permanently stratified and anoxic (Eccles 1974, Lowe-McConnell 1993). This basically<br />
means that the living space available for the <strong>fish</strong> and the other components <strong>of</strong> the food chains<br />
is only about 20% <strong>of</strong> the lake volume. About one third <strong>of</strong> <strong>Lake</strong> <strong>Malawi</strong>'s shoreline is steep<br />
and rocky whereas two thirds are gently sloping sandy beaches or swampy river estuaries<br />
(Lowe-McConnell 1994, Lowe-McConnell et al. 1994). One <strong>of</strong> the main distinctive features<br />
<strong>of</strong> the lake is its exceptional water clarity, upon which the entire ecosystem is highly<br />
dependent (Bootsma & Hecky 1993, Hecky & Bootsma 1999).<br />
However, the most well known characteristic <strong>of</strong> the lake is its exceptional <strong>fish</strong><br />
richness. It harbours greatest <strong>fish</strong> species richness than any other lake in the world (Fryer &<br />
Iles 1972, Ribbink 1988, Turner 1996). It is currently estimated that between 500 and 1000<br />
different <strong>fish</strong> species are present in the lake (Konings 1995, van Oppen et al. 1998), although<br />
only about a third are presently described or merely catalogued by a cheironym (Ribbink et al.<br />
1983). All these <strong>fish</strong>es, apart from 44 species belonging to nine other families (Ribbink et al.<br />
1983, Ribbink 1988), belong to a single family, the <strong>Cichlid</strong>ae. With the exception <strong>of</strong> chambo<br />
(Oreochromis spp.), all cichlids are closely related species, possibly descended from a single<br />
common ancestor (Meyer 1993, Meyer et al. 1990, Moran et al. 1994, Stiassny & Meyer<br />
1999). This tremendous cichlid <strong>fish</strong> diversity, known as a "species flock" (or a complex <strong>of</strong><br />
species flocks, Greenwood 1984), has evolved in a very short evolutionary time period, some<br />
<strong>of</strong> which may have been within the last 200 to 300 years for some species (Owen et al. 1990).<br />
More than 99% <strong>of</strong> these cichlid <strong>fish</strong> species are endemic <strong>of</strong> <strong>Lake</strong> <strong>Malawi</strong> (Ribbink 1991,<br />
Turner 1996), which means that they can't be found anywhere else in the world. Moreover,<br />
there is also a high degree <strong>of</strong> intra-lacustrine endemicity, many species belonging only to<br />
particular islands or stretches <strong>of</strong> shore within the lake (Ribbink & Eccles 1988, Eccles &<br />
Trewavas 1989, Ribbink 1991). <strong>The</strong>se peculiarities <strong>of</strong> the lake <strong>fish</strong>es have led to develop a<br />
great interest from the scientific community, challenged by the understanding <strong>of</strong> what<br />
constitutes the most striking example <strong>of</strong> rapid vertebrate radiation known at this day (Turner<br />
1998).<br />
Importance <strong>of</strong> the lake and its fragility<br />
<strong>Lake</strong> <strong>Malawi</strong>/Niassa/Nyasa is the fourth largest freshwater body in the world and<br />
constitutes an inestimable resource in this semi-arid region (Hecky & Bootsma 1999). It<br />
1
Figure 1. <strong>Lake</strong> <strong>Malawi</strong>, its catchment and the Rift valleys.
provides water for drinking, irrigation and domestic uses for people living on the lakeshores,<br />
but also <strong>fish</strong>. <strong>The</strong> value <strong>of</strong> the lake <strong>fish</strong>es does not lie only in their scientific interest, but also<br />
in their primordial nutritional status. In the <strong>Malawi</strong>an part at least, they sustain vitally<br />
important <strong>fish</strong>eries that provide 75% <strong>of</strong> the animal protein consumed by people and work for<br />
an estimated 35,000 <strong>fish</strong>ermen and presumably as many as 2,000,000 people through<br />
associated activities (Mkoko 1992, cited by Ribbink 1994 and Turner 1994b). Although the<br />
<strong>fish</strong> constitute, with the water itself, the most important resource <strong>of</strong> the lake and the main<br />
concern at this day, they are part <strong>of</strong> a complex ecosystem which needs to be preserved as a<br />
whole if it is to be used in a sustainable way. As mentioned previously, the <strong>fish</strong> and the other<br />
components <strong>of</strong> the food chains rely heavily on the water quality <strong>of</strong> the lake. <strong>The</strong> physical<br />
characteristics (depth, small outflow, long flushing time) <strong>of</strong> <strong>Lake</strong> <strong>Malawi</strong>/Niassa/Nyasa and<br />
their implications for pollution retention and ecosystem fragility have been discussed in detail<br />
by Bootsma & Hecky (1993). While its great depth allows the various pollutants to go<br />
undetected for many years, its low flushing rate makes the elimination process very long<br />
(several centuries) once thresholds are reached. <strong>The</strong> water quality has been a major issue <strong>of</strong><br />
the SADC/GEF Project, which has provided a sound scientific knowledge about the lake<br />
limnology (see Bootsma & Hecky 1999 for review). Though the lake is still in rather pristine<br />
condition, the first signs <strong>of</strong> changes have already been observed, for the phytoplankton<br />
species characteristic <strong>of</strong> eutrophic systems, which were formerly rare are now becoming<br />
progressively dominant (Hecky et al. 1999).<br />
Main threats to the <strong>fish</strong> diversity<br />
<strong>Malawi</strong> is a weakly industrialised country in which most <strong>of</strong> the people live directly<br />
upon natural resources through agriculture, <strong>fish</strong>eries and associated activities. <strong>The</strong><br />
demographic context, with one <strong>of</strong> the highest population density <strong>of</strong> <strong>Africa</strong> and an annual<br />
increase well over 3% (Ferguson et al. 1993, Kalipeni 1996), leads to a steadily increasing<br />
human pressure on the limited natural resources <strong>of</strong> the country. Two mains threats to the <strong>fish</strong><br />
communities can be distinguished and both are related to changes in the use <strong>of</strong> natural<br />
resources.<br />
1) - Fishing activities are the more direct human influences on <strong>fish</strong> communities. In<br />
absence <strong>of</strong> alternative employment, the rapidly growing human population exerts an<br />
increasing <strong>fish</strong> demand, which entails an increased pressure on the already overexploited<br />
stocks (Turner 1995). Despite their huge economical and scientific interests, very little is<br />
known about <strong>Lake</strong> <strong>Malawi</strong> cichlid <strong>fish</strong>es. As emphasised previously, about only one third <strong>of</strong><br />
the <strong>fish</strong> are described or catalogued, and new species are discovered regularly. Paradoxically,<br />
the most studied <strong>fish</strong> are the colourful rock-dwelling haplochromines, which are almost not<br />
exploited, except for the ornamental trade (Turner 1994b, 1995). <strong>The</strong> <strong>fish</strong> exploited for food<br />
purposes are those that inhabit the shallow and deep sandy shores. <strong>The</strong>y sustain a highly<br />
diversified traditional <strong>fish</strong>ery and a localised commercial mechanised <strong>fish</strong>ery that have greatly<br />
expended over the past 20 years (Tweddle & Magasa 1989) and, which are according to the<br />
most resent assessments, already fully or over-exploited (Turner et al. 1995, Turner 1995). It<br />
has been stressed that mechanised <strong>fish</strong>eries might be incompatible with the continued<br />
existence <strong>of</strong> the highly diverse cichlid communities and that maximising the <strong>fish</strong> yield would<br />
lead to a decline in the number <strong>of</strong> endemic species in the exploited area (Turner 1977b,<br />
Turner 1995). Fisheries scientists have already shown the critical effects <strong>of</strong> over exploitation,<br />
such as the reduction in population size, the modification <strong>of</strong> size structure and some local<br />
extinction <strong>of</strong> the larger cichlid species (Turner 1977a, 1977b, Turner 1995, Turner et al.<br />
1995). However, while it is believed that cichlid populations are likely to slowly recover from<br />
overexploitation given their life-history characteristics (Ribbink 1987), it has also been<br />
2
suggested that cichlid <strong>fish</strong>eries were more resilient than previously thought (Tweddle &<br />
Magasa 1989). As pointed out by Turner (1994b), "it is essential to distinguish between the<br />
resilience <strong>of</strong> a multi-species <strong>fish</strong> stock and the vulnerability <strong>of</strong> individual species". <strong>The</strong><br />
<strong>fish</strong>ery's resilience might be achieved through the unnoticed disappearance <strong>of</strong> several species.<br />
Given the importance <strong>of</strong> <strong>fish</strong> for people nutrition, there is an urgent need for an appropriate<br />
<strong>fish</strong>eries management regulations. However, beside the huge number <strong>of</strong> species exploited, the<br />
extent <strong>of</strong> the shore line, the great variety <strong>of</strong> <strong>fish</strong>ing techniques in use and their poorly known<br />
selectivity, effective <strong>fish</strong>eries management is currently hampered by the lack <strong>of</strong> knowledge<br />
about the <strong>fish</strong> taxonomy and life-histories. Taxonomy and systematic, which deal with species<br />
determination and description, provide species inventories and geographical distribution <strong>of</strong><br />
ichthy<strong>of</strong>auna that are basic information for any management and conservation purposes. On<br />
the other hand, <strong>fish</strong>eries management relies on mathematics models to predict the evolution <strong>of</strong><br />
stocks. <strong>The</strong>se models are heavily dependent upon population parameters, such as breeding<br />
season, age and size at maturity, fecundity, growth and mortality rates, which are currently<br />
missing (Lowe-McConnell et al. 1994, Worthington & Lowe-McConnell 1994, Turner 1995).<br />
If exploited stocks are to be managed properly, the gaps in understanding have to be filled so<br />
that outstanding information is gathered.<br />
An other interesting question is: are the species which decline or disappear from trawl catches<br />
actually endangered? Most target <strong>fish</strong> <strong>of</strong> trawl <strong>fish</strong>eries are sandy bottom species for which<br />
belonging to specific areas <strong>of</strong> the lake and degree <strong>of</strong> stenotopy are poorly known. <strong>The</strong>y also<br />
occur in other areas and/or depth <strong>of</strong> the lake where the localised mechanised <strong>fish</strong>eries do no<br />
longer occur (Banda & Tómasson 1996, Tómasson & Banda 1996). <strong>The</strong>ir relative<br />
disappearance from <strong>fish</strong>eries catches in a particular area might then not be a real threat to<br />
Biodiversity. However, our present state <strong>of</strong> knowledge miss some very important information<br />
concerning the notion <strong>of</strong> “population” for the exploited species. For example, the same<br />
species in two distant parts <strong>of</strong> the lake could belong to different populations, presenting life<br />
history and/or genetic variations. <strong>The</strong>y might also present morphological differences. In such<br />
a case the disappearance <strong>of</strong> one <strong>of</strong> these populations would be much more critical as it would<br />
lead to a lost <strong>of</strong> diversity. As most <strong>of</strong> the mechanised <strong>fish</strong>eries occurs in the southern part <strong>of</strong><br />
the lake, studies aiming to determine the population status <strong>of</strong> the exploited species should be<br />
carried out in order to assess the potentiality <strong>of</strong> re-colonisation from less exploited parts <strong>of</strong> the<br />
lake.<br />
2) – Together with <strong>fish</strong>ing, agriculture is the most important human activity in <strong>Malawi</strong>. <strong>The</strong><br />
steadily increasing human populations and the degradation <strong>of</strong> lands in the river catchments,<br />
such as deforestation, burning <strong>of</strong> vegetation, destruction <strong>of</strong> wet lands on the river banks for<br />
agricultural purposes and the cultivation <strong>of</strong> marginal areas, are cause <strong>of</strong> major concern. All<br />
these activities, by removing the vegetation cover, weaken the soil, which is carried away<br />
with its nutrients directly in the rivers by the rains and ultimately arrive in the lake. Another<br />
source <strong>of</strong> nutrients and pollution are the industrial sewage. <strong>The</strong> land clearance burning is also<br />
suspected to strongly participate to the atmospheric phosphorus deposition in the lake. <strong>The</strong><br />
limnology team <strong>of</strong> the SADC/GEF Project have identified the increasing load <strong>of</strong> sediments<br />
and nutrients received by the lake from rivers and atmosphere as the main threat to the water<br />
quality (Bootsma & Hecky 1999). <strong>The</strong> consequences <strong>of</strong> a sediment/nutrient enrichment <strong>of</strong> the<br />
lake on the water quality have been experienced in the Laurentian Great <strong>Lake</strong>s or <strong>Lake</strong><br />
Victoria and reviewed in Bootsma & Hecky (1993). Among the main effects <strong>of</strong> increased<br />
sediment and nutrient loads on aquatic communities (see Patterson & Makin 1998 for review),<br />
the reduction <strong>of</strong> available living space as the oxic/anoxic boundary moves up (Bootsma &<br />
Hecky 1993), the reduction <strong>of</strong> light penetration affecting photosynthetic rates or sexual mate<br />
choice (Seehausen et al. 1997), the reduction <strong>of</strong> habitat complexity and destruction <strong>of</strong><br />
3
spawning grounds are <strong>of</strong> direct importance for <strong>fish</strong> (Waters 1995, Evans et al. 1996, Lévêque<br />
1997). For instance, over-<strong>fish</strong>ing and siltation resulting from deforestation have strongly<br />
diminished the abundance <strong>of</strong> potadromous <strong>fish</strong> species in <strong>Lake</strong> <strong>Malawi</strong>/Niassa/Nyasa<br />
(Tweddle 1992). In <strong>Lake</strong> Tanganyika, species richness <strong>of</strong> <strong>fish</strong> was found much lower at sites<br />
with high sedimentation than at less disturbed sites (Cohen et al. 1993a). Similar observation<br />
were <strong>report</strong>ed for <strong>Lake</strong> Victoria, where increased turbidity was recognised partly responsible<br />
for the decline in cichlid diversity (Seehausen et al. 1997).<br />
Research program undertaken<br />
In June 1998, a new "senior Ecologist was appointed, in replacement <strong>of</strong> the former<br />
one, by the SADC/GEF <strong>Lake</strong> <strong>Malawi</strong> Biodiversity Conservation Project, which closing date<br />
was the 31/07/1999. Taking into account the main threats to the <strong>fish</strong> communities and the fact<br />
that a single annual cycle was left before the end <strong>of</strong> the project, we decided to focus our<br />
researches on the following particular aspects:<br />
- Provide the <strong>fish</strong>eries managers with the maximum information about the life histories<br />
(breeding season, age and size at maturity, fecundity, growth and mortality rates, diet) <strong>of</strong><br />
the main demersal cichlid species, and the temporal patterns <strong>of</strong> their distribution,<br />
abundance and diversity. <strong>The</strong>se research actions are detailed in Chapters 1 to 4.<br />
- As emphasised previously, for the conservation <strong>of</strong> biodiversity as well as for the <strong>fish</strong>eries<br />
management, it is crucial to known whether a species is represented by a single<br />
population widespread all over the lake, or by different populations (or stocks) with<br />
distinctive morphometric, genetic and life history characteristics. A complementary study<br />
has then been undertaken in collaboration with the taxonomists <strong>of</strong> the project, to compare<br />
the morphometrics, the genetics (microsatellites) and the life history traits <strong>of</strong> two species<br />
in four different locations between the SWA and Nkhata Bay. This part is detailed in<br />
Chapter 5.<br />
- Assess the potential influence <strong>of</strong> suspended sediments on the distribution, abundance,<br />
diversity and some life-history characteristics <strong>of</strong> the rocky shore cichlid <strong>fish</strong>es (Chapter<br />
6).<br />
4
Chapter 1:<br />
Temporal trends <strong>of</strong> trawl catches in<br />
the North <strong>of</strong> the South West Arm,<br />
<strong>Lake</strong> <strong>Malawi</strong>
Chapter 1: Temporal trends <strong>of</strong> trawl catches in the North <strong>of</strong> the<br />
South West Arm, <strong>Lake</strong> <strong>Malawi</strong><br />
F. Duponchelle, A.J. Ribbink, A. Msukwa, J. Mafuka & D. Mandere<br />
Introduction<br />
Since the closing <strong>of</strong> trawling activities between Domira Bay and Nkhotakota in 1993,<br />
the trawl <strong>fish</strong>eries occur only in the SE and SW Arms <strong>of</strong> the lake (Tweddle & Magasa 1989,<br />
Banda et al. 1996, Banda & Tómasson 1996). During the last two decades, a number <strong>of</strong><br />
<strong>report</strong>s and observations have pointed out the dangers <strong>of</strong> the current overexploitation <strong>of</strong> <strong>fish</strong><br />
communities by trawling that has already led to drastic changes in size structures <strong>of</strong> the<br />
exploited stocks and to decreasing catches in the southern part <strong>of</strong> the lake (Turner 1977a,<br />
1977b, Turner 1995, Turner et al. 1995, Banda et al. 1996). However, the SEA, which hold most<br />
<strong>of</strong> the commercial trawling, has received much more attention than the SWA, where only one<br />
pair-trawler operates in the shallower zone (Tómasson & Banda 1996, A. Bulirani, pers.<br />
com.). While numerous studies have been carried out to improve knowledge <strong>of</strong> species<br />
distribution and abundance for a better management <strong>of</strong> mechanised <strong>fish</strong>eries (review by<br />
Tweddle 1991), none had focused on the seasonal or temporal trends <strong>of</strong> catches in the SWA<br />
until the recent two year survey with three months sampling intervals carried out by<br />
Tómasson & Banda (1996). As the trawler operating in the SWA <strong>fish</strong> only in the shallow<br />
waters <strong>of</strong> the southern part <strong>of</strong> the arm and given that traditional <strong>fish</strong>eries are mostly confined<br />
to shallow and inshore areas (Banda & Tómasson 1996, Tómasson & Banda 1996), the<br />
<strong>of</strong>fshore part <strong>of</strong> the northern SWA can therefore be considered as almost unexploited, except<br />
for occasional surveys by the Ndunduma (A. Bulirani, pers. com.). <strong>The</strong>refore, the north <strong>of</strong> the<br />
SWA appeared to be the ideal area to conduct a program designed to assess the temporal<br />
trends <strong>of</strong> the distribution, diversity, abundance and the life histories <strong>of</strong> the most important <strong>fish</strong><br />
species caught by trawling. <strong>The</strong> unexploited aspect <strong>of</strong> the <strong>fish</strong> stocks was particularly<br />
favourable for the estimation <strong>of</strong> growth and natural mortality <strong>of</strong> the major species needed for<br />
<strong>fish</strong>eries management (Turner 1995). <strong>The</strong> following chapter deals with the temporal patterns<br />
<strong>of</strong> monthly trawl catches at exactly the same sites and depths in the north <strong>of</strong> the SWA over a<br />
complete annual cycle.<br />
Material and methods<br />
Trawl surveys<br />
<strong>The</strong> project's research vessel, R/V USIPA, was used for the surveys except for the<br />
months <strong>of</strong> July and August 1998, when the R/V NDUNDUMA was used. <strong>The</strong> NDUNDUMA,<br />
which belongs to the Fisheries Department, is a 17.5 m long trawler propelled by a 380 HP<br />
engine. R/V USIPA is a 15 m steel catamaran powered by twin 135 HP engines. <strong>The</strong> bottom<br />
trawl was approximately 40 m foot rope and 35 mm stretched cod end mesh. Morgère semi<br />
oval doors <strong>of</strong> 135kg each spread the trawl. Actual opening <strong>of</strong> the trawl was observed using<br />
5
Figure C1. <strong>The</strong> southern part <strong>of</strong> the <strong>Lake</strong> <strong>Malawi</strong>/Nyasa showing the South West Arm (SWA)<br />
and the South East Arm (SEA). <strong>The</strong> bars represent the monthly sample sites at 10, 30, 50,<br />
75, 100 and 125m depths.
the Scanmar height sensor, CT 150, and displayed on Scanmar’s color graphic monitor. <strong>The</strong><br />
trawl opening varied between 4.1 and 4.3 m.<br />
Each tow was for a duration <strong>of</strong> 20 minutes at a speed <strong>of</strong> ± 4630m/h (2.5 knots, range 2.3-2.7).<br />
On average the distance covered by each tow was 1543m. Swept area varied between<br />
175,279.49 m³ at 10m depth to 277,868.04 m³ at 125m depth (Capt. M. Day 1999).<br />
Each month from June 1998 to May 1999, one tow was done at 10, 30, 50, 75, 100<br />
and 125 m depth on approximately always the same sites along a line between Chipoka and<br />
Lukoloma (Figure C1). <strong>The</strong> exact positions <strong>of</strong> every tow are given in Appendix 1. Owing to<br />
ship availability, no sample was collected in September 1998.<br />
Species identification<br />
This is <strong>of</strong> common knowledge, species identification in <strong>Lake</strong> <strong>Malawi</strong> is a real problem<br />
(Lewis 1982, Tómasson and Banda 1996, Turner 1995, 1996). Despite the very useful book <strong>of</strong><br />
Turner (1996), <strong>fish</strong> identification remains extremely difficult on the field for many taxa.<br />
Moreover, as the identification problems are size-related, the small species (Aulonocara spp.,<br />
Nyassachromis spp., and some Placidochromis spp. for examples) are more likely to lead to<br />
inconsistencies.<br />
However, we had to work along with these problems and, as this program was aimed<br />
to provide the <strong>fish</strong>eries department with the basic life histories <strong>of</strong> the most commonly trawled<br />
species, it was decided that if mistakes were to occur, they had to be consistent with the<br />
Fisheries Department's mistakes. For this reason, Davis Mandere, Research Assistant and<br />
"field identifier" at the <strong>Malawi</strong> Fisheries Department, did all the <strong>fish</strong> identifications on board.<br />
During the first two cruises (June and July 1998), Mark Hanssens, support taxonomist on the<br />
SADC/GEF Project assisted him in species identification in order to ensure the consistency <strong>of</strong><br />
names used by the Fisheries Department and the SADC/GEF Project. George Turner was<br />
present for the August 1998 cruise and <strong>report</strong>ed some inaccuracies concerning<br />
Rhamphochromis spp. Diplotaxodon spp. and small species groups such Aulonocara spp. It is<br />
believed that inaccuracies concerning the Diplotaxodon spp. encountered in the <strong>fish</strong>ed area<br />
(limnothrissa, macrops, apogon, argenteus, greenwoodii and brevimaxillaris) were solved<br />
during that cruise, at least for the common species (limnothrissa, macrops, apogon,<br />
argenteus).<br />
As our study mainly focused on cichlids, the cat<strong>fish</strong>es were separated into three<br />
groups, Bathyclarias spp., Bagrus meridionalis and Synodontis njassae. No attempt was made<br />
to identify the species constituting the Bathyclarias spp. flock, which were lumped together<br />
into one group. Clarias gariepinus, rarely caught, was grouped within the Bathyclarias spp.<br />
complex. Despite the growing assumption that Synodontis njassae would be constituted by<br />
more than one species, no formal evidence has yet been provided and Synodontis were<br />
considered as a single species over their full depth range.<br />
Owing to the difficulty <strong>of</strong> identifying them accurately, Oreochromis spp. were lumped<br />
into one group, as were the Rhamphochromis spp.<br />
For the groups <strong>of</strong> small species such as Aulonocara spp., Nyassachromis spp., which<br />
species were not accurately identified, only the following species were recorded individually:<br />
Aulonocara 'blue orange', A. 'minutus', A. 'cf. macrochir', A. 'rostratum deep', Nyassachromis<br />
argyrosoma.<br />
It was suggested (J. Snoeks, pers. com.) that what we called Nyassachromis<br />
argyrosoma was probably a complex <strong>of</strong> different Nyassachromis spp., as these species are<br />
very difficult to identify and poorly known. However, for no particular anomaly appeared<br />
from data analysis, we kept considering it as a single species.<br />
Otopharynx argyrosma was also recorded as a single species, but it became evident while<br />
analysing the data (length-weight or fecundity-weight relationships) that more than one<br />
species were included under this name.<br />
6
As a rule, to avoid confusion given the rhythm imposed by sorting <strong>fish</strong> on board and<br />
to ensure the consistency <strong>of</strong> the name attributed to a given species, Davis Mandere was asked<br />
to consistently allocate a particular species the name he was used to, even when we knew the<br />
name had changed (or was wrong). <strong>The</strong> proper name was subsequently entered in the<br />
database. This was the case for the following species for instance:<br />
- Stigmatochromis guttatus was identified as 'woodi deep' on board.<br />
- Sciaenochromis benthicola was recorded as 'spilostichus' on board<br />
What we thought was Lethrinops 'longipinnis orange head' turned out to be<br />
Lethrinops argenteus (Snoeks, pers. com.). Actually, the characteristic L. longipinnis whose<br />
breeding male has a blue head and a dark striped body (see illustration p. 58 in Turner 1996)<br />
was never found in our <strong>fish</strong>ing area in the SWA. Some males were found sometimes with a<br />
darker dress, but never with a blue head. <strong>The</strong> species we identified as L. 'longipinnis orange<br />
head' is illustrated p. 57 (top right picture) in Turner's book (1996) as L. longipinnis Domira<br />
Bay. <strong>The</strong> taxonomy team <strong>of</strong> the project has found that L. longipinnis was a complex <strong>of</strong><br />
different species (Snoeks, pers. com.), and that Lethrinops 'longipinnis orange head' was<br />
definitely Lethrinops argenteus (Ahl 1927). In our case 99% <strong>of</strong> the specimen were found at<br />
depth between 10 and 50m, and seldom below. This tends to confirm that 'orange head'<br />
differs from longipinnis, which is supposed to frequently occur at greater depths (Turner<br />
1996).<br />
<strong>The</strong> spelling <strong>of</strong> species names used was that given in Turner (1996).<br />
Catch analysis<br />
For each tow, the cat<strong>fish</strong>es Bathyclarias spp. and Bagrus meridionalis were separated<br />
from the main catch, counted and weighed. <strong>The</strong> rest <strong>of</strong> the catch was then randomly<br />
distributed in 50 kg boxes and the weight recorded. <strong>The</strong> total catch weight (kg) was recorded<br />
as the sum <strong>of</strong> Bathyclarias spp., Bagrus meridionalis and the remaining catch.<br />
A 50 kg filled box was taken as a representative sample <strong>of</strong> the whole catch and<br />
analysed. Large and medium sized <strong>fish</strong> were sorted out <strong>of</strong> this sample with rare species and<br />
classified according to their taxonomic status. <strong>The</strong> weight <strong>of</strong> the remaining "small <strong>fish</strong>" (< 5-8<br />
cm TL) from the catch was weighed and a random sub-sample <strong>of</strong> about 3 kg was removed<br />
from the sample and placed in the deep freeze for later examination. When the large, medium<br />
and rare species were processed, the sub-sample <strong>of</strong> small <strong>fish</strong>es was processed following the<br />
same protocol.<br />
For each species, the number <strong>of</strong> specimens and their total weight was recorded to the<br />
nearest g. <strong>The</strong> standard length (SL) <strong>of</strong> each specimen was recorded to the nearest mm for<br />
analysis <strong>of</strong> length frequencies. When the number <strong>of</strong> specimens for a given species was too<br />
large, a sub-sample (which proportion in weight <strong>of</strong> the main sample was recorded) comprising<br />
at least 100 specimens was taken. This procedure was mainly used for the large males schools<br />
<strong>of</strong> identical size.<br />
Nine target species were selected according to their relative abundance, depth<br />
distribution and basic ecological characteristics (benthic or pelagic habits, broad trophic<br />
category) (Tómasson & Banda 1996, Turner 1996). <strong>The</strong>se were Lethrinops gossei Burgess &<br />
Axelrod, Lethrinops argenteus Ahl (= L. 'longipinnis orange head'), Diplotaxodon<br />
limnothrissa Turner, Diplotaxodon macrops Turner & Stauffer, Copadichromis virginalis<br />
Iles, Mylochromis anaphyrmus Burgess & Axelrod, Alticorpus mentale Stauffer & McKaye,<br />
Alticorpus macrocleithrum Stauffer & McKaye and Taeniolethrinops praeorbitalis Regan.<br />
For these species, all the females from each haul were preserved in formalin for later<br />
examination.<br />
7
Environmental data<br />
After each tow, a CTD cast and a grab sample were taken in the middle <strong>of</strong> the transect.<br />
Both CTD and the benthic grab were lowered using the hydrographic winch <strong>of</strong> the R/V<br />
USIPA. <strong>The</strong> CTD casts recorded, every 2 seconds during the way down and the way up,<br />
measures <strong>of</strong> the following parameters: depth (m), temperature (ºC), oxygen concentration<br />
(mg.l -1 ), conductivity (mS.cm -1 ), water clarity (% transmission), fluorescence (arbitrary unit).<br />
Grab samples<br />
After each trawl a sample <strong>of</strong> bottom sediments was taken in the middle <strong>of</strong> the trawl<br />
transect by using a 24 cm benthic grab sampler lowered on the hydrographic winch. <strong>The</strong> grab<br />
digs about 10 cm into the sediment in such a way that the upper layers form more <strong>of</strong> the<br />
sample than the lower layers. It therefore gives qualitative rather than quantitative<br />
information. Each sediment sample was placed in a bucket. A sub-sample was taken, placed<br />
in 250 ml plastic bottle and deep frozen for later determination <strong>of</strong> sediment particle size. In<br />
March, April and May 1999, after the sub-sample was removed, the remaining part <strong>of</strong> the<br />
sediment sample was fixed in formalin (10%) for later extraction <strong>of</strong> benthic organisms for<br />
stable isotope studies.<br />
Determination <strong>of</strong> sediment particle size:<br />
<strong>The</strong> deep frozen sub-sample was mixed by hand after de-freezing and a sub-sample <strong>of</strong> 200 cc<br />
was placed in a 1 liter measuring cylinder toped up to 1000 cc with water. <strong>The</strong> cylinder was<br />
then inverted and shaken several times to suspend the sediment in the water. <strong>The</strong> sediment<br />
was then passed through a series <strong>of</strong> sieves (2 mm, 1mm, 500 µm, 250 µm, 125 µm, 63 µm)<br />
starting at the largest aperture. <strong>The</strong> volume <strong>of</strong> sediment retained in each sieve was determined<br />
using a measuring cylinder filed with water. Size class boundaries were as follows: > 256 mm<br />
= boulders, 64-256 mm = cobbles, 4-64 mm = pebbles, 2-4 mm granules, 1-2 mm = very<br />
coarse sand, 500 µm-1 mm = coarse sand, 63 µm-500 µm = fine sand, < 63 µm = silt and clay<br />
(mud). According to the proportions <strong>of</strong> the different components, the sample was then<br />
roughly categorized as "very coarse sand" (> 1 mm), "medium sand" (250 µm-1 mm), "very<br />
fine sand" (63 µm-250 µm) and "mud"(
Total catch all depth (kg.pull-1)<br />
1600<br />
1400<br />
1200<br />
1000<br />
800<br />
600<br />
400<br />
200<br />
0<br />
Jul Aug Oct Nov Dec Jan Feb Mar Apr May<br />
1998 1999<br />
Figure C2. Total catches all depths pooled over the full sampling period (July 1998-May1999).<br />
CPUE per depth (kg. 20 min pull -1 )<br />
300<br />
250<br />
200<br />
150<br />
100<br />
50<br />
0<br />
10m 30m<br />
50m 75m<br />
100m 125m<br />
Jul Aug Oct Nov Dec Jan Feb Mar Apr May<br />
1998<br />
1999<br />
Figure C3. CPUE per depth over the full sampling period (July 1998-May1999).<br />
Total catch per depth category (kg.pull -1 )<br />
1200<br />
1000<br />
800<br />
600<br />
400<br />
200<br />
0<br />
Total 10-50m<br />
Total 75-125m<br />
Jul Aug Oct Nov Dec Jan Feb Mar Apr May<br />
1998 1999<br />
Figure C4. Total catch per depth category over the full sampling period (July 1998-May1999).
Results<br />
Catches per month<br />
Owing to non uniformity between the record sheets <strong>of</strong> June and the other months, the<br />
data for June 98 were not included in the analyses. <strong>The</strong> results presented below concern the<br />
period from July 1998 to May 1999.<br />
<strong>The</strong> total catches per months all depths pooled fluctuated from about 600 kg for six 20<br />
min pulls, to about 1000 kg (Figure C2). <strong>The</strong> high value recorded in August 1998 was due to<br />
an exceptional catch <strong>of</strong> Bathyclarias spp. at 50 m: 42 specimens giving a total <strong>of</strong> 400 kg, with<br />
a total catch <strong>of</strong> 626 kg (Figure C3). Individual catches fluctuated between 30.5 kg at 100 m in<br />
October and 283 kg at 75 m in July, excluding the 626 kg recorded in August (Figure C3).<br />
Temporal fluctuation was observed in the catches, the lowest were recorded in October 1998<br />
and March 1999 and the highest in July-August 1998 and January 1999 (Figure C2). This<br />
temporal fluctuation was also observed for each depth (Figure C3) and when depths were<br />
pooled per category (Figure C4). With the exceptions <strong>of</strong> July-August 1998 and May 1999, the<br />
catches in the shallows and the in the deep waters were very similar (Figure C4).<br />
Catches per depth<br />
<strong>The</strong> mean CPUE per depth, all months pooled (Figure C5a) showed that the highest<br />
catches were recorded at 50 m and the lowest at 30 m. Catches were generally higher in the<br />
deep zone (50 to 125m) than in the shallows (10 to 30m). Almost the same results were<br />
obtained when the exceptional catch <strong>of</strong> Bathyclarias spp. in August 1998 was removed,<br />
except that the highest catches were recorded at 75m (Figure C5b). However, no significant<br />
difference <strong>of</strong> catch among depths was found in either cases, respectively with (Kruskal-Wallis<br />
one-way ANOVA on ranks H=8.33, 5 df, p=0.139) or without the August Bathyclarias spp.<br />
catch (one-way ANOVA F=1.845, 5 df, p=0.118).<br />
125<br />
125<br />
100<br />
100<br />
Depth (m)<br />
75<br />
50<br />
Depth (m)<br />
75<br />
50<br />
30<br />
30<br />
10<br />
10<br />
0 50 100 150 200 250 300 350<br />
0 50 100 150 200 250<br />
a<br />
Mean CPUE (kg. 20 min pull -1 )<br />
b<br />
Mean CPUE (kg. 20 min pull -1 )<br />
Figure C5. Mean CPUE (kg / 20 min pull) per depth (± standard deviation) over the full sampling<br />
period in the SWA (July-98 to May 99) (a) and with the exceptional Bathyclarias spp. catch<br />
removed (b), see text.<br />
9
Table C1. Proportion in weight <strong>of</strong> the main demersal species trawled at 10m depth in the SWA (cat<strong>fish</strong>es species in italic).<br />
Species name Jul-98 Aug-98 Oct-98 Nov-98 Dec-98 Jan-99 Feb-99 Mar-99 Apr-99 May-99 Mean<br />
Aulonocara blue orange - 0,8 2,4 0,4 11,7 9,3 3,1 0,7 0,1 - 2,8<br />
Bagrus meridionalis 7,5 - 12,9 4,0 5,1 6,5 14,2 9,1 3,6 2,4 6,5<br />
Bathyclarias spp. 0,6 - 5,0 5,8 10,1 10,3 17,6 8,6 4,2 6,1 6,8<br />
Buccochromis lepturus 8,7 3,0 7,2 1,1 0,1 - 0,0 3,0 10,0 11,4 4,4<br />
Buccochromis nototaenia 2,1 0,4 1,0 0,1 0,5 0,6 0,0 0,6 1,6 - 0,7<br />
Chilotilapia rhoadesi 4,2 2,4 1,1 2,0 0,6 0,3 0,2 2,0 0,2 0,8 1,4<br />
Copadichromis quadrimaculatus 0,2 - 6,5 0,1 0,0 0,1 0,4 1,6 0,3 1,0<br />
Copadichromis virginalis - 1,2 - - 0,2 0,2 2,3 - - - 0,4<br />
Ctenopharynx nitidus - - 0,8 0,1 0,3 0,0 0,1 0,1 0,2 0,4 0,2<br />
Lethrinops altus - - - 0,4 0,4 0,0 0,1 - - - 0,1<br />
Lethrinops furcifer - - 5,9 0,2 0,1 0,5 0,1 - - - 0,7<br />
Lethrinops argenteus 16,2 3,5 3,5 24,3 32,5 21,3 10,5 7,5 7,0 5,8 13,2<br />
Lethrinops macrochir - 0,2 - 0,1 0,4 1,3 10,3 - 0,0 - 1,2<br />
Mylochromis anaphyrmus 3,4 1,3 5,9 6,8 0,5 2,3 2,4 5,1 3,7 7,4 3,9<br />
Mylochromis melanonotus - 0,6 0,5 - 0,5 - - - - 0,3 0,2<br />
Mylochromis spilostichus 2,4 0,1 - 0,1 - - 0,2 0,6 0,2 0,8 0,4<br />
Nyassachromis argyrosoma - - 38,4 32,5 20,2 5,7 11,9 53,6 38,5 30,5 23,1<br />
Oreochromis spp. 17,7 56,6 0,3 - 12,3 31,9 16,9 - 5,4 6,3 14,7<br />
Otopharynx cf productus 0,4 0,2 1,7 0,1 - 0,1 1,0 1,2 0,1 1,8 0,7<br />
Otopharynx decorus - 1,8 0,4 0,2 0,2 - 0,1 - 0,1 - 0,3<br />
Placidochromis suboccularis - - - 0,1 0,0 - 0,0 0,1 - 0,1 0,0<br />
Pseudotropheus livingstoni - - 2,4 0,6 0,0 - 0,0 2,7 2,0 5,9 1,4<br />
Synodontis njassae 0,9 1,0 - 15,8 0,7 0,6 0,1 0,5 0,2 0,3 2,0<br />
Taeniolethrinops furcicauda 0,6 0,2 2,0 0,2 0,1 - 0,9 1,3 3,2 7,5 1,6<br />
Taeniolethrinops praeorbitalis - 2,6 0,2 - - 1,5 1,4 - - - 0,6<br />
Trematocranus placodon 2,4 2,1 - 0,1 0,5 0,3 1,4 - - - 0,7<br />
Total 67,5 77,9 98,1 95,1 96,9 92,7 94,8 97,2 82,0 88,0 89,1<br />
Table C2. Proportion in weight <strong>of</strong> the main demersal species trawled at 30m depth in the SWA (cat<strong>fish</strong>es species in italic).<br />
Species name Jul-98 Aug-98 Oct-98 Nov-98 Dec-98 Jan-99 Feb-99 Mar-99 Apr-99 May-99 Mean<br />
Aulonocara blue orange - 19,0 - 3,4 0,2 4,4 3,1 - 0,1 10,0 4,0<br />
Aulonocara macrochir - - 0,1 0,1 0,3 0,2 - 0,1 - 0,0 0,1<br />
Bagrus meridionalis 5,3 5,5 5,8 8,1 4,2 22,6 14,2 6,1 7,1 1,4 8,0<br />
Bathyclarias spp. 12,4 5,5 5,8 4,3 8,3 7,7 17,6 - 4,0 2,6 6,8<br />
Buccochromis lepturus 2,0 1,0 - - - - 0,0 1,0 - 1,4 0,5<br />
Buccochromis nototaenia 3,3 2,6 1,8 1,7 0,8 2,4 0,0 1,7 1,3 1,6 1,7<br />
Chilotilapia rhoadesi 10,7 0,4 1,0 0,4 - 0,3 0,2 0,2 0,1 0,7 1,4<br />
Copadichromis quadrimaculatus 3,7 11,8 0,5 0,8 - 2,6 0,1 0,1 0,3 - 2,0<br />
Copadichromis virginalis 1,2 21,2 0,4 1,9 67,7 1,6 2,3 - - 0,0 9,6<br />
Lethrinops altus - - 0,2 2,7 0,5 1,9 0,1 17,7 1,7 0,3 2,5<br />
Lethrinops longimanus 0,4 - - 1,2 - 0,2 - 0,2 - - 0,2<br />
Lethrinops argenteus 28,5 15,8 13,3 21,7 6,5 17,0 10,5 17,6 26,8 27,2 18,5<br />
Lethrinops matumba - - 0,4 1,0 0,2 1,6 - 2,9 0,1 0,5 0,7<br />
Mylochromis anaphyrmus 20,6 3,0 5,1 11,2 1,9 6,7 2,4 4,5 6,3 4,2 6,6<br />
Mylochromis spilostichus - 0,8 - 0,5 - - 0,2 0,5 0,5 1,2 0,4<br />
Nyassachromis argyrosoma - - 37,9 15,2 3,1 23,2 11,9 34,3 44,1 34,8 20,5<br />
Oreochromis spp. - 7,2 - - - 0,3 16,9 - - 0,7 2,5<br />
Otopharynx argyrosoma 1,6 1,3 - 0,2 3,6 4,4 - 1,8 - - 1,3<br />
Otopharynx speciosus 0,2 - - 0,0 0,2 0,3 - 0,2 1,4 1,2 0,3<br />
Placidochromis long - - - 1,5 - 0,1 - 0,6 - 0,7 0,3<br />
Rhamphochromis spp. 2,5 1,3 0,5 11,8 0,7 0,1 0,2 2,8 2,5 1,7 2,4<br />
Synodontis njassae 0,5 0,3 23,3 9,4 1,4 0,7 0,1 3,1 3,4 3,1 4,5<br />
Taeniolethrinops laticeps 0,1 0,2 - - 0,2 0,3 - - - 0,5 0,1<br />
Taeniolethrinops praeorbitalis 0,8 0,4 0,2 0,1 - 0,5 1,4 - 0,1 0,1 0,4<br />
Total 93,7 97,3 96,4 97,2 99,7 99,0 81,1 95,3 99,5 94,0 95,3
Proportions <strong>of</strong> cichlids and cat<strong>fish</strong>es<br />
<strong>The</strong> proportion <strong>of</strong> cichlids and cat<strong>fish</strong>es (Bagrus meridionalis, Bathyclarias spp. and<br />
Synodontis njassae) in the catches at each month are presented in the Figures C6a and C6b, in<br />
number and weight respectively. <strong>The</strong> cat<strong>fish</strong>es constituted regularly between 2 and 9% <strong>of</strong> the<br />
catches in number from July to December 1998 and less than 0.5% between January and May<br />
1999 (Figure C6a). On the other hand, cat<strong>fish</strong>es represented consistently 8 to 25% <strong>of</strong> the<br />
catches in weight during the whole sampling period (Figure C6b).<br />
100<br />
100<br />
% <strong>of</strong> catches in number<br />
90<br />
80<br />
70<br />
60<br />
Cat<strong>fish</strong><br />
<strong>Cichlid</strong>s<br />
% <strong>of</strong> catches in weight<br />
90<br />
80<br />
70<br />
60<br />
Cat<strong>fish</strong><br />
<strong>Cichlid</strong>s<br />
a<br />
50<br />
Jul Aug Oct Nov Dec Jan Feb Mar Apr May<br />
1998 1999<br />
b<br />
50<br />
Jul Aug Oct Nov Dec Jan Feb Mar Apr May<br />
1998 1999<br />
Figure C6. Proportions <strong>of</strong> cichlids and cat<strong>fish</strong>es in the catches over the sampling period (July-98 to<br />
May-99), in number (a) and weight (b).<br />
<strong>The</strong> proportion <strong>of</strong> cat<strong>fish</strong>es per depth varied from 2% at 75 and 100 m to 5% at 125 m,<br />
in number (Figure C7a) and from 15.3% at 10 m to 22% at 100 m, in weight (Figure C7b).<br />
<strong>The</strong> proportion in weight <strong>of</strong> cat<strong>fish</strong>es was not significantly different among depth (F=0.445,<br />
p=0.815).<br />
Overall mean % <strong>of</strong> catches<br />
(number)<br />
50 60 70 80 90 100<br />
Overall mean % <strong>of</strong> catches<br />
(weight)<br />
50 60 70 80 90 100<br />
10<br />
10<br />
Depth (m)<br />
30<br />
50<br />
<strong>Cichlid</strong>s<br />
Cat<strong>fish</strong><br />
Depth (m)<br />
30<br />
50<br />
<strong>Cichlid</strong>s<br />
Cat<strong>fish</strong><br />
75<br />
75<br />
100<br />
100<br />
125<br />
125<br />
a b<br />
Figure C7. Proportions <strong>of</strong> cichlids and cat<strong>fish</strong>es in the catches per depth all months pooled, in<br />
number (a) and weight (b).<br />
10
Table C3. Proportion in weight <strong>of</strong> the main demersal species trawled at 50m depth in the SWA (cat<strong>fish</strong>es species in italic).<br />
Species name Jul-98 Aug-98 Oct-98 Nov-98 Dec-98 Jan-99 Feb-99 Mar-99 Apr-99 May-99 Mean<br />
Alticorpus mentale 0,3 - - - 0,8 0,9 0,5 0,7 0,7 0,1 0,4<br />
Aulonocara blue orange - 0,2 - - - 0,5 0,6 - - 0,0 0,1<br />
Aulonocara macrochir 0,1 0,4 1,1 1,0 1,7 1,3 0,1 1,2 2,6 0,2 1,0<br />
Bagrus meridionalis 6,7 1,3 3,7 11,5 7,0 13,8 19,2 14,6 5,5 4,9 8,8<br />
Bathyclarias spp. 11,9 41,4 4,4 8,5 - 3,1 10,9 1,9 0,0 4,2 8,6<br />
Copadichromis quadrimaculatus - 0,8 1,4 0,4 - 0,2 0,2 0,3 0,1 - 0,3<br />
Copadichromis virginalis 50,4 1,0 1,8 47,7 53,8 27,9 33,1 10,5 22,2 44,2 29,2<br />
Diplotaxodon argenteus 0,2 - 0,9 - - 0,5 - 1,8 0,5 1,7 0,6<br />
Diplotaxodon limnothrissa 1,3 0,1 0,5 - 0,3 5,1 0,1 28,1 2,1 0,9 3,8<br />
Docimodus johnstoni 0,1 0,2 - - - 0,1 - - - 0,3 0,1<br />
Hemitaeniochromis insignis - - 0,1 - - - - 0,1 0,0 0,0 0,0<br />
Lethrinops altus 0,3 0,8 0,7 0,5 0,5 1,9 0,6 0,6 2,3 - 0,8<br />
Lethrinops longimanus 1,1 4,5 0,0 3,0 0,4 0,4 6,7 0,4 0,4 0,1 1,7<br />
Lethrinops argenteus 13,7 17,5 32,0 15,7 23,0 10,2 9,7 19,9 38,4 9,4 18,9<br />
Lethrinops minutus - 1,1 6,3 - - 4,3 0,9 1,1 0,5 4,3 1,8<br />
Lethrinops parvidens - - - - 0,0 - 0,1 0,1 0,2 - 0,0<br />
Mylochromis anaphyrmus 0,8 1,4 1,7 0,3 0,7 0,5 0,6 0,5 0,8 0,4 0,8<br />
Mylochromis spilostichus - 7,3 - - - - 0,6 0,1 0,4 0,9 0,9<br />
Otopharynx speciosus 0,3 1,3 0,2 0,2 0,5 0,6 1,1 0,7 0,1 0,5 0,5<br />
Placidochromis long - - 2,6 1,5 3,9 1,3 0,6 0,2 0,1 5,3 1,6<br />
Rhamphochromis spp. 2,9 2,8 20,0 0,8 3,7 2,5 2,1 1,8 0,9 15,0 5,3<br />
Sciaenochromis benthicola 0,7 0,5 0,8 0,3 0,0 3,4 5,1 0,6 0,9 0,6 1,3<br />
Synodontis njassae 6,7 3,5 1,3 3,2 3,6 4,3 2,5 3,7 3,5 3,6 3,6<br />
Trematocranus brevirostris - - 16,7 1,6 0,0 2,3 3,5 10,1 14,5 1,4 5,0<br />
Total 97,5 86,1 96,3 95,9 99,9 85,2 98,8 99,0 96,7 98,1 95,4<br />
Table C4. Proportion in weight <strong>of</strong> the main demersal species trawled at 75m depth in the SWA (cat<strong>fish</strong>es species in italic).<br />
Species name Jul-98 Aug-98 Oct-98 Nov-98 Dec-98 Jan-99 Feb-99 Mar-99 Apr-99 May-99 Mean<br />
Alticorpus spp. 0,6 - - - 2,2 2,1 0,3 - - - 0,5<br />
Alticorpus ge<strong>of</strong>freyi 20,1 20,4 9,0 4,7 8,0 1,1 2,2 4,2 6,3 12,2 8,8<br />
Alticorpus macrocleithrum 1,1 1,3 0,1 - - - - - - 0,1 0,3<br />
Alticorpus mentale 3,5 4,4 4,8 11,6 18,7 2,0 16,1 4,5 3,5 4,2 7,3<br />
Alticorpus pectinatum 0,8 0,3 0,6 0,1 1,5 1,2 5,0 3,8 1,8 2,2 1,7<br />
Aulonocara minutus 0,7 0,9 0,5 - 0,9 0,2 0,3 1,4 0,3 1,8 0,7<br />
Aulonocara rostratum - - 2,0 - - 0,1 0,2 1,9 0,8 0,9 0,6<br />
Bagrus meridionalis 9,3 8,8 8,6 3,1 3,3 6,5 11,0 2,4 5,3 1,6 6,0<br />
Bathyclarias spp. 17,6 8,8 24,9 6,1 0,7 15,0 11,7 4,0 2,1 9,7 10,1<br />
Diplotaxodon apogon - 1,9 0,3 - 8,4 9,2 5,6 2,2 1,9 0,5 3,0<br />
Diplotaxodon argenteus 1,0 0,8 1,9 1,8 3,0 5,6 3,6 3,7 3,5 1,7 2,6<br />
Diplotaxodon macrops 2,3 3,6 - - 0,5 13,6 4,7 9,1 3,9 2,3 4,0<br />
Diplotaxodon limnothrissa 3,7 2,9 12,9 2,0 0,7 1,5 8,4 4,1 19,4 21,3 7,7<br />
Lethrinops deep water albus 0,2 1,2 0,1 31,3 0,1 - - - - - 3,3<br />
Lethrinops gossei 16,2 14,4 9,2 1,9 16,1 17,1 17,3 29,5 41,4 17,3 18,0<br />
Lethrinops oliveri 2,7 19,4 7,2 9,8 12,9 13,5 5,3 13,7 3,2 8,9 9,7<br />
Lethrinops polli 5,4 5,8 2,3 0,5 1,4 1,2 2,1 4,2 0,5 6,8 3,0<br />
Pallidochromis tokolosh 1,3 1,3 0,4 - 1,3 1,7 1,0 0,2 0,1 0,7 0,8<br />
Rhamphochromis spp. 0,7 0,9 8,6 7,6 2,2 1,4 0,0 0,9 0,2 0,8 2,3<br />
Sciaenochromis alhi - - 0,2 0,0 0,2 0,1 0,2 - - 0,9 0,2<br />
Sciaenochromis benthicola 0,1 0,1 - 2,0 7,1 0,3 - 0,3 0,0 0,2 1,0<br />
Synodontis njassae 8,9 0,3 0,6 0,8 1,7 2,0 2,3 6,3 3,7 1,8 2,8<br />
Total 96,0 97,5 94,2 83,4 91,0 95,4 97,4 96,4 98,0 95,9 94,5
Catch composition<br />
<strong>Fishes</strong> representing the major part <strong>of</strong> the catches at each month are presented in Tables<br />
C1 to C6 for the depths <strong>of</strong> 10m, 30m, 50m, 75m, 100m and 125m respectively. Although<br />
cyprinids and mormyrids were sometimes caught, their occurrence was so rare and their<br />
contribution to the catches so weak that they were negligible. <strong>The</strong>refore, catches were<br />
assumed to be constituted only <strong>of</strong> cichlids and cat<strong>fish</strong>es.<br />
<strong>The</strong> cat<strong>fish</strong> species (Bathyclarias spp., Bagrus meridionalis and Synodontis njassae) were<br />
consistently amongst the most important species (in weight) at each depth, averaging 15.3%<br />
at 10m, 19.3% at 30m, 21% at 50m, 18.9% at 75m, 21.6% at 100m and 17.6% at 125m.<br />
Owing to their large sizes, the Bathyclarias spp. and the Bagrus meridionalis were much less<br />
important in number as illustrated in Figures C8a and C8b respectively.<br />
Overall mean catches (%)<br />
0 5 10 15<br />
Overall mean catches (%)<br />
0 2 4 6 8 10<br />
10<br />
30<br />
Weight<br />
Number<br />
10<br />
30<br />
Depth (m)<br />
50<br />
75<br />
Depth (m)<br />
50<br />
75<br />
100<br />
125<br />
100<br />
125<br />
Weight<br />
Number<br />
a<br />
Figure C8. Overall mean catches (in proportion <strong>of</strong> weight and number) per depth<br />
for Bathyclarias spp. (a) and Bagrus meridionalis (b) from July 98 to May 99.<br />
B. meridionalis was proportionally more abundant in the shallow waters (10 to 50m) while<br />
Bathyclarias spp. was better represented in the deep waters (75 to 125m).<br />
b<br />
Overall mean catches (%)<br />
0 5 10 15<br />
Depth (m)<br />
10<br />
30<br />
50<br />
75<br />
Weight<br />
Number<br />
100<br />
125<br />
Figure C9. Overall mean catches (in proportion <strong>of</strong> weight and number) per depth for<br />
Synodontis njassae from July 98 to May 99.<br />
11
Table C5. Proportion in weight <strong>of</strong> the main demersal species trawled at 100m depth in the SWA (cat<strong>fish</strong>es species in italic).<br />
Species name Jul-98 Aug-98 Oct-98 Nov-98 Dec-98 Jan-99 Feb-99 Mar-99 Apr-99 May-99 Mean<br />
Alticorpus ge<strong>of</strong>freyi 2,6 2,4 2,1 3,4 1,8 1,4 3,4 0,9 2,1 1,0 2,1<br />
Alticorpus macrocleithrum 3,9 2,8 - 1,2 1,6 1,0 0,9 0,5 0,1 0,2 1,2<br />
Alticorpus mentale 21,7 15,0 1,9 9,6 4,1 8,4 21,1 6,7 25,1 6,9 12,1<br />
Alticorpus pectinatum 2,6 0,2 0,4 5,7 1,2 0,6 2,6 0,6 1,1 1,1 1,6<br />
Aulonocara long - 0,1 - - 0,1 - 0,0 0,0 0,0 0,1 0,0<br />
Aulonocara minutus 0,8 1,0 0,2 0,8 0,2 0,0 0,8 0,1 0,4 0,2 0,5<br />
Aulonocara rostratum - - - - - - 0,4 0,2 0,0 0,0 0,1<br />
Bagrus meridionalis 2,8 6,6 0,1 2,4 0,5 0,6 0,6 10,3 0,7 0,3 2,5<br />
Bathyclarias spp. 6,9 9,4 - 15,0 10,1 5,5 25,6 20,0 10,1 10,0 11,3<br />
Diplotaxodon apogon - 2,2 3,1 17,7 4,3 1,8 0,1 0,7 0,3 0,9 3,1<br />
Diplotaxodon argenteus 0,7 - 14,9 5,0 3,7 0,7 0,0 0,9 1,0 1,2 2,8<br />
Diplotaxodon macrops 0,3 6,9 2,4 2,5 25,0 21,5 1,2 18,3 5,8 20,2 10,4<br />
Diplotaxodon limnothrissa 0,1 - 52,8 3,6 5,9 2,6 1,5 1,1 0,8 28,5 9,7<br />
Lethrinops deep water altus 5,9 5,8 1,4 6,1 - 1,2 0,3 0,1 6,2 2,9 3,0<br />
Lethrinops gossei 34,4 21,7 2,4 9,6 21,5 28,2 23,4 20,1 35,2 20,6 21,7<br />
Lethrinops oliveri 4,9 17,4 2,8 4,4 4,6 3,5 0,3 0,4 - 1,8 4,0<br />
Lethrinops polli 0,1 0,9 0,2 3,2 - 1,2 0,2 0,2 0,5 0,1 0,7<br />
Pallidochromis tokolosh 0,1 - 0,1 0,6 0,1 0,0 - 0,0 1,4 0,4 0,3<br />
Placidochromis "flatjaws" 0,4 - - - 5,7 0,1 0,1 0,0 0,5 - 0,7<br />
Placidochromis platyrhynchos 1,8 1,2 0,1 - 1,3 0,3 0,2 0,0 0,3 0,1 0,5<br />
Synodontis njassae 5,4 0,5 1,9 3,2 1,7 20,9 13,0 18,3 7,2 3,3 7,6<br />
Total 95,4 94,3 86,7 94,0 93,6 99,5 95,8 99,5 99,0 99,8 95,8<br />
Table C6. Proportion in weight <strong>of</strong> the main demersal species trawled at 125m depth in the SWA (cat<strong>fish</strong>es species in italic).<br />
Species name Jul-98 Aug-98 Oct-98 Nov-98 Dec-98 Jan-99 Feb-99 Mar-99 Apr-99 May-99 Mean<br />
Alticorpus spp. 0,1 - - - 0,9 1,9 1,8 2,5 0,5 1,6 0,9<br />
Alticorpus ge<strong>of</strong>freyi 1,6 1,0 2,2 3,8 18,7 3,1 5,0 3,8 2,9 2,0 4,4<br />
Alticorpus macrocleithrum - 0,1 - 0,2 2,1 0,2 0,1 - - - 0,3<br />
Alticorpus mentale 19,6 15,8 15,8 2,1 15,1 3,7 5,4 9,3 5,0 7,1 9,9<br />
Alticorpus pectinatum 0,1 - 0,3 4,5 4,7 - 0,2 0,9 1,8 - 1,3<br />
Aulonocara long - - 0,6 - - 0,0 0,1 0,3 0,1 0,3 0,1<br />
Aulonocara minutus - 0,2 1,4 1,4 1,9 1,1 0,6 8,2 1,0 0,7 1,7<br />
Aulonocara rostratum - - 0,5 - - 0,1 0,5 0,4 - 0,7 0,2<br />
Bagrus meridionalis 2,4 6,3 2,4 1,1 0,3 7,0 2,0 1,0 0,2 2,6 2,5<br />
Bathyclarias spp. 15,1 6,3 2,4 2,7 13,5 7,3 8,5 3,6 2,7 4,0 6,6<br />
Diplotaxodon apogon - 12,5 3,1 4,0 1,8 1,7 1,2 1,6 5,4 1,9 3,3<br />
Diplotaxodon argenteus 0,2 0,2 3,8 1,0 1,2 1,5 1,8 0,2 3,1 2,6 1,6<br />
Diplotaxodon macrops 0,7 7,5 7,8 10,9 - 15,2 17,2 6,2 24,3 27,6 11,8<br />
Diplotaxodon brevimaxillaris - - 0,5 0,5 0,3 0,5 0,3 - - 1,4 0,3<br />
Diplotaxodon limnothrissa 0,1 0,2 0,7 1,0 0,1 0,9 0,6 0,8 3,3 9,4 1,7<br />
Hemitaeniochromis insignis - - 0,2 - - 0,3 - 0,1 0,1 0,1 0,1<br />
Lethrinops deep water albus 5,1 0,3 4,1 0,2 0,1 0,8 - - - 0,1 1,1<br />
Lethrinops deep water altus 9,1 6,6 6,5 4,4 2,1 2,6 6,0 4,2 6,0 5,4 5,3<br />
Lethrinops gossei 15,4 21,4 10,5 33,4 12,0 37,2 31,2 31,4 33,8 20,1 24,6<br />
Lethrinops oliveri 3,5 3,6 2,7 2,8 5,1 1,7 0,8 8,6 - 0,7 3,0<br />
Lethrinops polli 0,2 - 0,1 0,7 0,2 - 0,2 - - - 0,1<br />
Pallidochromis tokolosh 1,0 3,0 3,5 0,3 1,3 2,9 2,8 0,4 1,4 2,6 1,9<br />
Placidochromis "flatjaws" - - - - 0,3 0,0 0,5 3,3 0,3 - 0,4<br />
Placidochromis platyrhynchos 1,9 10,6 4,9 0,6 1,4 2,0 3,3 6,5 1,8 2,1 3,5<br />
Synodontis njassae 12,8 1,0 16,4 20,2 3,1 6,0 8,5 6,0 5,9 5,1 8,5<br />
Total 88,9 96,7 90,5 95,8 85,9 97,8 98,5 99,2 99,5 98,0 95,1
<strong>The</strong> smaller S. njassae was more evenly represented in number and weight and appeared more<br />
abundant in the very deep zone (100-125m, Figure C9).<br />
A minimum <strong>of</strong> 145 (see Appendix 2) to at least 170 different species were caught<br />
during the sampling year from June 1998 to May 1999 (taking into account the several<br />
species lumped together under their generic names, such as the Aulonocara spp., the<br />
Bathyclarias spp., the Copadichromis spp., the Lethrinops spp., the Mylochromis spp., the<br />
Nyassachromis spp., the Oreochromis spp., the Otopharynx spp., the Placidochromis spp., the<br />
Rhamphochromis spp., the Sciaenochromis spp.). However, despite this high number <strong>of</strong><br />
sampled species, relatively few cichlid species accounted for more than 50% <strong>of</strong> the catches in<br />
weight at all depths, respectively 51% at 10m (Lethrinops argenteus, Nyassachromis<br />
argyrosoma and Oreochromis spp. Table C1), 55.2% at 30m (Copadichromis virginalis, L.<br />
argenteus Mylochromis anaphyrmus and N. argyrosoma Table C2), 56.9% at 50m (C.<br />
virginalis, Diplotaxodon limnothrissa, L. argenteus, and Trematocranus brevirostris Table<br />
C3), 55.5% at 75m (Alticorpus ge<strong>of</strong>freyi, Alticorpus mentale, Diplotaxodon macrops, D.<br />
limnothrissa, Lethrinops gossei and Lethrinops oliveri Table C4), 53.9% at 100m (A. mentale,<br />
D. macrops, D. limnothrissa, L. gossei Table C5) and 51.6% at 125m (A. mentale, D.<br />
macrops, Lethrinops "deep water altus" and L. gossei Table C6). Some <strong>of</strong> these species were<br />
dominant over two to three depths, such as L. argenteus, C. virginalis and N. argyrosoma in<br />
the shallows (10 to 50m), A. mentale, D. macrops, D. limnothrissa and L. gossei in the deeper<br />
waters (75 to 125m).<br />
Added to the proportion <strong>of</strong> cat<strong>fish</strong>es at each depths, about 10 <strong>fish</strong> species only accounted for<br />
70 to 80% <strong>of</strong> the catches in weight over the sampling period.<br />
A clear change in species composition appeared after 50 m, the "shallow" water species being<br />
encountered down to 50m whereas the characteristic "deep" water species appeared from 75<br />
m downwards (Tables C1 to C6).<br />
<strong>The</strong> results <strong>of</strong> catch per unit effort (kg / 20 min pull) for each species according to<br />
depth are summarised in Appendix 3. <strong>The</strong> total number <strong>of</strong> species caught over the sampling<br />
period decreased with increasing depth from 80 species at 10 m to 48 at 125 m (Appendix 3).<br />
Again, these values are underestimated owing to the several species lumped together under<br />
their generic names. Unlike the three cat<strong>fish</strong> species, which were consistently caught at any<br />
depth, very few cichlid species had depth distribution covering all the sampled depths<br />
(Appendix 3). Only 12 out <strong>of</strong> the 133 cichlid species or species groups listed in Appendix 3<br />
covered all (or at least 5 <strong>of</strong>) the sampled depths. Most <strong>of</strong> the others were restricted to three or<br />
four depths and some species were confined to one or two depths only.<br />
Discussion<br />
During the whole sampling period (June 1998 to May 1999), no other trawlers were<br />
encountered in the sampled area, roughly from Chipoka to Lukoloma (Figure C1). <strong>The</strong><br />
trawlers in activity in the SWA occur in the southern part <strong>of</strong> the arm and only the Ndunduma<br />
can occasionally trawl in the north <strong>of</strong> the SWA (A. Bulirani, pers. com.). <strong>The</strong>refore, it can be<br />
considered that our sampled area is almost not commercially exploited by trawlers. We<br />
recorded the highest catches at 75 and 100 m, and the catches were higher at 125 m than at 10<br />
and 30 m, whereas the CPUE is supposed to be higher in the shallow zone (Turner 1977a,<br />
Tómasson & Banda 1996). This is likely to be a consequence <strong>of</strong> the light exploitation <strong>of</strong> the<br />
deep zone by commercial <strong>fish</strong>eries whereas the shallow zone is heavily exploited by artisanal<br />
<strong>fish</strong>ermen in the studied area.<br />
Temporal fluctuations <strong>of</strong> the total catches per month (all depths pooled) were<br />
observed. But the same temporal patterns were also observed at each depth and when depths<br />
were pooled per category, suggesting that the representativeness <strong>of</strong> our sampling was good,<br />
despite a potential inter-haul variability. Tweddle & Magasa (1989) also <strong>report</strong>ed seasonal<br />
12
Temperature (°C)<br />
23 24 25 26 27 28 29<br />
0<br />
-10<br />
-20<br />
-30<br />
-40<br />
-50<br />
Depth (m)<br />
-60<br />
-70<br />
-80<br />
-90<br />
-100<br />
-110<br />
-120<br />
-130<br />
Jun-98<br />
Jul-98<br />
Aug-98<br />
Oct-98<br />
Nov-98<br />
Dec-98<br />
Jan-99<br />
March-99<br />
May-99<br />
Figure C10. Seasonal progression <strong>of</strong> temperature pr<strong>of</strong>ile according to depth <strong>of</strong>f Cap Maclear,<br />
SWA.<br />
Depth range (m)<br />
-125<br />
-100<br />
-75<br />
-50<br />
-30<br />
-10<br />
0 5 10 15<br />
Mean bottom type index per depth range<br />
Figure C11. Modification <strong>of</strong> bottom type with depth in the SWA. Each bottom type category<br />
was given an arbitrary value for graphic representation: 15 for "very coarse sand", 10 for<br />
"medium sand", 5 for "very fine sand" and 0 for "mud". <strong>The</strong> values are the means over five<br />
months (June to December 1998).
trends in the catch rates in the SEA with usually a peak in August and September, which is<br />
supported by our results.<br />
<strong>The</strong> catches were dominated by cichlids both in number and weight. However, the<br />
cat<strong>fish</strong>es, represented by only 3 genera (Bathyclarias, Bagrus and Synodontis) <strong>of</strong> which two<br />
have a single species (Bagrus meridionalis and Synodontis njassae), consistently constituted a<br />
significant part <strong>of</strong> the catches. Owing to their large size (for Bathyclarias spp. and Bagrus<br />
meridionalis at least), their contribution to the catches was much more important when<br />
referred to their biomass than to their number. <strong>The</strong>y consistently represented between 10 and<br />
25% <strong>of</strong> the catches. Tómasson & Banda (1996) found that in the SWA B. meridionalis was<br />
more abundant in the deep waters (50 to 100 m) but bigger in the shallows (0 to 50 m).<br />
During our sampling period and in the sampled area, which was restricted to the north <strong>of</strong> the<br />
SWA, B. meridionalis was more abundant between 10 and 50 m, as observed by Turner<br />
(1977), and large specimens were evenly distributed according to depth. Bathyclarias spp.<br />
tended to be better represented in the deep waters from 50 m downwards whereas their<br />
maximum catch was observed at 40-60 m by Turner (1977). As pointed out by Tómasson &<br />
Banda (1996), Synodontis njassae was common at all depths and displayed an increasing<br />
occurrence and abundance with depth, becoming much more abundant in the very deep zone<br />
(100 and 125 m). Although specimens from 50 to 200 mm (standard length) were recorded,<br />
most individuals caught were <strong>of</strong> uniform size, between 90 and 110 mm SL, which<br />
corresponded to previous observations <strong>of</strong> 12 to 14 cm TL (Tómasson & Banda 1996).<br />
When adjusted to a 30 min pull and per depth category, the CPUE per species<br />
(Appendix 3) were not always consistent with those <strong>report</strong>ed by Tómasson & Banda (1996).<br />
Details will be given in Chapter 2.<br />
A marked change in species composition was <strong>report</strong>ed to occur around 50 m in the<br />
SWA (Tómasson & Banda 1996). It was hypothesised to be related to the position <strong>of</strong> the<br />
thermocline or the substrate type. This spectacular shift in species composition between 50<br />
and 75 m was also observed in our study. However, the position <strong>of</strong> the thermocline does not<br />
seem to be the best explanation to that pattern for it fluctuates significantly with season<br />
(Figure C10), whereas the species distribution pattern is stable (Tables C1 to C6). As most <strong>of</strong><br />
the exploited species are demersal <strong>fish</strong> and therefore closely related to the bottom, the<br />
sediment quality might constitute a better explanation. <strong>The</strong> grab sample analyses revealed a<br />
gradient in bottom type composition from the shallows to the deep waters. <strong>The</strong> bottom types<br />
can roughly be categorised as "very coarse sand", "medium sand", "very fine sand" and<br />
"mud". Each <strong>of</strong> these categories were attributed arbitrary values, respectively 15, 10, 5 and 0<br />
for the sake <strong>of</strong> graphic representation. <strong>The</strong> results <strong>of</strong> grab sample analyses over several<br />
months are summarised in Figure C11. A clear change in bottom composition from coarse<br />
and medium sand to very fine sand and mud appears after 50m and is likely to influence the<br />
species composition pattern according to depth.<br />
A notable observation was that throughout the year, the bulk <strong>of</strong> the catches was<br />
constituted by a few common cichlid and cat<strong>fish</strong> species. At any given depth, despite the large<br />
number <strong>of</strong> species regularly recorded, 60 to 80% <strong>of</strong> the catches was made <strong>of</strong> no more than ten<br />
species including the three cat<strong>fish</strong>es. And about twenty species only accounted for 90 to 95%<br />
<strong>of</strong> the catches at each depth, with some species being dominant in two or three <strong>of</strong> the sampled<br />
depths. This indicates that the largest part <strong>of</strong> the species caught is relatively rare or at least<br />
infrequent. For the rarer ones, the occurrence in the catches might be incidental to unusual<br />
movements out <strong>of</strong> their habitat, which would expose them to the trawl. Another potential<br />
explanation might be that we did sample only a restricted amount <strong>of</strong> different habitats, though<br />
this hypothesis is very unlikely given the surface covered by a 20 min pull. Hence, for the<br />
majority <strong>of</strong> the infrequent species it probably means that they do exist in small population<br />
number and/or have patchy distributions either because <strong>of</strong> their high specialisation to specific<br />
type <strong>of</strong> habitats or because <strong>of</strong> the narrowness <strong>of</strong> their trophic niche. In any case, these species<br />
are likely to be the first endangered by intensive exploitation.<br />
13
<strong>The</strong> decreasing number <strong>of</strong> species caught with increasing depth <strong>report</strong>ed by previous<br />
authors (Turner 1977a, Tómasson & Banda 1996) was also observed in our study (Appendix<br />
3). <strong>The</strong> generally accepted statement that demersal cichlids usually have restricted depth<br />
distributions (Eccles & Trewavas 1989, Banda & Tómasson 1996, Tómasson & Banda 1996,<br />
Turner 1996) was also supported by our results. Another well-known trend is the decreasing<br />
occurrence <strong>of</strong> large cichlid species with depth (Turner 1977a). We observed that even though<br />
there was a higher number <strong>of</strong> large species in the shallows (Buccochromis spp.,<br />
Taeniolethrinops spp., Serranochromis robustus…), their occurrence was weak, except for<br />
the Oreochromis spp., and catches were dominated by small species such as Aulonocara spp.,<br />
Nyassachromis spp. or Copadichromis virginalis and a few larger species such as Lethrinops<br />
argenteus and Mylochromis anaphyrmus (Tables C1 and C2). On the other hand, the<br />
dominant species <strong>of</strong> the deep zone were rather large <strong>fish</strong> such as Lethrinops gossei, the<br />
Alticorpus spp. and mentale particularly, the Diplotaxodon spp. (Tables C4 to C6). <strong>The</strong><br />
decreased occurrence <strong>of</strong> large and medium species in the catches <strong>report</strong>ed by Turner (1977b)<br />
and Turner et al. (1995) probably also affected the shallow waters <strong>of</strong> the SWA. However, an<br />
interesting proportion <strong>of</strong> large species remains in the almost unexploited deep zone. Given<br />
that over the year the highest catches were recorded from 50 m downwards, where the<br />
dominant species are relatively large, any expansion <strong>of</strong> trawl <strong>fish</strong>eries in the southern part <strong>of</strong><br />
the <strong>Lake</strong> should take place in the deep zone shared by the SE and SW arms. This supports the<br />
position <strong>of</strong> Banda et al. (1996) against FAO's (1993) recommendation that no expansion <strong>of</strong><br />
the trawl <strong>fish</strong>ery should take place in the deeper zone <strong>of</strong> the SEA.<br />
14
Chapter 2:<br />
Depth distribution and breeding<br />
patterns <strong>of</strong> the demersal species most<br />
commonly caught by trawling in the<br />
South West Arm <strong>of</strong> <strong>Lake</strong> <strong>Malawi</strong>
Chapter 2: Depth distribution and breeding patterns <strong>of</strong> the<br />
demersal species most commonly caught by trawling in the South<br />
West Arm <strong>of</strong> <strong>Lake</strong> <strong>Malawi</strong><br />
F. Duponchelle, A.J. Ribbink, A. Msukwa, J. Mafuka & D. Mandere<br />
Introduction<br />
Given the tremendous diversity <strong>of</strong> <strong>Malawi</strong> cichlids, very few studies have been carried<br />
out on their breeding biology so far. Earlier studies focused on some species in the north<br />
(Jackson et al. 1963) and central part <strong>of</strong> the lake (zooplanctivorous Utaka: Iles 1960, 1971). A<br />
comprehensive work highlighted the reproductive seasonality <strong>of</strong> ten rock frequenting species<br />
(Marsh et al. 1986). A recent survey <strong>of</strong> the pelagic zone provided information about the<br />
breeding <strong>of</strong> Copadichromis quadrimaculatus, Diplotaxodon limnothrissa and 'big eye' and<br />
Rhamphochromis longiceps (Thompson et al. 1996). Despite the fact they hold an<br />
economically important commercial <strong>fish</strong>ery, very few species apart from chambo (Lowe<br />
1953, McKaye & Stauffer 1988, Turner et al. 1991) have been studied in the south <strong>of</strong> the lake,<br />
where the commercial <strong>fish</strong>eries take place. Maturity and fecundity were estimated for<br />
Copadichromis ("Haplochromis") mloto, Lethrinops parvidens , L. longipinnis, Mylochromis<br />
("Haplochromis") anaphyrmus and Otopharynx ("Haplochromis") intermedius (Tweddle &<br />
Turner 1977), while breeding season and maturity were detailed for three Lethrinops species,<br />
microdon, 'species A' and gossei by Lewis & Tweddle (1990). McKaye (1983) <strong>report</strong>ed<br />
marked seasonal variations in nest numbers for Cyrtocara eucinostomus.<br />
Although the information is incomplete for some species, our study describes the breeding<br />
biology <strong>of</strong> about 40 <strong>of</strong> the most important trawled species in the SWA.<br />
It is important to remember that the sampling period was June 1998 to May 1999.<br />
However, all the information related to catches are based on the period from July 1998 to May<br />
1999 for the reasons explained in the previous chapter. Owing to inter species variability <strong>of</strong><br />
occurrence in the catches and therefore to sample size, the results presented in this chapter<br />
will be <strong>of</strong> irregular quality, the information being complete and reliable for some species and<br />
more indicative for the rarer ones. For the reader's convenience, information about the species<br />
is delivered per genera, which are ordered alphabetically. For each species, whenever<br />
possible, the following information is displayed: size range (SL), depth distribution,<br />
occurrence and abundance over the full sampling period, breeding season, age and size at<br />
maturity, fecundity and egg size.<br />
For the breeding season, priority will always be given to the females pattern. Most <strong>of</strong> the time<br />
in cichlids, males are sexually active for longer periods than females; a way to always be<br />
'ready' probably. As a consequence, determination <strong>of</strong> the breeding season is more accurate<br />
when based upon female data. However, when the sample sizes are not optimum for females,<br />
information about males may be useful. On the other hand, as most <strong>Malawi</strong> cichlids form<br />
breeding leks to attract females (Konings 1995, Turner 1996), priority will be given to ripe<br />
males distribution for estimation <strong>of</strong> spawning depth. <strong>The</strong> weight <strong>of</strong> individuals was not taken<br />
on board, but only in the lab on ripe females, except for the nine target species (Alticorpus<br />
macrocleithrum, Alticorpus mentale, Copadichromis virginalis, Diplotaxodon limnothrissa,<br />
Diplotaxodon macrops, Lethrinops argenteus, Lethrinops gossei, Mylochromis anaphyrmus<br />
and Taeniolethrinops praeorbitalis), for which all the females were weighed. Most <strong>of</strong> the<br />
15
length-weight relationships are then based on data for ripe females, which explain their low<br />
sample size sometimes.<br />
Material and methods<br />
All the <strong>fish</strong> analysed were collected during the monthly trawl catches in the north <strong>of</strong><br />
the South West Arm (see Chapter 1 for details).<br />
<strong>The</strong> comparisons <strong>of</strong> CPUE per depth for each species with those <strong>report</strong>ed in Tómasson<br />
& Banda (1996) are based on the values given in Appendix 3, but pooled per depth category<br />
(shallow zone = 0-50 m, deep zone = 51-100 m, very deep zone = >100 m) and <strong>report</strong>ed to 30<br />
min pulls (instead <strong>of</strong> 20 min in our case) to be comparable with Tómasson & Banda (1996)<br />
values.<br />
<strong>The</strong> maturity stage <strong>of</strong> female gonads was macroscopically determined using the<br />
slightly modified scale <strong>of</strong> Legendre & Ecoutin (1989) (Duponchelle 1997).<br />
Stage 1: immature. <strong>The</strong> gonad looks like two short transparent cylinders. No oocytes are<br />
visible to the naked eyes. As a comparison, immature testicle is much longer and thinner, like<br />
two long tinny silver filaments.<br />
Stage 2: beginning maturation. <strong>The</strong> ovaries are slightly larger and little whitish oocytes and<br />
apparent.<br />
Stage 3: maturing. <strong>The</strong> ovaries continue to grow in length and thickness and are full <strong>of</strong><br />
yellowish oocytes in early vitellogenesis.<br />
Stage 4: final maturation. <strong>The</strong> ovaries occupy a large part <strong>of</strong> the abdominal cavity and are full<br />
<strong>of</strong> large uniform sized oocytes in late vitellogenesis.<br />
Stage 5: ripe. Ovulation occurred, oocytes can be expelled by a gentle pressure on the<br />
abdomen. This stage is ephemera.<br />
Stage 6: spent. <strong>The</strong> ovaries look like large bloody empty bags with remaining large sized<br />
atretic follicles. Small whitish oocytes are visible.<br />
Stage 6-2: resting. <strong>The</strong> general aspect <strong>of</strong> the gonad recall a stage 2, but the ovarian wall is<br />
thicker, the gonad is larger, <strong>of</strong>ten reddish with an aspect <strong>of</strong> empty bag. This stage is<br />
distinctive <strong>of</strong> resting females, which have spawned during the past breeding season.<br />
Stage 6-3: recovering post-spawning females. <strong>The</strong> general aspect <strong>of</strong> the gonad is like a stage 3<br />
but with empty rooms, remaining large-sized atretic follicles and the blood vessels are still<br />
well apparent. This stage is characteristic <strong>of</strong> post-spawning females initiating another cycle <strong>of</strong><br />
vitellogenesis.<br />
Males were only recorded as being either in "breeding colour" or not.<br />
For each species, all the stage 4 and 5 females were preserved in 10 % formalin for<br />
later examination.<br />
Nine target species were selected according to their relative abundance, depth<br />
distribution and basic ecological characteristics (benthic or pellagic habits, broad trophic<br />
category) (Tómasson and Banda 1996, Turner 1996). <strong>The</strong>se were Lethrinops gossei Burgess<br />
& Axelrod, Lethrinops argenteus Ahl (= L. longipinnis 'orange head'), Diplotaxodon<br />
limnothrissa Turner, Diplotaxodon macrops Turner & Stauffer, Copadichromis virginalis<br />
Iles, Mylochromis anaphyrmus Burgess & Axelrod, Alticorpus mentale Stauffer & McKaye,<br />
Alticorpus macrocleithrum Stauffer & McKaye and Taeniolethrinops praeorbitalis Regan.<br />
For these species, all the females from each haul were preserved in formalin for later<br />
examination.<br />
16
All <strong>fish</strong> preserved in formalin were measured (SL) to the nearest mm and weighed to<br />
the nearest 0.1 g. <strong>The</strong>ir maturity stage was determined and the gonads in stage 4 were<br />
weighed for Gonado-Somatic Index (GSI) calculation (gonad weight/total body weight × 100)<br />
then preserved in 5% formalin for fecundity and mean oocyte weight calculation.<br />
<strong>The</strong> breeding season was determined from the monthly proportions (in %) <strong>of</strong> the<br />
different stages <strong>of</strong> sexual maturation (Legendre & Ecoutin 1989, Duponchelle et al. 1999). In<br />
order to eliminate the small immature females, which would give a biased weight to the<br />
immature stages (1 and 2), and to define more precisely the spawning season, only females<br />
which size was greater than or equal to the size at first sexual maturity were considered in<br />
analysis.<br />
<strong>The</strong> average size at first maturation (L 50 ) is defined as the standard length at which<br />
50% <strong>of</strong> the females are at an advanced stage <strong>of</strong> the first sexual cycle during the breeding<br />
season. In practice, this is the size at which 50% <strong>of</strong> the females have reached the stage 3 <strong>of</strong> the<br />
maturity scale (Legendre & Ecoutin 1996, Duponchelle & Panfili 1998). For the estimation <strong>of</strong><br />
L 50 , only the <strong>fish</strong> sampled during the height <strong>of</strong> the breeding season were considered.<br />
Age at maturity was calculated from the Von Bertalanffy Growth Curve (VBGC) equation:<br />
L t = LJ (1-exp (-K (t-t 0 )) (2)<br />
Where L t is the mean length at age t, LJ is the asymptotic length K the growth coefficient and<br />
t 0 the size at age 0. This equation can be written:<br />
t = (-ln (1- (L t / LJ)) / K) + t 0<br />
Replacing L t by the mean size at maturity (L 50 ), age at maturity (A 50 ) is then:<br />
A 50 = (-ln (1- (L 50 / LJ)) / K) + t 0<br />
LJ and K were obtained from length frequency distribution analysis and are provided in the<br />
Chapter "Growth" for twenty three <strong>of</strong> the species. <strong>The</strong> size at age 0 was considered null.<br />
Fecundity is defined here as the number <strong>of</strong> oocytes to be released at the next spawn,<br />
and correspond to the absolute fecundity. It is estimated, from gonads in the final maturation<br />
stage (stage 4), by the number <strong>of</strong> oocytes belonging to the largest diameter modal group. This<br />
oocyte group is clearly separated from the rest <strong>of</strong> the oocytes to the naked eye and<br />
corresponds approximately to oocytes that are going to be released (Duponchelle 1997,<br />
Duponchelle et al. 2000).<br />
Oocyte weight measurements were all carried out on samples preserved in 5%<br />
formalin. <strong>The</strong> average oocyte weight per female, was determined by weighing 50 oocytes<br />
(Peters 1963) belonging to those considered for fecundity estimates.<br />
In order to compare mean oocyte weight and diameter among the different species, the<br />
measurements need to be made on oocytes in a similar vitellogenic stage, then on oocytes<br />
whose growth is completed. A simplified version <strong>of</strong> the method applied by Duponchelle<br />
(1997) was used to determine the GSI threshold above which the oocyte weight do no longer<br />
increase significantly. For each species, the individual oocyte weights were plotted against the<br />
GSI. <strong>The</strong> GSI corresponded to the beginning <strong>of</strong> the asymptotic part <strong>of</strong> the curve was visually<br />
determined and the <strong>fish</strong> whose GSI was inferior to the defined GSI were removed. <strong>The</strong> final<br />
GSI threshold was reached when no correlation subsisted between the mean oocyte weight<br />
and the GSI.<br />
17
Plate 1. Alticorpus 'ge<strong>of</strong>freyi' (by Dave Voorvelt).<br />
125<br />
Number<br />
Weight<br />
Depth (m)<br />
100<br />
75<br />
50<br />
0 2 4 6 8 10<br />
Overall mean catches (%)<br />
Figure 2-1. Mean occurrence and abundance in the catches per depth <strong>of</strong> Alticorpus 'ge<strong>of</strong>freyi'<br />
in the SWA between July 1998 and May 1999.<br />
Frequency (%)<br />
35<br />
30<br />
25<br />
20<br />
15<br />
10<br />
5<br />
0<br />
55 65 75 85 95 105 115 125 135 145 155 165<br />
Standard Length (mm)<br />
Figure 2-2. Size range and frequencies <strong>of</strong> Alticorpus 'ge<strong>of</strong>freyi' caught in the SWA between<br />
July 1998 and May 1999.<br />
18
Results<br />
Alticorpus spp.<br />
Alticorpus 'ge<strong>of</strong>freyi' (Plate 1)<br />
721 females and 845 males were analysed. A. 'ge<strong>of</strong>freyi' is a deep water species rarely<br />
encountered at 50m. In our sampling it was most abundant at 75m and still well represented at<br />
125m. (Figure 2-1). It constituted in average between 2 and 9% <strong>of</strong> the catches in weight and<br />
between 1 and 5% in number, depending upon depth, but was more abundant at 75 m. <strong>The</strong><br />
mean CPUE per depth category was 0.3 kg for the shallow zone, 37.4 in the deep zone, and<br />
9.1 in the very deep zone, which differed markedly with the values <strong>report</strong>ed by Tómasson &<br />
Banda (1996) for the shallow (9.3 kg) and deep (11.4 kg) zones, but matched in the very deep<br />
zone (9.0 kg). <strong>The</strong>y also observed A. 'ge<strong>of</strong>freyi' from 20 m depth downwards in the SWA,<br />
whereas we never encountered it before 50 m. This might explain the difference in CPUE in<br />
the shallow zone. Specimens caught ranged between 55 and 165 mm with a mode from 110 to<br />
150 mm (Figure 2-2). <strong>The</strong> sex ratio observed over the full sampling period was F/M 0.5/0.5.<br />
<strong>The</strong> breeding season for females occurred from March to October with a maximum<br />
activity between May and August (Figure 2-3a). <strong>The</strong> proportion <strong>of</strong> males in breeding colour<br />
was much higher than the proportion <strong>of</strong> ripe females, but basically confirmed the position <strong>of</strong><br />
the breeding season (Figure 2-3b). Ripe females were mostly found at 75 and 100 m whereas<br />
males in breeding colour were much more abundant at 75m, suggesting that breeding could<br />
occur around 75 m depth (Table 2-1). <strong>The</strong> size at maturity <strong>of</strong> female was about 90mm (Figure<br />
2-4) and was reached at 14 months old.<br />
Table 2-1. Percentage <strong>of</strong> ripe females (stages 4 and 5), males in breeding colour and immature<br />
individuals (whose size is below the size at maturity) per depth for Alticorpus ge<strong>of</strong>freyi in<br />
the SWA.<br />
Depth<br />
Non ripe<br />
females<br />
Ripe females<br />
Males not in<br />
breeding colour<br />
Males in breeding<br />
colour<br />
Immature<br />
specimens<br />
50 m 0.5 0 0 0.5<br />
75 m 54.1 38.7 40.2 84.4 78.8<br />
100 m 13.5 42.7 16.7 3.9 15.2<br />
125 m 31.9 18.6 43.1 11.2 6<br />
<strong>The</strong> length-weight and fecundity-weight relationships are given in Figure 2-5 and 2-6,<br />
respectively. Fecundity ranged from 86 to 231 for females weighing between 33 and 94 g. No<br />
relation was found between oocyte weight and body weight. <strong>The</strong> GSI threshold above which<br />
the oocyte weight did no longer increase significantly was 3.7% (Figure 2-7) and the mean<br />
oocyte weight was 17.70 mg (± 2.48 SD, N= 26).<br />
19
50<br />
% ripe females<br />
a<br />
40<br />
30<br />
20<br />
10<br />
0<br />
Jul-98<br />
Aug-98<br />
Sep-98<br />
Oct-98<br />
Nov-98<br />
Dec-98<br />
Jan-99<br />
Feb-99<br />
Mar-99<br />
Apr-99<br />
May-99<br />
120 120 58 64 135 24 50 58 44 38<br />
% males in breeding colors<br />
b<br />
100<br />
80<br />
60<br />
40<br />
20<br />
0<br />
Jul-98<br />
Aug-98<br />
Sep-98<br />
Oct-98<br />
Nov-98<br />
Dec-98<br />
Jan-99<br />
Feb-99<br />
Mar-99<br />
Apr-99<br />
May-99<br />
131 111 106 63 115 27 48 40 65 115<br />
Figure 2-3. Seasonal progression <strong>of</strong> the percentage <strong>of</strong> ripe (stages 4 and 5) females (a) and<br />
males (b) Alticorpus 'ge<strong>of</strong>freyi' in the SWA <strong>The</strong> values below the x-axis are the effective<br />
(number <strong>of</strong> male or females which size was above the size at maturity) for each month.<br />
100<br />
% mature females<br />
50<br />
0<br />
65 75 85 95 105 115 125 135 145 155<br />
Standard length (mm)<br />
Figure 2-4. Percentage <strong>of</strong> mature females (stage 3 and above) per size class (standard length)<br />
for Alticorpus 'ge<strong>of</strong>freyi' in the SWA.<br />
20
120<br />
100<br />
Weight (g)<br />
80<br />
60<br />
40<br />
y = 6E-05x 2,8643<br />
20<br />
R 2 = 0,905<br />
0<br />
100 110 120 130 140 150 160<br />
Length (mm)<br />
Figure 2-5. Length-weight relationship for Alticorpus ge<strong>of</strong>freyi females in the SWA. (R² =<br />
determination coefficient).<br />
250<br />
200<br />
Fecundity<br />
150<br />
100<br />
50<br />
y = 1,7836x + 28,037<br />
R 2 = 0,5783<br />
0<br />
20 30 40 50 60 70 80 90 100<br />
Weight (g)<br />
Figure 2-6. Fecundity-weight relationship for Alticorpus ge<strong>of</strong>freyi females in the SWA. (R² =<br />
determination coefficient).<br />
Oocyte weight (mg)<br />
30<br />
25<br />
20<br />
15<br />
10<br />
5<br />
0<br />
y = 0,3432x + 16,224<br />
R 2 = 0,0079<br />
2,0 3,0 4,0 5,0 6,0 7,0<br />
GSI (%)<br />
Figure 2-7. Relationship between oocyte weight and gonado-somatic index (GSI) for<br />
Alticorpus ge<strong>of</strong>freyi. Oocytes from females whose GSI was below (in grey) and above (in<br />
black with regression) 3.7 %. (R² = determination coefficient)<br />
21
Plate 2. Alticorpus macrocleithrum (by Dave Voorvelt).<br />
125<br />
Number<br />
Weight<br />
Depth (m)<br />
100<br />
75<br />
0,0 0,5 1,0 1,5<br />
Overall mean catches (%)<br />
Figure 3-1. Mean occurrence and abundance in the catches per depth <strong>of</strong> Alticorpus<br />
macrocleithrum in the SWA between July 1998 and May 1999.<br />
25<br />
20<br />
Frequency %<br />
15<br />
10<br />
5<br />
0<br />
62 67 72 77 82 87 92 97 102 107 112 117 122 127 132 137 142 147<br />
Standard length (mm)<br />
Figure 3-2. Size range and frequencies <strong>of</strong> Alticorpus macrocleithrum caught in the SWA<br />
between July 1998 and May 1999.<br />
22
Alticorpus macrocleithrum (Stauffer & McKaye) (Plate 2)<br />
317 females and 153 males were analysed. A. macrocleithrum is a deep water species<br />
encountered between 75 m and 125 m, but more abundant at 100 m (Figure 3-1). It is not an<br />
abundant species, always constituting less than 1.5% <strong>of</strong> the catches both in weight and<br />
number. <strong>The</strong> mean CPUE per depth category was 5.1 kg in the deep zone and 0.6 kg in the<br />
very deep zone, which is about twice the values <strong>report</strong>ed in Tómasson & Banda (1996) for the<br />
deep zone (2.7 kg), but 8 times less in the very deep zone (5 kg). As for A. 'ge<strong>of</strong>freyi', the<br />
depth distribution we found was more restricted than that observed by Tómasson & Banda<br />
(1996), who found A. macrocleithrum from 40 m downwards. Specimens caught ranged<br />
between 60 and 148 mm with a mode from 105 to 130 mm (Figure 3-2). <strong>The</strong> sex ratio<br />
observed over the full sampling period was F/M 0.7/0.3.<br />
Owing to weak sample number at some months both for females and males, the<br />
breeding season is difficult to determine with certainty (Figure 3-3a and b). It seemed from<br />
female data (Figure 3-3a) that breeding season occurred between April and August. Despite<br />
high fluctuations from 0 to 100% due to very low sample size at some months (June, October,<br />
April and May), the data for males supported by correct sample size tended to confirm that<br />
breeding season. However, the low sample size for females in September–October and in<br />
March do not allow us to exclude the possibility that breeding season might be a bit<br />
protracted, beginning a bit earlier and finishing a bit later than observed on those graphs<br />
(March to September ?). All the breeding females, nearly all (97%) the males in breeding<br />
colour (Table 3-1) were found are 100 m, suggesting that spawning might occur at that depth.<br />
Maturity was reached early in their second year at 18 months old at a mean size <strong>of</strong> 100 mm<br />
for females (Figure 3-4). However, size at maturity has to be determined at the height <strong>of</strong> the<br />
breeding season to be accurate but owing to the low sample size we had to consider every data<br />
available. As a consequence, it is likely that L 50 was overestimated.<br />
Table 3-1. Percentage <strong>of</strong> ripe females (stages 4 and 5), males in breeding colour and immature<br />
individuals (whose size is below the size at maturity) per depth for Alticorpus<br />
macrocleithrum in the SWA.<br />
Depth<br />
Non ripe<br />
females<br />
Ripe females<br />
Males not in<br />
breeding colour<br />
Males in breeding<br />
colour<br />
Immature<br />
specimens<br />
75 m 29.7<br />
100 m 64.4 100 83.3 96.6 88<br />
125 m 5.9 16.7 3.4 12<br />
<strong>The</strong> length-weight and fecundity-weight relationships are given in Figure 3-5 and 3-6,<br />
respectively. Fecundity ranged from 96 to 304 for females weighing between 26 and 76 g. No<br />
relation was found between oocyte weight and body weight. <strong>The</strong> GSI threshold above which<br />
the oocyte weight did no longer increase significantly was 4.5% (Figure 3-7) and the mean<br />
oocyte weight was 12.73 mg (± 2.6 SD, N= 24).<br />
23
60<br />
50<br />
% ripe females<br />
40<br />
30<br />
20<br />
10<br />
0<br />
Jun-98<br />
Jul-98<br />
Aug-98<br />
Sep-98<br />
Oct-98<br />
Nov-98<br />
Dec-98<br />
Jan-99<br />
Feb-99<br />
Mar-99<br />
Apr-99<br />
May-99<br />
a<br />
43 100 85 8 13 24 14 5 6 8 11<br />
100<br />
80<br />
60<br />
40<br />
20<br />
-<br />
Jun-98<br />
Jul-98<br />
Aug-98<br />
Sep-98<br />
Oct-98<br />
% males in breeding colour<br />
Nov-98<br />
Dec-98<br />
Jan-99<br />
Feb-99<br />
Mar-99<br />
Apr-99<br />
May-99<br />
b<br />
1 18 27 2 25 40 12 10 11 1 1<br />
Figure 3-3. Seasonal progression <strong>of</strong> the percentage <strong>of</strong> ripe (stages 4 and 5) females (a) and<br />
males (b) Alticorpus macrocleithrum in the SWA <strong>The</strong> values below the x-axis are the<br />
effective (number <strong>of</strong> male or females which size was above the size at maturity) for each<br />
month.<br />
100<br />
% mature females<br />
50<br />
0<br />
65 75 85 95 105 115 125 135<br />
Standard length (mm)<br />
Figure 3-4. Percentage <strong>of</strong> mature females (stage 3 and above) per size class (standard length)<br />
for Alticorpus macrocleithrum in the SWA.<br />
24
Weight (g)<br />
80<br />
70<br />
60<br />
50<br />
40<br />
30<br />
20<br />
y = 9E-05x 2,7566<br />
10<br />
R 2 = 0,8485<br />
0<br />
50 70 90 110 130 150<br />
Length (mm)<br />
Figure 3-5. Length-weight relationship for Alticorpus macrocleithrum females in the SWA.<br />
(R² = determination coefficient).<br />
Fecundity<br />
350<br />
300<br />
250<br />
200<br />
150<br />
100<br />
50<br />
y = 3,3229x + 14,744<br />
R 2 = 0,5662<br />
0<br />
20 30 40 50 60 70 80<br />
Weight (g)<br />
Figure 3-6. Fecundity-weight relationship for Alticorpus macrocleithrum females in the SWA.<br />
(R² = determination coefficient).<br />
Oocyte weight (mg)<br />
20<br />
18<br />
16<br />
14<br />
12<br />
10<br />
8<br />
6<br />
4<br />
y = 0,5497x + 9,9522<br />
2<br />
R 2 = 0,0292<br />
0<br />
2,0 3,0 4,0 5,0 6,0 7,0 8,0<br />
GSI (%)<br />
Figure 3-7. Relationship between oocyte weight and gonado-somatic index (GSI) for<br />
Alticorpus macrocleithrum. Oocytes from females whose GSI was below (in grey) and<br />
above (in black with regression) 4.5%. (R² = determination coefficient)<br />
25
Plate 3. Alticorpus mentale (by Dave Voorvelt).<br />
125<br />
Depth (m)<br />
100<br />
75<br />
50<br />
30<br />
Number<br />
Weight<br />
0 5 10 15<br />
Overall mean catches (%)<br />
Figure 4-1. Mean occurrence and abundance in the catches per depth <strong>of</strong> Alticorpus mentale in<br />
the SWA between July 1998 and May 1999.<br />
14<br />
12<br />
Frequency %<br />
10<br />
8<br />
6<br />
4<br />
2<br />
0<br />
55 65 75 85 95 105 115 125 135 145 155 165 175 185 195 205 215 225 235 245<br />
Standard length (mm)<br />
Figure 4-2. Size range and frequencies <strong>of</strong> Alticorpus mentale caught in the SWA between July<br />
1998 and May 1999.<br />
26
Alticorpus mentale (Stauffer & McKaye) (Plate 3)<br />
1011 females and 959 males were analysed. A. mentale is a deep water species that can<br />
be encountered from 30 m but becomes abundant from 75 m downwards (Figure 4-1). It is an<br />
abundant <strong>fish</strong> always constituting between 7 and 13% <strong>of</strong> the catches in weight and a bit less in<br />
number (about 3%) due to its large size. <strong>The</strong> mean CPUE per depth category was 1.1 kg in the<br />
shallow zone, 51.1 kg in the deep zone and 20.1 kg in the very deep zone, which is about<br />
twice as much as <strong>report</strong>ed in Tómasson & Banda (1996) for the deep and very deep zones<br />
(11.4 and 12.7 kg, respectively), but 2 times less in the shallow zone (2.3 kg). <strong>The</strong> depth<br />
distribution we found corresponded with that observed by Tómasson & Banda (1996).<br />
Specimens caught ranged between 53 and 245 mm (Figure 4-2). <strong>The</strong> sex ratio observed over<br />
the full sampling period was F/M 0.5/0.5.<br />
Unlike A. 'ge<strong>of</strong>freyi' and A. macrocleithrum, A. mentale breeds throughout the year<br />
with a peak in November and another one in January-February and a marked decrease <strong>of</strong><br />
activity in December and May (Figure 4-3a). Males in breeding colour were also found at<br />
each month even thought peaks <strong>of</strong> activity did not necessarily match those <strong>of</strong> females (Figure<br />
4-3b). It is interesting to note that the period from November to March is the period when<br />
Aulonocara 'minutus', frequently found as the dominant prey items in A. mentale stomach<br />
contents (see Chapter "Diet"), was most abundant in the catches. Ripe females were more<br />
abundant at 75 and 100 m whereas males in breeding colour were preferentially found at 100<br />
m and 125 m in a lesser extent (Table 4-1). Immature individuals were mostly found at 75 m<br />
but were reasonably abundant at 100 and 125 m. A. mentale seems able to spawn at any depth<br />
between 75 and 125 m. Maturity was reached early in their second year at 16 months old at a<br />
mean size <strong>of</strong> 160 mm for females (Figure 4-4).<br />
Table 4-1. Percentage <strong>of</strong> ripe females (stages 4 and 5), males in breeding colour and immature<br />
individuals (whose size is below the size at maturity) per depth for Alticorpus mentale in<br />
the SWA.<br />
Depth<br />
Non ripe<br />
females<br />
Ripe females<br />
Males not in<br />
breeding colour<br />
Males in breeding<br />
colour<br />
Immature<br />
specimens<br />
30 m 0.2 0 0 0 0<br />
50 m 1 0 2.6 0.5 4.7<br />
75 m 39 41.8 4.3 9.4 54.3<br />
100 m 26.9 44.5 25 68.5 19.6<br />
125 m 32.8 13.6 29.1 21.6 21.5<br />
<strong>The</strong> length-weight and fecundity-weight relationships are given in Figure 4-5 and 4-6,<br />
respectively. Fecundity ranged from 92 to 356 for females weighing between 49 and 307 g.<br />
No relation was found between oocyte weight and body weight. <strong>The</strong> GSI threshold above<br />
which the oocyte weight did no longer increase significantly was 3% (Figure 4-7) and the<br />
mean oocyte weight was 24.36 mg (± 4.18 SD, N= 31).<br />
27
50<br />
% ripe females<br />
40<br />
30<br />
20<br />
10<br />
0<br />
a<br />
Jun-98<br />
Jul-98<br />
Aug-98<br />
Sep-98<br />
Oct-98<br />
Nov-98<br />
Dec-98<br />
Jan-99<br />
Feb-99<br />
Mar-99<br />
Apr-99<br />
May-99<br />
30 48 71 66 66 57 52 83 47 34 35<br />
% males in breeding colour<br />
b<br />
-<br />
70<br />
60<br />
50<br />
40<br />
30<br />
20<br />
10<br />
Jun-98<br />
Jul-98<br />
Aug-98<br />
Sep-98<br />
Oct-98<br />
Figure 4-3. Seasonal progression <strong>of</strong> the percentage <strong>of</strong> ripe (stages 4 and 5) females (a) and<br />
males (b) Alticorpus mentale in the SWA <strong>The</strong> values below the x-axis are the effective<br />
(number <strong>of</strong> male or females which size was above the size at maturity) for each month.<br />
Nov-98<br />
Dec-98<br />
Jan-99<br />
Feb-99<br />
Mar-99<br />
Apr-99<br />
May-99<br />
56 91 83 70 114 120 75 104 79 108 48<br />
100<br />
% <strong>of</strong> mature females<br />
50<br />
0<br />
55 65 75 85 95 105 115 125 135 145 155 165 175 185 195 205 215 225 235<br />
Standard length (mm)<br />
Figure 4-4. Percentage <strong>of</strong> mature females (stage 3 and above) per size class (standard length)<br />
for Alticorpus mentale in the SWA.<br />
28
500<br />
Weight (g)<br />
400<br />
300<br />
200<br />
100<br />
0<br />
y = 2E-05x 3,1181<br />
R 2 = 0,9794<br />
0 50 100 150 200 250 300<br />
Length (mm)<br />
Figure 4-5. Length-weight relationship for Alticorpus mentale females in the SWA. (R² =<br />
determination coefficient).<br />
Fecundity<br />
400<br />
350<br />
300<br />
250<br />
200<br />
150<br />
100<br />
50<br />
0<br />
y = 0,9359x + 63,115<br />
R 2 = 0,6394<br />
0 50 100 150 200 250 300 350<br />
Weight (g)<br />
Figure 4-6. Fecundity-weight relationship for Alticorpus mentale females in the SWA. (R² =<br />
determination coefficient).<br />
35<br />
30<br />
Occyte weight (mg)<br />
25<br />
20<br />
15<br />
10<br />
y = 1,3294x + 19,431<br />
5<br />
R 2 = 0,0271<br />
0<br />
1,0 1,5 2,0 2,5 3,0 3,5 4,0 4,5 5,0 5,5<br />
GSI (%)<br />
Figure 4-7. Relationship between oocyte weight and gonado-somatic index (GSI) for<br />
Alticorpus mentale. Oocytes from females whose GSI was below (in grey) and above (in<br />
black with regression) 3%. (R² = determination coefficient)<br />
29
125<br />
Depth (m)<br />
100<br />
75<br />
Number<br />
Weight<br />
0 1 2 3 4 5<br />
Overall mean catches (%)<br />
Figure 5-1. Mean occurrence and abundance in the catches per depth <strong>of</strong> Alticorpus pectinatum<br />
in the SWA between July 1998 and May 1999.<br />
Frequency %<br />
16<br />
14<br />
12<br />
10<br />
8<br />
6<br />
4<br />
2<br />
0<br />
57 62 67 72 77 82 87 92 97 102 107 112 117 122 127 132 137<br />
Standard length (mm)<br />
Figure 5-2. Size range and frequencies <strong>of</strong> Alticorpus pectinatum caught in the SWA between<br />
July 1998 and May 1999.<br />
30
Alticorpus pectinatum (Stauffer & McKaye)<br />
259 females and 375 males were analysed. A. pectinatum is a deep water <strong>fish</strong> evenly<br />
distributed between 75 m and 125 m (Figure 5-1). It is not an abundant species, always<br />
constituting between 1 and 2% <strong>of</strong> the catches both in weight and number. <strong>The</strong> mean CPUE<br />
per depth category was 8.4 kg in the deep zone and 2.6 kg in the very deep zone, which is<br />
about twice as much as the values <strong>report</strong>ed in Tómasson & Banda (1996) for the deep zone<br />
(3.8 kg), but about 4 times less in the very deep zone (8.9 kg). As for A. 'ge<strong>of</strong>freyi' and A.<br />
macrocleithrum, the depth distribution we found was more restricted than that observed by<br />
Tómasson & Banda (1996), who found A. pectinatum from 45 m downwards. Specimens<br />
caught ranged between 55 and 140 mm with a mode from 100 to 125 mm (Figure 5-2). <strong>The</strong><br />
sex ratio observed over the full sampling period was F/M 0.4/0.6.<br />
<strong>The</strong> breeding season occurred from November to May with an increased activity in<br />
January-February (Figure 5-3a). <strong>The</strong> monthly progression <strong>of</strong> males in breeding colour<br />
indicated the same pattern and suggested that breeding season could be protracted, occurring<br />
also in June, when all the males (43) were in breeding colour (Figure 5-3b). About three<br />
quarter <strong>of</strong> the breeding females were found at 100 m and the other quarter at 75 m, whereas<br />
males in breeding colour and immature individuals were more evenly distributed at 75 and<br />
100 m (Table 5-1). Spawning might occur mostly at 100 m although males and immature<br />
distribution does not confirm it firmly. Maturity was reached early in their second year at 12<br />
months old at a mean size <strong>of</strong> 70 mm for females (Figure 5-4).<br />
Table 5-1. Percentage <strong>of</strong> ripe females (stages 4 and 5), males in breeding colour and immature<br />
individuals (whose size is below the size at maturity) per depth for Alticorpus pectinatum<br />
in the SWA.<br />
Depth<br />
Non ripe<br />
females<br />
Ripe females<br />
Males not in<br />
breeding colour<br />
Males in breeding<br />
colour<br />
Immature<br />
specimens<br />
75 m 37.6 24.1 53.3 47 42.3<br />
100 m 40.2 72.4 19.2 30.5 50<br />
125 m 22.3 3.4 27.5 22.5 7.7<br />
<strong>The</strong> length-weight and fecundity-weight relationships are given in Figure 5-5 and 5-6,<br />
respectively. Fecundity ranged from 38 to 181 for females weighing between 7 and 44 g. No<br />
relation was found between oocyte weight and body weight. <strong>The</strong> GSI threshold above which<br />
the oocyte weight did no longer increase significantly was 4% (Figure 5-7) and the mean<br />
oocyte weight was 15.29 mg (± 2.8 SD, N= 3).<br />
31
a<br />
% males in breeding colour<br />
b<br />
% ripe females<br />
100<br />
80<br />
60<br />
40<br />
20<br />
0<br />
30<br />
25<br />
20<br />
15<br />
10<br />
5<br />
0<br />
Jul-98<br />
Aug-98<br />
Sep-98<br />
Oct-98<br />
Nov-98<br />
Dec-98<br />
Jan-99<br />
Feb-99<br />
Mar-99<br />
Apr-99<br />
May-99<br />
12 5 5 51 29 16 49 34 28 29<br />
Jun-98<br />
Jul-98<br />
Aug-98<br />
Sep-98<br />
Oct-98<br />
Nov-98<br />
Dec-98<br />
Jan-99<br />
Feb-99<br />
Mar-99<br />
Apr-99<br />
May-99<br />
43 11 4 12 88 63 13 57 41 20 21<br />
Figure 5-3. Seasonal progression <strong>of</strong> the percentage <strong>of</strong> ripe (stages 4 and 5) females (a) and<br />
males (b) Alticorpus pectinatum in the SWA <strong>The</strong> values below the x-axis are the effective<br />
(number <strong>of</strong> male or females which size was above the size at maturity) for each month.<br />
100<br />
% mature females<br />
50<br />
0<br />
45 55 65 75 85 95 105 115 125 135 145<br />
Standard length (mm)<br />
Figure 5-4. Percentage <strong>of</strong> mature females (stage 3 and above) per size class (standard length)<br />
for Alticorpus pectinatum in the SWA.<br />
32
60<br />
50<br />
Weight (g)<br />
40<br />
30<br />
20<br />
y = 3E-05x 2,9656<br />
10<br />
R 2 = 0,9656<br />
0<br />
50 70 90 110 130<br />
Length (mm)<br />
Figure 5-5. Length-weight relationship for Alticorpus pectinatum females in the SWA. (R² =<br />
determination coefficient).<br />
200<br />
150<br />
Fecundity<br />
100<br />
50<br />
0<br />
y = 3,2395x + 12,796<br />
R 2 = 0,6576<br />
0 10 20 30 40 50<br />
Weight (g)<br />
Figure 5-6. Fecundity-weight relationship for Alticorpus pectinatum females in the SWA. (R²<br />
= determination coefficient).<br />
Oocyte weight (mg)<br />
20<br />
18<br />
16<br />
14<br />
12<br />
10<br />
8<br />
6<br />
4<br />
2<br />
0<br />
0,0 1,0 2,0 3,0 4,0 5,0 6,0<br />
GSI (%)<br />
Figure 5-7. Relationship between oocyte weight and gonado-somatic index (GSI) for<br />
Alticorpus pectinatum. Oocytes from females whose GSI was below (in grey) and above<br />
(in black with regression) 4%. (R² = determination coefficient)<br />
33
Plate 4. Aulonocara 'blue orange' (by Dave Voorvelt).<br />
50<br />
Number<br />
Weight<br />
Depth (m)<br />
30<br />
10<br />
0 5 10 15<br />
Overall mean catches (%)<br />
Figure 6-1. Mean occurrence and abundance in the catches per depth <strong>of</strong> Aulonocara 'blue<br />
orange' in the SWA between July 1998 and May 1999.<br />
Frequency %<br />
35<br />
30<br />
25<br />
20<br />
15<br />
10<br />
5<br />
0<br />
42 47 52 57 62 67 72 77<br />
Standard length (mm)<br />
Figure 6-2. Size range and frequencies <strong>of</strong> Aulonocara 'blue orange' caught in the SWA<br />
between July 1998 and May 1999.<br />
34
Aulonocara spp.<br />
Aulonocara 'blue orange' (Plate 4)<br />
244 females and 485 males were analysed. A. 'blue orange' is a small <strong>fish</strong> encountered<br />
in shallow water between 10 and 50 m but only abundant at 10 and 30 m, where it constituted<br />
9.5 and 12.6% <strong>of</strong> the catches in number, respectively and 3.2 and 4.5% in weight (Figure 6-1).<br />
It was found only once at 75 m in November 98. <strong>The</strong> mean CPUE per depth category was<br />
higher (17.6 kg in the shallow zone) than that <strong>report</strong>ed in Tómasson & Banda (1996). <strong>The</strong><br />
depth distribution was much more restricted in our case than the 10 to 130 m depth range they<br />
<strong>report</strong>ed. Specimens caught ranged between 40 and 80 mm with a mode from 50 to 65 mm<br />
(Figure 6-2). <strong>The</strong> sex ratio observed over the full sampling period was F/M 0.3/0.7.<br />
Owing to identification uncertainty, data from June and July 1998 were not included in<br />
the analyses. <strong>The</strong> breeding season seemed to occur between July-August and February (Figure<br />
6-3a and b). However, due to the very low sample size in March and April and the high<br />
percentage <strong>of</strong> males in breeding colour in April and May, it can't be excluded that A. 'blue<br />
orange' might breed throughout the year. More than three quarter <strong>of</strong> the ripe females were<br />
sampled at 10 m and the other quarter at 30 m (Table 6-1). Males in breeding colour were<br />
evenly distributed between 10 and 30 m and most <strong>of</strong> the immature individuals were found at<br />
30 m. If A. 'blue orange' does spawn at a precise depth, it does not reflect clearly in breeding<br />
males and immature distribution. However, the results suggest that spawning would occur<br />
around 10 m. Maturity was reached in their first year at 9 months old at a mean size <strong>of</strong> 48 mm<br />
for females (Figure 6-4).<br />
Table 6-1. Percentage <strong>of</strong> ripe females (stages 4 and 5), males in breeding colour and immature<br />
individuals (whose size is below the size at maturity) per depth for Aulonocara 'blue<br />
orange' in the SWA.<br />
Depth<br />
Non ripe<br />
females<br />
Ripe females<br />
Males not in<br />
breeding colour<br />
Males in breeding<br />
colour<br />
Immature<br />
specimens<br />
10 m 47.3 76 60.9 45.5 34.2<br />
30 m 47.9 24 36.6 48.5 61.8<br />
50 m 4.8 0 2.6 6.1 3.9<br />
<strong>The</strong> length-weight and fecundity-weight relationships are given in Figure 6-5 and 6-6,<br />
respectively. Fecundity ranged from 9 to 41 for females weighing between 2 and 7g. No<br />
relation was found between oocyte weight and body weight. <strong>The</strong> GSI threshold above which<br />
the oocyte weight did no longer increase significantly was 2.5% (Figure 6-7) and the mean<br />
oocyte weight was 4.46 mg (± 0.89 SD, N= 16).<br />
35
% ripe females<br />
90<br />
80<br />
70<br />
60<br />
50<br />
40<br />
30<br />
20<br />
10<br />
0<br />
a<br />
Aug-98<br />
Sep-98<br />
Oct-98<br />
Nov-98<br />
Dec-98<br />
Jan-99<br />
Feb-99<br />
Mar-99<br />
Apr-99<br />
May-99<br />
14 14 50 40 39 35 2 1 30<br />
% males in breeding colour<br />
b<br />
100<br />
90<br />
80<br />
70<br />
60<br />
50<br />
40<br />
30<br />
20<br />
10<br />
0<br />
Aug-98<br />
Sep-98<br />
Oct-98<br />
Nov-98<br />
Figure 6-3. Seasonal progression <strong>of</strong> the percentage <strong>of</strong> ripe (stages 4 and 5) females (a) and<br />
males (b) Aulonocara 'blue orange' in the SWA <strong>The</strong> values below the x-axis are the<br />
effective (number <strong>of</strong> male or females which size was above the size at maturity) for each<br />
month.<br />
Dec-98<br />
Jan-99<br />
Feb-99<br />
Mar-99<br />
Apr-99<br />
6 7 95 110 93 78 8 2 86<br />
May-99<br />
100<br />
% mature females<br />
50<br />
0<br />
37 42 47 52 57 62 67<br />
Standard length (mm)<br />
Figure 6-4. Percentage <strong>of</strong> mature females (stage 3 and above) per size class (standard length)<br />
for Aulonocara 'blue orange' in the SWA.<br />
36
Weight (g)<br />
8<br />
7<br />
6<br />
5<br />
4<br />
3<br />
2<br />
1<br />
0<br />
y = 3E-05x 2,9596<br />
R 2 = 0,8159<br />
40 45 50 55 60 65 70<br />
Length (mm)<br />
Figure 6-5. Length-weight relationship for Aulonocara 'blue orange' females in the SWA. (R²<br />
= determination coefficient).<br />
Fecundity<br />
45<br />
40<br />
35<br />
30<br />
25<br />
20<br />
15<br />
10<br />
5<br />
0<br />
y = 3,3845x + 9,6689<br />
R 2 = 0,2613<br />
1,5 2,5 3,5 4,5 5,5 6,5 7,5<br />
Weight (g)<br />
Figure 6-6. Fecundity-weight relationship for Aulonocara 'blue orange' females in the SWA.<br />
(R² = determination coefficient).<br />
7<br />
6<br />
Oocyte weight (mg)<br />
5<br />
4<br />
3<br />
2<br />
1<br />
y = 0,2444x + 3,6419<br />
R 2 = 0,0837<br />
0<br />
1,0 2,0 3,0 4,0 5,0 6,0 7,0<br />
GSI (%)<br />
Figure 6-7. Relationship between oocyte weight and gonado-somatic index (GSI) for<br />
Aulonocara 'blue orange'. Oocytes from females whose GSI was below (in grey) and<br />
above (in black with regression) 2.5%. (R² = determination coefficient).<br />
37
50<br />
Depth (m)<br />
30<br />
10<br />
Number<br />
Weight<br />
0,0 0,5 1,0 1,5<br />
Overall mean catches (%)<br />
Figure 7-1. Mean occurrence and abundance in the catches per depth <strong>of</strong> Aulonocara 'cf.<br />
macrochir' in the SWA between July 1998 and May 1999.<br />
25<br />
20<br />
Frequency %<br />
15<br />
10<br />
5<br />
0<br />
52 57 62 67 72 77 82 87 92 97 102 107 112 117 122 127 132<br />
Size class (mm)<br />
Figure 7-2. Size range and frequencies <strong>of</strong> Aulonocara 'cf. macrochir' caught in the SWA<br />
between July 1998 and May 1999.<br />
38
Aulonocara 'cf. macrochir'<br />
74 females and 90 males were analysed. A. 'cf. macrochir' was a relatively rare <strong>fish</strong><br />
encountered from 10 m to 50 m but more abundant at 50 m where it constituted 1% and 0.8%<br />
<strong>of</strong> the catches in weight and number, respectively (Figure 7-1). <strong>The</strong> mean CPUE per depth<br />
category (2.7 kg in the shallow zone) matched that <strong>report</strong>ed in Tómasson & Banda (1996).<br />
<strong>The</strong> depth distribution was much more restricted in our case than the 8 to 150 m depth range<br />
that they <strong>report</strong>ed. Specimens caught ranged between 50 and 135 mm with a mode from 95 to<br />
110 mm (Figure 7-2). <strong>The</strong> sex ratio observed over the full sampling period was F/M 0.5/0.5.<br />
As A. 'cf. macrochir' is a relatively rare species, the following information about life<br />
history traits is based on low sample size and can not be considered as very reliable but rather<br />
as indicative. A breeding activity was observed from August to October and from December<br />
to March (Figure 7-3a and b). Taking into account the sparse information available about both<br />
females and males, it can be hypothesised that this species might breed most <strong>of</strong> the year, with<br />
reduced activity in June and July. As most specimens were caught at 50 m the percentages <strong>of</strong><br />
ripe females (62.5%), males in breeding colour (100%) and immature individuals (87%) at<br />
this depth suggested that spawning probably occurs at 50 m. Maturity was reached at about<br />
100 mm for females (Figure 7-4). Again, owing to low sample size, L 50 was probably<br />
overestimated and is likely to be closer to 90 mm.<br />
<strong>The</strong> length-weight and fecundity-weight relationships are given in Figure 7-5 and 7-6,<br />
respectively. Fecundity ranged from 50 to 134 for females weighing between 16 and 60 g. No<br />
relationship was found between oocyte weight and body weight. <strong>The</strong> GSI threshold above<br />
which the oocyte weight did no longer increase significantly was impossible to assess due to<br />
the low sample size. However, as no relationship was found between oocyte weight and GSI<br />
from the data available (Figure 7-7), the mean oocyte weight was estimated from all the<br />
available data and was 4.82 mg (± 1.13 SD, N= 8).<br />
39
80<br />
% ripe females<br />
60<br />
40<br />
20<br />
0<br />
a<br />
Aug-98<br />
Sep-98<br />
Oct-98<br />
Nov-98<br />
Dec-98<br />
Jan-99<br />
Feb-99<br />
Mar-99<br />
Apr-99<br />
May-99<br />
4 16 10 13 13 8 3 6 1<br />
% males in breeding colour<br />
b<br />
100<br />
90<br />
80<br />
70<br />
60<br />
50<br />
40<br />
30<br />
20<br />
10<br />
0<br />
Aug-98<br />
Sep-98<br />
Oct-98<br />
Nov-98<br />
Dec-98<br />
Jan-99<br />
Feb-99<br />
Mar-99<br />
Apr-99<br />
May-99<br />
1 5 14 21 6 18 20 3<br />
Figure 7-3. Seasonal progression <strong>of</strong> the percentage <strong>of</strong> ripe (stages 4 and 5) females (a) and<br />
males (b) Aulonocara 'cf. macrochir' in the SWA <strong>The</strong> values below the x-axis are the<br />
effective (number <strong>of</strong> male or females which size was above the size at maturity) for each<br />
month.<br />
100<br />
% mature females<br />
50<br />
0<br />
55 65 75 85 95 105 115 125 135<br />
Standard length (mm)<br />
Figure 7-4. Percentage <strong>of</strong> mature females (stage 3 and above) per size class (standard length)<br />
for Aulonocara 'cf. macrochir' in the SWA.<br />
40
Weight (g)<br />
70<br />
60<br />
50<br />
40<br />
30<br />
20<br />
10<br />
y = 2E-05x 3,054<br />
R 2 = 0,9716<br />
0<br />
70 80 90 100 110 120 130<br />
Length (mm)<br />
Figure 7-5. Length-weight relationship for Aulonocara 'cf. macrochir' females in the SWA.<br />
(R² = determination coefficient).<br />
Fecundity<br />
160<br />
140<br />
120<br />
100<br />
80<br />
60<br />
40<br />
20<br />
0<br />
y = 1,6714x + 18,2<br />
R 2 = 0,9103<br />
0 20 40 60 80<br />
Weight (g)<br />
Figure 7-6. Fecundity-weight relationship for Aulonocara 'cf. macrochir' females in the SWA.<br />
(R² = determination coefficient).<br />
Oocyte weight (mg)<br />
7<br />
6<br />
5<br />
4<br />
3<br />
2<br />
1<br />
y = -0,1133x + 4,9968<br />
R 2 = 0,0029<br />
0<br />
0,0 0,5 1,0 1,5 2,0 2,5 3,0<br />
GSI (%)<br />
Figure 7-7. Relationship between oocyte weight and gonado-somatic index (GSI) for<br />
Aulonocara 'cf. macrochir'. (R² = determination coefficient).<br />
41
Plate 5. Aulonocara 'minutus' (by Dave Voorvelt).<br />
125<br />
Depth (m)<br />
100<br />
75<br />
Number<br />
Weight<br />
0 5 10 15<br />
Overall mean catches (%)<br />
Figure 8-1. Mean occurrence and abundance in the catches per depth <strong>of</strong> Aulonocara 'minutus'<br />
in the SWA between July 1998 and May 1999.<br />
30<br />
25<br />
Frequency %<br />
20<br />
15<br />
10<br />
5<br />
0<br />
27 32 37 42 47 52 57 62 67 72<br />
Standard length (mm)<br />
Figure 8-2. Size range and frequencies <strong>of</strong> Aulonocara 'minutus' caught in the SWA between<br />
July 1998 and May 1999.<br />
42
Aulonocara 'minutus' (Plate 5)<br />
573 females and 781 males were analysed. A. 'minutus' is a deep water <strong>fish</strong> caught<br />
from 75 to 125 m depth (Figure 8-1). It was much more abundant at 125 m, where it<br />
constituted up to 14% <strong>of</strong> the catches in number and only 1.7% in weight owing to its very<br />
small size. A. 'minutus' is one <strong>of</strong> the smallest demersal species <strong>of</strong> <strong>Lake</strong> <strong>Malawi</strong>. Specimens<br />
collected ranged between 25 and 75 mm with a mode from 40 to 60 mm (Figure 8-2). <strong>The</strong> sex<br />
ratio observed over the full sampling period was F/M 0.4/0.6. <strong>The</strong> mean CPUE per depth<br />
category was 3.5 kg in the deep zone and 2.6 kg in the very deep zone, which is about two<br />
times less than the values <strong>report</strong>ed in Tómasson & Banda (1996) for the deep zone (7.3 kg),<br />
and about 4 times less in the very deep zone (11.3 kg). As for A. 'cf. macrochir' and A. 'blue<br />
orange', the depth distribution we found was much more restricted than that observed by<br />
Tómasson & Banda (1996), who found A. 'minutus' from 10 to 130 m.<br />
Unlike A. 'cf. macrochir' and A. 'blue orange', A. 'minutus' was found to breed<br />
throughout the year with an increased activity in June and February (Figure 8-3a and b).<br />
About 50% <strong>of</strong> non breeding females and males as well as immature individuals were found at<br />
125 m, the other half being evenly distributed between 75 and 100m (Table 8-1). On the other<br />
hand, about 50% <strong>of</strong> the ripe females and males in breeding colour were caught at 100 m,<br />
whereas the other half were evenly distributed at 75 and 125. This suggested that spawning<br />
might occur at 100 m. Maturity was reached in their first year at 7 months at a mean size <strong>of</strong> 42<br />
mm for females (Figure 8-4).<br />
Table 8-1. Percentage <strong>of</strong> ripe females (stages 4 and 5), males in breeding colour and immature<br />
individuals (whose size is below the size at maturity) per depth for Aulonocara 'minutus' in<br />
the SWA.<br />
Depth<br />
Non ripe<br />
females<br />
Ripe females<br />
Males not in<br />
breeding colour<br />
Males in breeding<br />
colour<br />
Immature<br />
specimens<br />
75 m 24.2 18.7 15.7 20.9 18.1<br />
100 m 27.7 53.8 28.6 48.1 32.2<br />
125 m 48.1 27.5 55.7 31 49.7<br />
<strong>The</strong> length-weight and fecundity-weight relationships are given in Figure 8-5 and 8-6,<br />
respectively. Fecundity ranged from 50 to 134 for females weighing between 16 and 60 g and<br />
was not significantly correlated to female body weight (r = 0.26). No relation was found<br />
between oocyte weight and body weight. <strong>The</strong> GSI threshold above which the oocyte weight<br />
did no longer increase significantly was 2% (Figure 8-7) and the mean oocyte weight was<br />
3.82 mg (± 1.13 SD, N= 29).<br />
43
% ripe females<br />
80<br />
70<br />
60<br />
50<br />
40<br />
30<br />
20<br />
10<br />
0<br />
a<br />
Jun-98<br />
Jul-98<br />
Aug-98<br />
Sep-98<br />
Oct-98<br />
Nov-98<br />
Dec-98<br />
Jan-99<br />
Feb-99<br />
Mar-99<br />
Apr-99<br />
May-99<br />
32 10 27 29 44 14 36 81 122 43 58<br />
% males in breeding colour<br />
100<br />
90<br />
80<br />
70<br />
60<br />
50<br />
40<br />
30<br />
20<br />
10<br />
0<br />
b<br />
Jun-98<br />
Jul-98<br />
Aug-98<br />
Sep-98<br />
Oct-98<br />
Nov-98<br />
Dec-98<br />
Jan-99<br />
Feb-99<br />
Mar-99<br />
Apr-99<br />
May-99<br />
43 60 27 57 48 20 62 120 171 67 106<br />
Figure 8-3. Seasonal progression <strong>of</strong> the percentage <strong>of</strong> ripe (stages 4 and 5) females (a) and<br />
males (b) Aulonocara 'minutus' in the SWA <strong>The</strong> values below the x-axis are the effective<br />
(number <strong>of</strong> male or females which size was above the size at maturity) for each month.<br />
100<br />
% mature females<br />
50<br />
0<br />
22 27 32 37 42 47 52 57 62 67<br />
Standard length (mm)<br />
Figure 8-4. Percentage <strong>of</strong> mature females (stage 3 and above) per size class (standard length)<br />
for Aulonocara 'minutus' in the SWA.<br />
44
Weight (g)<br />
7<br />
6 y = 2E-05x 3,0763<br />
5 R 2 = 0,8435<br />
4<br />
3<br />
2<br />
1<br />
0<br />
20 30 40 50 60 70<br />
Length (mm)<br />
Figure 8-5. Length-weight relationship for Aulonocara 'minutus' females in the SWA. (R² =<br />
determination coefficient).<br />
30<br />
Fecundity<br />
25<br />
20<br />
15<br />
10<br />
5<br />
0<br />
y = 2,3366x + 10,738<br />
R 2 = 0,0679<br />
1 2 3 4<br />
Weight (g)<br />
Figure 8-6. Fecundity-weight relationship for Aulonocara 'minutus' females in the SWA. (R²<br />
= determination coefficient).<br />
Oocyte weight (mg)<br />
8<br />
7<br />
6<br />
5<br />
4<br />
3<br />
2<br />
1<br />
0<br />
y = 0,3653x + 2,6722<br />
R 2 = 0,1232<br />
0,0 1,0 2,0 3,0 4,0 5,0 6,0<br />
GSI (%)<br />
Figure 8-7. Relationship between oocyte weight and gonado-somatic index (GSI) for<br />
Aulonocara 'minutus'. Oocytes from females whose GSI was below (in grey) and above (in<br />
black with regression) 2%. (R² = determination coefficient).<br />
45
Depth (m)<br />
125<br />
100<br />
Number<br />
Weight<br />
75<br />
0,0 0,5 1,0 1,5<br />
Overall mean catches (%)<br />
Figure 9-1. Mean occurrence and abundance in the catches per depth <strong>of</strong> Aulonocara<br />
'rostratum deep' in the SWA between July 1998 and May 1999.<br />
Frequency %<br />
20<br />
18<br />
16<br />
14<br />
12<br />
10<br />
8<br />
6<br />
4<br />
2<br />
0<br />
62 67 72 77 82 87 92 97 102 107 112 117 122 127 132 137<br />
Standard length (mm)<br />
Figure 9-2. Size range and frequencies <strong>of</strong> Aulonocara 'rostratum deep' caught in the SWA<br />
between July 1998 and May 1999.<br />
46
Aulonocara 'rostratum deep'<br />
56 females and 57 males were analysed. A. 'rostratum deep' is a relatively rare <strong>fish</strong><br />
found from 75 to 125 m depth but more frequent at 125 m (Figure 9-1). <strong>The</strong> mean CPUE per<br />
depth category was 1.7 kg in the deep zone and 0.5 kg in the very deep zone, which is about<br />
ten times less than the values <strong>report</strong>ed in Tómasson & Banda (1996) for the deep zone (5.1<br />
kg), and more than twenty times less in the very deep zone (13.2 kg). As for A. 'cf. macrochir'<br />
and A. 'blue orange' and A. 'minutus', the depth distribution we found was much more<br />
restricted than that observed by Tómasson & Banda (1996), who found A. 'rostratum deep'<br />
from 30 to 130 m. Specimens caught ranged between 60 and 140 mm with a mode from 80 to<br />
105 mm (Figure 9-2). <strong>The</strong> sex ratio observed over the full sampling period was F/M 0.5/0.5.<br />
As A. 'rostratum deep' is a rare species, the following information about life history<br />
traits is based on low sample size and can not be considered as very reliable but rather as<br />
indicative. A breeding activity was observed in October, March and May (Figure 9-3a and b).<br />
From the few data available, ripe females and males in breeding colour were evenly<br />
distributed among depths. Maturity was reached at about 75 mm (Figure 9-4).<br />
<strong>The</strong> length-weight and fecundity-weight relationships are given in Figure 9-5 and 9-6,<br />
respectively. Fecundity ranged from 41 to 167 for females weighing between 14 and 69 g.<br />
<strong>The</strong> mean oocyte weight was impossible to assess from the few data available on this species.<br />
47
50<br />
% ripe females<br />
40<br />
30<br />
20<br />
10<br />
0<br />
a<br />
Oct-98<br />
Nov-98<br />
Dec-98<br />
Jan-99<br />
Feb-99<br />
Mar-99<br />
Apr-99<br />
May-99<br />
17 2 4 20 4 9<br />
% males in breeding colour<br />
b<br />
100<br />
90<br />
80<br />
70<br />
60<br />
50<br />
40<br />
30<br />
20<br />
10<br />
0<br />
Jul-98<br />
Aug-98<br />
Sep-98<br />
Oct-98<br />
Nov-98<br />
Dec-98<br />
Jan-99<br />
Feb-99<br />
Mar-99<br />
Apr-99<br />
May-99<br />
1 24 3 11 9 7 2<br />
Figure 9-3. Seasonal progression <strong>of</strong> the percentage <strong>of</strong> ripe (stages 4 and 5) females (a) and<br />
males (b) Aulonocara 'rostratum deep' in the SWA <strong>The</strong> values below the x-axis are the<br />
effective (number <strong>of</strong> male or females which size was above the size at maturity) for each<br />
month.<br />
100<br />
% mature females<br />
50<br />
0<br />
62 67 72 77 82 87 92 97 102 107 112 117 122 127<br />
Standard length (mm)<br />
Figure 9-4. Percentage <strong>of</strong> mature females (stage 3 and above) per size class (standard length)<br />
for Aulonocara 'rostratum deep' in the SWA.<br />
48
Weight (g)<br />
80<br />
70<br />
60<br />
50<br />
40<br />
30<br />
20<br />
10<br />
0<br />
y = 1E-05x 3,2358<br />
R 2 = 0,9925<br />
50 70 90 110 130 150<br />
Length (mm)<br />
Figure 9-5. Length-weight relationship for Aulonocara 'rostratum deep' females in the SWA.<br />
(R² = determination coefficient).<br />
Fecundity<br />
180<br />
160<br />
140<br />
120<br />
100<br />
80<br />
60<br />
40<br />
20<br />
0<br />
y = 2,3872x + 1,3981<br />
R 2 = 0,9789<br />
0 20 40 60 80<br />
Weight (g)<br />
Figure 9-6. Fecundity-weight relationship for Aulonocara 'rostratum deep' females in the<br />
SWA. (R² = determination coefficient).<br />
49
Plate 6. Buccochromis lepturus (by Dave Voorvelt).<br />
30<br />
Number<br />
Weight<br />
Dpth (m)<br />
10<br />
0 2 4 6<br />
Overall mean catches (%)<br />
Figure 10-1. Mean occurrence and abundance in the catches per depth <strong>of</strong> Buccochromis<br />
lepturus in the SWA between July 1998 and May 1999.<br />
Frequency %<br />
10<br />
9<br />
8<br />
7<br />
6<br />
5<br />
4<br />
3<br />
2<br />
1<br />
0<br />
65 75 85 95 105 115 125 135 145 155 165 175 185 195 205 215 225 235 245 255 265 275 285 295 305 315 325<br />
Standard length (mm)<br />
Figure 10-2. Size range and frequencies <strong>of</strong> Buccochromis lepturus caught in the SWA<br />
between July 1998 and May 1999.<br />
50
Buccochromis spp.<br />
Buccochromis lepturus (Regan) (Plate 6)<br />
74 females and 58 males were analysed. B. lepturus is a large shallow water <strong>fish</strong><br />
essentially encountered at 10 m, where it constituted 4.5% <strong>of</strong> the catches in weight but only<br />
0.5% in number owing to its large size (Figure 10-1). It was also found sometimes at 30 m.<br />
<strong>The</strong> mean CPUE per depth category was 6.5 kg in the shallow zone, which approximately<br />
matched the values <strong>report</strong>ed in Tómasson & Banda (1996) (7.4 kg). <strong>The</strong> depth distribution<br />
observed in our study was more restricted than that <strong>of</strong> Tómasson & Banda (1996), who found<br />
B. lepturus down to 50m. Specimens caught ranged between 60 and 330 mm (Figure 10-2).<br />
<strong>The</strong> sex ratio observed over the full sampling period was F/M 0.6/0.4.<br />
B. lepturus being an abundant species, the number <strong>of</strong> specimen caught at each<br />
sampling session was very low, which severely hampered the precise determination <strong>of</strong><br />
breeding season and other life history traits. From the few data available, it seems that<br />
breeding season might occur between March-April and August (Figure 10-3a and b). <strong>The</strong> few<br />
ripe females or males in breeding colour were mostly found at 10 m, suggesting a rather<br />
shallow spawning. Maturity was reached at about 160 mm for females (Figure 10-4).<br />
<strong>The</strong> length-weight and fecundity-weight relationships are given in Figure 10-5 and 10-<br />
6, respectively. Fecundity ranged from 267 to 627 for females weighing between 294 and 588<br />
g. No relation was found between oocyte weight and body weight. <strong>The</strong> GSI threshold above<br />
which the oocyte weight did no longer increase significantly was difficult to assess due to low<br />
sample size but was tentatively fixed at about 2% (Figure 10-7). <strong>The</strong> mean oocyte weight was<br />
19.99 mg (± 1.88 SD, N= 4).<br />
51
60<br />
% ripe females<br />
a<br />
% males in breeding colour<br />
b<br />
50<br />
40<br />
30<br />
20<br />
10<br />
0<br />
100<br />
80<br />
60<br />
40<br />
20<br />
0<br />
Jun-98<br />
Jul-98<br />
Aug-98<br />
Sep-98<br />
Oct-98<br />
Nov-98<br />
Dec-98<br />
Jan-99<br />
Feb-99<br />
Mar-99<br />
Apr-99<br />
May-99<br />
5 7 8 15 7 1 4 5 2 20<br />
Jun-98<br />
Jul-98<br />
Aug-98<br />
Sep-98<br />
Oct-98<br />
Nov-98<br />
Dec-98<br />
Jan-99<br />
Feb-99<br />
Mar-99<br />
Apr-99<br />
May-99<br />
5 8 2 10 2 2 8 21<br />
Figure 10-3. Seasonal progression <strong>of</strong> the percentage <strong>of</strong> ripe (stages 4 and 5) females (a) and<br />
males (b) Buccochromis lepturus in the SWA <strong>The</strong> values below the x-axis are the effective<br />
(number <strong>of</strong> male or females which size was above the size at maturity) for each month.<br />
100<br />
% mature females<br />
50<br />
0<br />
75 85 95 105 115 125 135 145 155 165 175 185 195 205 215 225 235<br />
Standard length (mm)<br />
Figure 10-4. Percentage <strong>of</strong> mature females (stage 3 and above) per size class (standard length)<br />
for Buccochromis lepturus in the SWA.<br />
52
Weight (g)<br />
700<br />
600<br />
500<br />
400<br />
300<br />
200<br />
y = 3E-06x 3,3761<br />
100<br />
R 2 = 0,988<br />
0<br />
150 200 250 300<br />
Length (mm)<br />
Figure 10-5. Length-weight relationship for Buccochromis lepturus females in the SWA. (R²<br />
= determination coefficient).<br />
Fecundity<br />
700<br />
600<br />
500<br />
400<br />
300<br />
200<br />
100<br />
y = 0,9143x + 22,481<br />
R 2 = 0,7403<br />
0<br />
250 300 350 400 450 500 550 600 650<br />
Weight (g)<br />
Figure 10-6. Fecundity-weight relationship for Buccochromis lepturus females in the SWA.<br />
(R² = determination coefficient).<br />
25<br />
Oocyte weight (mg)<br />
20<br />
15<br />
10<br />
5<br />
y = 1,4963x + 16<br />
R 2 = 0,108<br />
0<br />
0,5 1,0 1,5 2,0 2,5 3,0 3,5<br />
GSI (%)<br />
Figure 10-7. Relationship between oocyte weight and gonado-somatic index (GSI) for<br />
Buccochromis lepturus. Oocytes from females whose GSI was below (in grey) and above<br />
(in black with regression) 2%. (R² = determination coefficient).<br />
53
50<br />
Depth (m)<br />
30<br />
10<br />
Number<br />
Weight<br />
0 1 2 3 4<br />
Overall mean catches (%)<br />
Figure 11-1. Mean occurrence and abundance in the catches per depth <strong>of</strong> Buccochromis<br />
nototaenia in the SWA between July 1998 and May 1999.<br />
Frequency %<br />
18<br />
16<br />
14<br />
12<br />
10<br />
8<br />
6<br />
4<br />
2<br />
0<br />
55 65 75 85 95 105 115 125 135 145 155 165 175 185 195 205 215 225 235 245 255 265 275 285 295<br />
Size class (mm)<br />
Figure 11-2. Size range and frequencies <strong>of</strong> Buccochromis nototaenia caught in the SWA<br />
between July 1998 and May 1999.<br />
54
Buccochromis nototaenia (Boulenger)<br />
122 females and 182 males were analysed. B. nototaenia is a large shallow water <strong>fish</strong><br />
found between 10 and 50 m (Figure 11-1). It was more frequently encountered at 30 m, where<br />
it constituted about 2% <strong>of</strong> the catches in weight and 0.5% in number. <strong>The</strong> mean CPUE per<br />
depth category was 5.1 kg in the shallow zone, which was a bit more than the value <strong>report</strong>ed<br />
in Tómasson & Banda (1996) (3.9 kg). <strong>The</strong> depth distribution observed in our study matched<br />
that <strong>of</strong> Tómasson & Banda (1996). Specimens caught ranged between 50 and 300 mm (Figure<br />
11-2). <strong>The</strong> sex ratio observed over the full sampling period was F/M 0.4/0.6.<br />
As for B. lepturus, the low sample size hampered the precise determination <strong>of</strong><br />
breeding season and other life history traits. All that can be said from females (Figure 11-3a)<br />
and males (Figure 11-3b) data is that we observed a breeding activity in April, July and<br />
August. However, it seems a weird behaviour for a <strong>Malawi</strong> cichlid to start breeding for one<br />
month then stop for two months and beginning again for two others months. Although there<br />
was no data to support it, it can be hypothesised that breeding season might occur between<br />
April and August as for B. lepturus. About 70% <strong>of</strong> the ripe females and males in breeding<br />
colour and 84% <strong>of</strong> the immature individuals were sampled at 30 m, suggesting that spawning<br />
could occur at this depth (Table 11-1). <strong>The</strong> plot <strong>of</strong> the percentage <strong>of</strong> ripe females against<br />
standard length did not give a proper sigmoïd curve (Figure 11-4). Size at maturity has to be<br />
determined at the height <strong>of</strong> the breeding season to be accurate but owing to the low sample<br />
size we had to consider all data available. As a consequence, females caught outside the<br />
breeding season were included in the analyses, even large resting females, which may explain<br />
the shape <strong>of</strong> the upper part <strong>of</strong> the curve. Nevertheless, small sized females are more<br />
informative than large ones and the size range between 100 mm and 130 mm was supported<br />
by the higher sample size (55 females), giving a relative "power" to this part <strong>of</strong> the curve.<br />
From the data available it can be estimated that maturity was reached around 115 mm for<br />
females. Maturity appears at a smaller size than anticipated given the large maximum<br />
observed length for this species and compared to B. lepturus.<br />
Table 11-1. Percentage <strong>of</strong> ripe females (stages 4 and 5), males in breeding colour and<br />
immature individuals (whose size is below the size at maturity) per depth for<br />
Buccochromis nototaenia in the SWA.<br />
Depth<br />
Non ripe<br />
females<br />
Ripe females<br />
Males not in<br />
breeding colour<br />
Males in breeding<br />
colour<br />
Immature<br />
specimens<br />
10 m 20.9 28.6 17.6 16.7 14.6<br />
30 m 79.1 71.4 80 66.7 84.4<br />
50 m 2.4 16.7 1<br />
<strong>The</strong> length-weight and fecundity-weight relationships are given in Figure 11-5 and 11-<br />
6, respectively. Fecundity ranged from 100 to 315 for females weighing between 40 and 250<br />
g. No relation was found between oocyte weight and body weight. <strong>The</strong> GSI threshold above<br />
which the oocyte weight did no longer increase significantly was difficult to assess due to low<br />
sample size but was tentatively fixed at about 2% (Figure 11-7). <strong>The</strong> mean oocyte weight was<br />
11.70 mg (± 3.63 SD, N= 3).<br />
55
% ripe females<br />
20<br />
18<br />
16<br />
14<br />
12<br />
10<br />
8<br />
6<br />
4<br />
2<br />
0<br />
a<br />
% males in breeding colour<br />
b<br />
35<br />
30<br />
25<br />
20<br />
15<br />
10<br />
5<br />
0<br />
Jun-98<br />
Jul-98<br />
Aug-98<br />
Sep-98<br />
Oct-98<br />
Nov-98<br />
Dec-98<br />
Jan-99<br />
Feb-99<br />
Mar-99<br />
Apr-99<br />
May-99<br />
10 22 12 13 6 2 16 8 8 8 17<br />
Jun-98<br />
Jul-98<br />
Aug-98<br />
Sep-98<br />
Oct-98<br />
Nov-98<br />
Dec-98<br />
Jan-99<br />
Feb-99<br />
Mar-99<br />
Apr-99<br />
May-99<br />
8 16 5 10 7 3 15 1 6 3 17<br />
Figure 11-3. Seasonal progression <strong>of</strong> the percentage <strong>of</strong> ripe (stages 4 and 5) females (a) and<br />
males (b) Buccochromis nototaenia in the SWA <strong>The</strong> values below the x-axis are the<br />
effective (number <strong>of</strong> male or females which size was above the size at maturity) for each<br />
month.<br />
100<br />
% mature females<br />
50<br />
0<br />
55 65 75 85 95 105 115 125 135 145 155 165 175 185 195 205 215 225<br />
Standard length (mm)<br />
Figure 11-4. Percentage <strong>of</strong> mature females (stage 3 and above) per size class (standard length)<br />
for Buccochromis nototaenia in the SWA.<br />
56
Weight (g)<br />
300<br />
250<br />
200<br />
150<br />
100<br />
y = 5E-06x 3,3608<br />
50<br />
R 2 = 0,98<br />
0<br />
100 120 140 160 180 200<br />
Length (mm)<br />
Figure 11-5. Length-weight relationship for Buccochromis nototaenia females in the SWA.<br />
(R² = determination coefficient).<br />
Fecundity<br />
350<br />
300<br />
250<br />
200<br />
150<br />
100<br />
50<br />
0<br />
y = 0,8115x + 96,468<br />
R 2 = 0,8738<br />
0 50 100 150 200 250 300<br />
Weight (g)<br />
Figure 11-6. Fecundity-weight relationship for Buccochromis nototaenia females in the SWA.<br />
(R² = determination coefficient).<br />
20<br />
Oocyte weight (mg)<br />
15<br />
10<br />
5<br />
0<br />
1,0 1,5 2,0 2,5 3,0<br />
GSI (%)<br />
Figure 11-7. Relationship between oocyte weight and gonado-somatic index (GSI) for<br />
Buccochromis nototaenia. Oocytes from females whose GSI was below (in grey) and<br />
above (in black with regression) 2%. (R² = determination coefficient).<br />
57
Overall mean catches (%)<br />
0,0 0,5 1,0 1,5 2,0 2,5<br />
10<br />
Depth (m)<br />
30<br />
50<br />
75<br />
Weight<br />
Number<br />
Figure 12-1. Mean occurrence and abundance in the catches per depth <strong>of</strong> Copadichromis<br />
quadrimaculatus in the SWA between July 1998 and May 1999.<br />
Frequency %<br />
35<br />
30<br />
25<br />
20<br />
15<br />
10<br />
5<br />
0<br />
55 65 75 85 95 105 115 125 135 145<br />
Standard length (mm)<br />
Figure 12-2. Size range and frequencies <strong>of</strong> Copadichromis quadrimaculatus caught in the<br />
SWA between July 1998 and May 1999.<br />
58
Copadichromis spp.<br />
Copadichromis quadrimaculatus (Regan)<br />
132 females and 214 males were analysed. C. quadrimaculatus was caught from 10 to<br />
75 m but occurred more frequently at 30 m, where it constituted 2% and 1.5% <strong>of</strong> the catches,<br />
in weight and number, respectively (Figure 12-1). <strong>The</strong> mean CPUE per depth category was<br />
6.9 kg in the shallow zone and 0.15 kg in the deep zone, which was about three times less<br />
than the value <strong>report</strong>ed in Tómasson & Banda (1996) for the shallow zone (3.9 kg). <strong>The</strong> depth<br />
distribution observed in our study was much more restricted than that <strong>of</strong> Tómasson & Banda<br />
(1996), who <strong>report</strong>ed C. quadrimaculatus from 8 to 135 m. Specimens caught ranged between<br />
50 and 150 mm (Figure 12-2). <strong>The</strong> sex ratio observed over the full sampling period was F/M<br />
0.4/0.6.<br />
<strong>The</strong> low sample size hampered the precise determination <strong>of</strong> breeding season and other<br />
life history traits. From data available about females (Figure 13-3a) and males (Figure 12-3b),<br />
it can be estimated that breeding season occurs from April to October. Taking into account the<br />
very low sample size <strong>of</strong> females in February-March and data from males, breeding season<br />
might actually start in February-March. This corresponds quite well with the % <strong>of</strong> active<br />
females observed in open waters during the SADC/ODA Project (Thompson et al. 1995,<br />
1996). Most ripe females, males in breeding colour and immature individuals were found at<br />
30 m, suggesting that spawning could occur at this depth (Table 12-1). <strong>The</strong> percentage <strong>of</strong><br />
mature females (stage 3 and above) per size class is presented in Figure 12-4. No female was<br />
caught in the size range where maturity occurred. <strong>The</strong> 50% <strong>of</strong> mature females observed in the<br />
size range 80-90 mm was based on 2 females only and is probably overestimated. However,<br />
the second part <strong>of</strong> the curve from 120 mm upwards was based on consistent sample size and it<br />
can be reasonably estimated that maturity was reached around 100 mm, which was much less<br />
than the 15 cm TL (about 120 mm SL) <strong>report</strong>ed for the same species in the open waters<br />
(Thompson et al. 1995, 1996). This corresponded to a mean age at maturity <strong>of</strong> 20 months.<br />
Table 12-1. Percentage <strong>of</strong> ripe females (stages 4 and 5), males in breeding colour and<br />
immature individuals (whose size is below the size at maturity) per depth for<br />
Buccochromis nototaenia in the SWA.<br />
Depth<br />
Non ripe<br />
females<br />
Ripe females<br />
Males not in<br />
breeding colour<br />
Males in breeding<br />
colour<br />
Immature<br />
specimens<br />
10 m 29.3 20 2 37.6 1.4<br />
30 52.4 50 75.5 57 76.8<br />
50 m 14.6 25 22.4 5.5 21.7<br />
75 m 3.7 5<br />
<strong>The</strong> length-weight and fecundity-weight relationships are given in Figure 12-5 and 12-<br />
6, respectively. Fecundity ranged from 15 to 62 for females weighing between 53 and 75 g.<br />
Using the length-weight and fecundity weight relationships, and assuming a 2 to 3 cm<br />
difference between standard and total length for a size range <strong>of</strong> 17 to 20 cm TL, the mean<br />
fecundity (50 eggs for females between 17 and 20cm TL) found by Thompson et al. (1996)<br />
corresponded with the fecundity we got for females <strong>of</strong> similar size. No relation was found<br />
between oocyte weight and body weight. <strong>The</strong> GSI threshold above which the oocyte weight<br />
59
60<br />
% ripe females<br />
a<br />
50<br />
40<br />
30<br />
20<br />
10<br />
0<br />
Jun-98<br />
Jul-98<br />
Aug-98<br />
Sep-98<br />
Oct-98<br />
Nov-98<br />
Dec-98<br />
Jan-99<br />
Feb-99<br />
Mar-99<br />
Apr-99<br />
May-99<br />
1 52 20 5 5 1 1 13 4<br />
% males in breeding colour<br />
b<br />
100<br />
90<br />
80<br />
70<br />
60<br />
50<br />
40<br />
30<br />
20<br />
10<br />
0<br />
Jun-98<br />
Jul-98<br />
Aug-98<br />
Sep-98<br />
Oct-98<br />
Nov-98<br />
Dec-98<br />
Jan-99<br />
Feb-99<br />
Mar-99<br />
Apr-99<br />
May-99<br />
38 68 63 12 1 15 2 7 7 1<br />
Figure 12-3. Seasonal progression <strong>of</strong> the percentage <strong>of</strong> ripe (stages 4 and 5) females (a) and<br />
males (b) Copadichromis quadrimaculatus in the SWA <strong>The</strong> values below the x-axis are the<br />
effective (number <strong>of</strong> male or females which size was above the size at maturity) for each<br />
month.<br />
100<br />
% mature females<br />
50<br />
0<br />
65 75 85 95 105 115 125 135 145<br />
Standard length (mm)<br />
Figure 12-4. Percentage <strong>of</strong> mature females (stage 3 and above) per size class (standard length)<br />
for Copadichromis quadrimaculatus in the SWA.<br />
60
Weight (g)<br />
80<br />
70<br />
60<br />
50<br />
40<br />
30<br />
20<br />
10<br />
0<br />
y = 0,001x 2,2537<br />
R 2 = 0,6119<br />
110 115 120 125 130 135 140 145 150<br />
Length (mm)<br />
Figure 12-5. Length-weight relationship for Copadichromis quadrimaculatus females in the<br />
SWA. (R² = determination coefficient).<br />
Fecundity<br />
70<br />
60<br />
50<br />
40<br />
30<br />
20<br />
10<br />
y = 0,684x - 0,8577<br />
R 2 = 0,2695<br />
0<br />
40 45 50 55 60 65 70 75 80<br />
Weight (g)<br />
Figure 12-6. Fecundity-weight relationship for Copadichromis quadrimaculatus females in<br />
the SWA. (R² = determination coefficient).<br />
60<br />
Oocyte weight (mg)<br />
50<br />
40<br />
30<br />
20<br />
10<br />
y = 2,3888x + 33,841<br />
R 2 = 0,0048<br />
0<br />
1,0 1,5 2,0 2,5 3,0 3,5 4,0<br />
GSI (%)<br />
Figure 12-7. Relationship between oocyte weight and gonado-somatic index (GSI) for<br />
Copadichromis quadrimaculatus. Oocytes from females whose GSI was below (in grey)<br />
and above (in black with regression) 3%. (R² = determination coefficient).<br />
61
Plate 7. Copadichromis virginalis (by Dave Voorvelt).<br />
% ripe females<br />
a<br />
% males in breeding colour<br />
b<br />
50<br />
45<br />
40<br />
35<br />
30<br />
25<br />
20<br />
15<br />
10<br />
5<br />
0<br />
100<br />
90<br />
80<br />
70<br />
60<br />
50<br />
40<br />
30<br />
20<br />
10<br />
-<br />
Jun-98<br />
Jul-98<br />
Aug-98<br />
Sep-98<br />
Oct-98<br />
Nov-98<br />
Dec-98<br />
Jan-99<br />
Feb-99<br />
Mar-99<br />
Apr-99<br />
May-99<br />
129 266 198 57 696 292 417 340 3 201 298<br />
Jun-98<br />
Jul-98<br />
Aug-98<br />
Sep-98<br />
Oct-98<br />
Nov-98<br />
Dec-98<br />
Jan-99<br />
Feb-99<br />
Mar-99<br />
Apr-99<br />
May-99<br />
18 263 86 30 633 330 231 158 246 114 828<br />
Figure 13-3. Seasonal progression <strong>of</strong> the percentage <strong>of</strong> ripe (stages 4 and 5) females (a) and<br />
males (b) Copadichromis virginalis in the SWA <strong>The</strong> values below the x-axis are the<br />
effective (number <strong>of</strong> male or females which size was above the size at maturity) for each<br />
month.<br />
62
did no longer increase significantly was 3% (Figure 12-7). <strong>The</strong> mean oocyte weight was 42.05<br />
mg (± 6.96 SD, N= 8).<br />
Copadichromis virginalis (Iles) (Plate 7)<br />
2886 females and 3052 males were analysed. C. virginalis was encountered from 10 m<br />
to 50 m and rarely at 100 m (Figure 13-1).<br />
Overall mean catches (%)<br />
0 10 20 30 40<br />
Depth (m)<br />
10<br />
30<br />
50<br />
Weight<br />
Number<br />
100<br />
Figure 13-1. Mean occurrence and abundance in the catches per depth <strong>of</strong> Copadichromis<br />
virginalis in the SWA between July 1998 and May 1999.<br />
It was one <strong>of</strong> the most abundant species in shallow water, where it constituted about 10% and<br />
30% (both in weight and number) <strong>of</strong> the catches at 30 and 50 m, respectively. <strong>The</strong> mean<br />
CPUE per depth category was 97.7 kg in the shallow zone and 0.15 kg in the deep zone,<br />
which matched the value <strong>report</strong>ed in Tómasson & Banda (1996) for the shallow zone (108.8<br />
kg). As for C. quadrimaculatus the depth distribution observed in our study was a bit more<br />
restricted than that <strong>of</strong> Tómasson & Banda (1996), who <strong>report</strong>ed C. virginalis from 8 to 120 m.<br />
Specimens caught ranged between 45 and 125 mm (Figure 13-2).<br />
25<br />
20<br />
Frequency %<br />
15<br />
10<br />
5<br />
0<br />
47 52 57 62 67 72 77 82 87 92 97 102 107 112 117 122<br />
Standard length (mm)<br />
Figure 13-2. Size range and frequencies <strong>of</strong> Copadichromis virginalis caught in the SWA<br />
between July 1998 and May 1999.<br />
63
% ripe females<br />
40<br />
35<br />
30<br />
25<br />
20<br />
15<br />
10<br />
5<br />
% ripe females<br />
Fluorescence<br />
Temperature<br />
9<br />
8<br />
7<br />
6<br />
5<br />
4<br />
3<br />
2<br />
1<br />
Fluorescence index<br />
Temperature (-20°C)<br />
0<br />
0<br />
Jun-98<br />
Jul-98<br />
Aug-98<br />
Sep-98<br />
Oct-98<br />
Nov-98<br />
Dec-98<br />
Jan-99<br />
Feb-99<br />
Mar-99<br />
Apr-99<br />
May-99<br />
Figure 13-4. Monthly percentage <strong>of</strong> ripe females in relation with temperature (= temperature<br />
minus 20°C to fit the axis scale) and fluorescence, used as an index <strong>of</strong> chlorophyll a<br />
concentration.<br />
100<br />
% mature females<br />
50<br />
0<br />
45 55 65 75 85 95 105 115<br />
Standard length (mm)<br />
Figure 13-5. Percentage <strong>of</strong> mature females (stage 3 and above) per size class (standard length)<br />
for Copadichromis virginalis in the SWA.<br />
64
Weight (g)<br />
45<br />
40<br />
35<br />
30<br />
25<br />
20<br />
15<br />
10<br />
5<br />
y = 4E-05x 2,9091<br />
R 2 = 0,8956<br />
0<br />
40 60 80 100 120 140<br />
Length (mm)<br />
Figure 13-6. Length-weight relationship for Copadichromis virginalis females in the SWA.<br />
(R² = determination coefficient).<br />
Fecundity<br />
70<br />
60<br />
50<br />
40<br />
30<br />
20<br />
10<br />
y = 0,4697x + 18,163<br />
R 2 = 0,0749<br />
0<br />
0 5 10 15 20 25 30 35 40<br />
Weight (g)<br />
Figure 13-7. Fecundity-weight relationship for Copadichromis virginalis females in the SWA.<br />
(R² = determination coefficient).<br />
Oocyte weight (mg)<br />
45<br />
40<br />
35<br />
y = -1,7669x + 25,142<br />
R 2 = 0,023<br />
30<br />
25<br />
20<br />
15<br />
10<br />
5<br />
0<br />
1,0 2,0 3,0 4,0 5,0 6,0<br />
GSI (%)<br />
Figure 13-8. Relationship between oocyte weight and gonado-somatic index (GSI) for<br />
Copadichromis virginalis. Oocytes from females whose GSI was below (in grey) and<br />
above (in black with regression) 3%. (R² = determination coefficient).<br />
65
<strong>The</strong> sex ratio observed over the full sampling period was F/M 0.5/0.5.<br />
C. virginalis was found to breed throughout the year (Figure 13-3a and b) with two<br />
peaks <strong>of</strong> activity, a punctual one in December and another one from May to July (Figure 13-<br />
3a). This figure markedly differed from Iles's (1971) observations who <strong>report</strong>ed a very<br />
restricted breeding season (March to May) in the region <strong>of</strong> Nkata Bay. <strong>The</strong> percentage <strong>of</strong> ripe<br />
females seemed inversely related to water temperature (Figure 13-4), being higher during the<br />
cold water season (windy season) from April-May to August, and directly related to the<br />
chlorophyll a concentration. As C. virginalis is a zooplankton feeder (Iles 1960, 1971, Turner<br />
1996, present study see chapter "Diet"), most <strong>of</strong> the sexual activity occurred during windy<br />
season when the water column was mixed up and the rich cold upwelling increased the<br />
phytoplankton production and consequently the zooplankton abundance. <strong>The</strong> punctual peak <strong>of</strong><br />
sexual activity observed in December 1998 corresponded with a drop <strong>of</strong> temperature <strong>of</strong> about<br />
3°C, an associated increased concentration in chlorophyll a and then an increased zooplankton<br />
availability. More than 70% <strong>of</strong> the ripe females and males in breeding colour were found at 50<br />
m (Table 13-1) and the rest at 30 m, suggesting that spawning could occur mostly at 50 m and<br />
in a lesser extent at 30 m. Maturity was reached in their first year at 12 months old at a mean<br />
size <strong>of</strong> 75 mm for females (Figure 13-5).<br />
Table 13-1. Percentage <strong>of</strong> ripe females (stages 4 and 5), males in breeding colour and<br />
immature individuals (whose size is below the size at maturity) per depth for<br />
Copadichromis virginalis in the SWA.<br />
Depth<br />
Non ripe<br />
females<br />
Ripe females<br />
Males not in<br />
breeding colour<br />
Males in breeding<br />
colour<br />
Immature<br />
specimens<br />
10 m 0.3 0.5 1.7 0.3 4.8<br />
30 17.8 26.2 24.8 7.7 25.2<br />
50 m 81.9 73.1 73.3 92 69.4<br />
100 m 0 0.2 0.1 0 0.6<br />
<strong>The</strong> length-weight and fecundity-weight relationships are given in Figure 13-6 and 13-<br />
7, respectively. Fecundity ranged from 9 to 59 for females weighing between 10 and 36 g and<br />
was not correlated to body weight. No relation was found between oocyte weight and body<br />
weight. <strong>The</strong> GSI threshold above which the oocyte weight did no longer increase significantly<br />
was 3% (Figure 13-8). <strong>The</strong> mean oocyte weight was 18.93 mg (± 5.90 SD, N= 76).<br />
66
Overall mean catches (%)<br />
0 2 4 6 8<br />
Depth (m)<br />
75<br />
100<br />
Weight<br />
Number<br />
125<br />
Figure 14-1. Mean occurrence and abundance in the catches per depth <strong>of</strong> Diplotaxodon<br />
apogon in the SWA between July 1998 and May 1999.<br />
Frequeny %<br />
18<br />
16<br />
14<br />
12<br />
10<br />
8<br />
6<br />
4<br />
2<br />
0<br />
32 37 42 47 52 57 62 67 72 77 82 87 92 97 102 107 112 117 122 127<br />
Standard length (mm)<br />
Figure 14-2. Size range and frequencies <strong>of</strong> Diplotaxodon apogon caught in the SWA between<br />
July 1998 and May 1999.<br />
67
Diplotaxodon and Pallidochromis spp.<br />
Pallidochromis tokolosh (Turner) is the only species <strong>of</strong> this genus. Despite its<br />
anatomical distinctness that separates it from Diplotaxodon, recent molecular evidence<br />
suggested that this species is a member <strong>of</strong> the Diplotaxodon clade (Turner et al. 1999). It will<br />
then be presented together with the Diplotaxodon spp..<br />
Diplotaxodon apogon (Turner & Stauffer)<br />
616 females and 729 males were analysed. D. apogon was found from 75 to 125 m,<br />
where it constituted between 3 and 4% <strong>of</strong> the catches in weight and 4 to 6% in number<br />
(Figure 14-1). <strong>The</strong> mean CPUE per depth category was 15.6 kg in the deep zone and 6 kg in<br />
the very deep zone. <strong>The</strong>re was no record for this species in Tómasson & Banda (1996).<br />
Specimens caught ranged between 33 and 130 mm with a mode from 75 to 105 mm (Figure<br />
14-2). <strong>The</strong> sex ratio observed over the full sampling period was F/M 0.5/0.5.<br />
Breeding activity was detected in August 98 and from November 98 to April 99 for<br />
females (Figure 14-3a) whereas more than 60% <strong>of</strong> males in breeding colour were found at<br />
every sampled month (Figure 14-3b). Despite the very high percentage <strong>of</strong> males in breeding<br />
colour throughout the year, female data suggested a bimodal breeding season with a major<br />
peak from November to March and a smaller one around August. More than 60% <strong>of</strong> the ripe<br />
females were found at 100m (Table 14-1). More than 80 % <strong>of</strong> the males in breeding colour<br />
were evenly distributed at 75 and 125 m, but aggregations <strong>of</strong> such breeding males (50 to 90<br />
individuals) were found at all three depths. No particular indication about spawning depth was<br />
drawn from these results. Maturity was reached in their second year at 21 months old at a<br />
mean size <strong>of</strong> 88 mm for females (Figure 14-4).<br />
Table 14-1. Percentage <strong>of</strong> ripe females (stages 4 and 5), males in breeding colour and<br />
immature individuals (whose size is below the size at maturity) per depth for Diplotaxodon<br />
apogon in the SWA.<br />
Depth<br />
Non ripe<br />
females<br />
Ripe females<br />
Males not in<br />
breeding colour<br />
Males in breeding<br />
colour<br />
Immature<br />
specimens<br />
75 m 27.4 14.1 5.8 40.3 13.3<br />
100 m 43.3 62.5 79.5 16.1 53.4<br />
125 m 29.3 23.4 14.7 43.6 33.3<br />
<strong>The</strong> length-weight and fecundity-weight relationships are given in Figure 14-5 and 14-<br />
6, respectively. Fecundity ranged from 9 to 34 for females weighing between 16 and 39 g. No<br />
relation was found between oocyte weight and body weight. <strong>The</strong> GSI threshold above which<br />
the oocyte weight did no longer increase significantly was 2.7% (Figure 14-7). <strong>The</strong> mean<br />
oocyte weight was 46.04 mg (± 5.99 SD, N= 22).<br />
68
% ripe females<br />
50<br />
45<br />
40<br />
35<br />
30<br />
25<br />
20<br />
15<br />
10<br />
5<br />
0<br />
a<br />
Aug-98<br />
Sep-98<br />
Oct-98<br />
Nov-98<br />
Dec-98<br />
Jan-99<br />
Feb-99<br />
Mar-99<br />
Apr-99<br />
May-99<br />
33 41 105 99 74 38 39 41 10<br />
% males in breeding colour<br />
b<br />
100<br />
90<br />
80<br />
70<br />
60<br />
50<br />
40<br />
30<br />
20<br />
10<br />
0<br />
Aug-98<br />
Sep-98<br />
Oct-98<br />
Nov-98<br />
Dec-98<br />
Jan-99<br />
Feb-99<br />
Mar-99<br />
Apr-99<br />
May-99<br />
61 65 70 67 90 86 74 82 79<br />
Figure 14-3. Seasonal progression <strong>of</strong> the percentage <strong>of</strong> ripe (stages 4 and 5) females (a) and<br />
males (b) Diplotaxodon apogon in the SWA <strong>The</strong> values below the x-axis are the effective<br />
(number <strong>of</strong> male or females which size was above the size at maturity) for each month.<br />
100<br />
% mature females<br />
50<br />
0<br />
55 65 75 85 95 105 115 125<br />
Standard length (mm)<br />
Figure 14-4. Percentage <strong>of</strong> mature females (stage 3 and above) per size class (standard length)<br />
for Diplotaxodon apogon in the SWA.<br />
69
50<br />
Weight (g)<br />
40<br />
30<br />
20<br />
y = 0,0001x 2,6373<br />
10<br />
R 2 = 0,8437<br />
0<br />
70 80 90 100 110 120 130<br />
Length (mm)<br />
Figure 14-5. Length-weight relationship for Diplotaxodon apogon females in the SWA. (R² =<br />
determination coefficient).<br />
Fecundity<br />
40<br />
35<br />
30<br />
25<br />
20<br />
15<br />
10<br />
5<br />
0<br />
y = 0,6738x - 1,0371<br />
R 2 = 0,2297<br />
10 15 20 25 30 35 40<br />
Weight (g)<br />
Figure 14-6. Fecundity-weight relationship for Diplotaxodon apogon females in the SWA. (R²<br />
= determination coefficient).<br />
60<br />
Oocyte weight (mg)<br />
50<br />
40<br />
30<br />
20<br />
y = 2,2007x + 38,224<br />
10<br />
R 2 = 0,0636<br />
0<br />
0,0 1,0 2,0 3,0 4,0 5,0<br />
GSI (%)<br />
Figure 14-7. Relationship between oocyte weight and gonado-somatic index (GSI) for<br />
Diplotaxodon apogon. Oocytes from females whose GSI was below (in grey) and above<br />
(in black with regression) 2.7%. (R² = determination coefficient).<br />
70
Depth (m)<br />
50<br />
75<br />
100<br />
Overall mean catches (%)<br />
0 1 2 3<br />
Weight<br />
Number<br />
125<br />
Figure 15-1. Mean occurrence and abundance in the catches per depth <strong>of</strong> Diplotaxodon<br />
argenteus in the SWA between July 1998 and May 1999.<br />
14<br />
12<br />
Frequency %<br />
10<br />
8<br />
6<br />
4<br />
2<br />
0<br />
45 55 65 75 85 95 105 115 125 135 145 155 165 175 185 195 205<br />
Standard length (mm)<br />
Figure 15-2. Size range and frequencies <strong>of</strong> Diplotaxodon argenteus caught in the SWA<br />
between July 1998 and May 1999.<br />
71
Diplotaxodon argenteus (Trewavas)<br />
278 females and 343 males were analysed. D. argenteus was found between 50 and<br />
125 m but became more frequent from 75 m downwards, where it constituted between about 1<br />
and 2% <strong>of</strong> the catches in number and 1.5 and 3% in weight (Figure 15-1). <strong>The</strong> mean CPUE<br />
per depth category was 1.5 kg in the shallow zone, 11 kg in the deep zone and 3.3 kg in the<br />
very deep zone, which matched the values <strong>report</strong>ed in Tómasson & Banda (1996) for the<br />
shallows (1.2 kg) but was about three times more for the deep (3 kg) and very deep zones (1.3<br />
kg). Specimens caught ranged between 48 and 206 mm (Figure 15-2). <strong>The</strong> sex ratio observed<br />
over the full sampling period was F/M 0.4/0.6.<br />
Owing to irregularity in the catches <strong>of</strong> this species and low sample size <strong>of</strong> individuals<br />
above the size at maturity, precise determination <strong>of</strong> breeding season was not possible.<br />
Breeding females were found in October-November 98 and from February to May 99 (Figure<br />
15-3a). More than 30% <strong>of</strong> males in breeding colour were found all year long excluding June<br />
98 were only one individual was caught (Figure 15-3b). Considering the high percentages <strong>of</strong><br />
breeding males and the extremely low sample size for females from June to September, it is<br />
likely that D. argenteus breed most <strong>of</strong> the year with a possible cessation in December-<br />
January. Ripe females were relatively evenly distributed between 75 and 125 m, whereas<br />
more than 60% <strong>of</strong> males in breeding colour were caught at 75 m, suggesting that spawning<br />
could mainly occur at 75 m (Table 15-1). Maturity was reached in their second year at 20<br />
months old at a mean size <strong>of</strong> 140 mm for females (Figure 15-4).<br />
Table 15-1. Percentage <strong>of</strong> ripe females (stages 4 and 5), males in breeding colour and<br />
immature individuals (whose size is below the size at maturity) per depth for Diplotaxodon<br />
argenteus in the SWA.<br />
Depth<br />
Non ripe<br />
females<br />
Ripe females<br />
Males not in<br />
breeding colour<br />
Males in breeding<br />
colour<br />
Immature<br />
specimens<br />
50 m 35.3 11.1 2.1 0.6 1<br />
75 m 11.2 22.2 35.4 61.7 29.5<br />
100 m 38.8 33.3 29.6 16.2 33.4<br />
125 m 14.7 33.3 32.8 21.4 36<br />
<strong>The</strong> length-weight and fecundity-weight relationships are given in Figure 15-5 and 15-<br />
6, respectively. Fecundity ranged from 25 to 53 for females weighing between 55 and 139 g.<br />
No relation was found between oocyte weight and body weight. <strong>The</strong> GSI threshold above<br />
which the oocyte weight did no longer increase significantly was 3% (Figure 15-7). <strong>The</strong> mean<br />
oocyte weight was 73.03 mg (± 7.98 SD, N= 3).<br />
Diplotaxodon limnothrissa (Turner) (Plate 8)<br />
1462 females and 2723 males were analysed. D. limnothrissa was common from 50 to<br />
125 m and was occasionally encountered at 10 m depth (Figure 16-1), which corresponds to<br />
the depth distribution <strong>report</strong>ed by Thompson et al. (1996) and Tómasson & Banda (1996). It<br />
was a dominant species in the catches at 50, 75 and 100 m, where it constituted (in number<br />
and weight, respectively) 6.2 and 3.8%, 8.3 and 7.7% and 11.7 and 9.7% <strong>of</strong> the catches,<br />
respectively. <strong>The</strong> mean CPUE per depth category was 14.7 kg in the shallow zone, 34.1 kg in<br />
72
% ripe females<br />
50<br />
45<br />
40<br />
35<br />
30<br />
25<br />
20<br />
15<br />
10<br />
5<br />
0<br />
a<br />
Jul-98<br />
Aug-98<br />
Sep-98<br />
Oct-98<br />
Nov-98<br />
Dec-98<br />
Jan-99<br />
Feb-99<br />
Mar-99<br />
Apr-99<br />
May-99<br />
1 43 7 6 8 4 19 18 19<br />
% males in breeding colour<br />
80<br />
70<br />
60<br />
50<br />
40<br />
30<br />
20<br />
10<br />
0<br />
b<br />
Jun-98<br />
Jul-98<br />
Aug-98<br />
Sep-98<br />
Oct-98<br />
Nov-98<br />
Dec-98<br />
Jan-99<br />
Feb-99<br />
Mar-99<br />
Apr-99<br />
May-99<br />
1 11 9 60 45 41 39 42 36 32 27<br />
Figure 15-3. Seasonal progression <strong>of</strong> the percentage <strong>of</strong> ripe (stages 4 and 5) females (a) and<br />
males (b) Diplotaxodon argenteus in the SWA <strong>The</strong> values below the x-axis are the<br />
effective (number <strong>of</strong> male or females which size was above the size at maturity) for each<br />
month.<br />
100<br />
% mature females<br />
50<br />
0<br />
45 55 65 75 85 95 105 115 125 135 145 155 165 175 185 195<br />
Standard length (mm)<br />
Figure 15-4. Percentage <strong>of</strong> mature females (stage 3 and above) per size class (standard length)<br />
for Diplotaxodon argenteus in the SWA.<br />
73
Weight (g)<br />
160<br />
140<br />
120<br />
100<br />
80<br />
60<br />
40<br />
20<br />
0<br />
y = 0,0015x 2,1803<br />
R 2 = 0,925<br />
100 120 140 160 180 200<br />
Length (mm)<br />
Figure 15-5. Length-weight relationship for Diplotaxodon argenteus females in the SWA. (R²<br />
= determination coefficient).<br />
60<br />
50<br />
Fecundity<br />
40<br />
30<br />
20<br />
10<br />
y = 0,3006x + 6,1836<br />
R 2 = 0,6176<br />
0<br />
50 70 90 110 130 150<br />
Weight (g)<br />
Figure 15-6. Fecundity-weight relationship for Diplotaxodon argenteus females in the SWA.<br />
(R² = determination coefficient).<br />
Oocyte weight (mg)<br />
90<br />
80<br />
70<br />
60<br />
50<br />
40<br />
30<br />
20<br />
10<br />
0<br />
y = -0,1005x + 73,431<br />
R 2 = 5E-05<br />
1,0 1,5 2,0 2,5 3,0 3,5 4,0 4,5 5,0<br />
GSI (%)<br />
Figure 15-7. Relationship between oocyte weight and gonado-somatic index (GSI) for<br />
Diplotaxodon argenteus. Oocytes from females whose GSI was below (in grey) and above<br />
(in black with regression) 2.7%. (R² = determination coefficient).<br />
74
Plate 8. Diplotaxodon limnothrissa (by Dave Voorvelt).<br />
Overall mean catches (%)<br />
0 5 10 15<br />
Depth (m)<br />
10<br />
50<br />
75<br />
100<br />
125<br />
Weight<br />
Number<br />
Figure 16-1. Mean occurrence and abundance in the catches per depth <strong>of</strong> Diplotaxodon<br />
limnothrissa in the SWA between July 1998 and May 1999.<br />
14<br />
12<br />
10<br />
Frequency %<br />
8<br />
6<br />
4<br />
2<br />
0<br />
42 47 52 57 62 67 72 77 82 87 92 97 102 107 112 117 122 127 132 137 142 147 152 157 162 167 172 177<br />
Standard length (mm)<br />
Figure 16-2. Size range and frequencies <strong>of</strong> Diplotaxodon limnothrissa caught in the SWA<br />
between July 1998 and May 1999.<br />
75
the deep zone and 4.1 kg in the very deep zone, which approximately matched the values<br />
<strong>report</strong>ed in Tómasson & Banda (1996) for the deep (36 kg) and very deep zones (7.1 kg) but<br />
was about twice as much for the shallows (6.7 kg). Specimen caught ranged between 40 and<br />
175 mm (Figure 16-2). <strong>The</strong> sex ratio that was observed over the full sampling period was F/M<br />
0.3/0.7.<br />
Breeding season for females in the SWA occurred from March to August with a peak<br />
between April and June (Figure 16-3a) whereas males in breeding colour were caught<br />
throughout the year except in June (Figure 16-3b). <strong>The</strong>se results being based upon pretty<br />
consistent sample size, the reason for the lack <strong>of</strong> fitting between females and males results is<br />
too be found elsewhere. Ripe females <strong>of</strong> the same species were found almost all year with a<br />
peak in March-April from <strong>of</strong>fshore <strong>fish</strong>ing locations and with a peak in May-June from<br />
inshore <strong>fish</strong>ing location in the SEA (Thompson et al. 1996). Ripe females and males were also<br />
recorded from all over the <strong>Lake</strong> at any time <strong>of</strong> the year (Turner 1994a, Robinson R. L. pers.<br />
com.). Recent molecular analyses have shown that D. limnothrissa was constituted <strong>of</strong> a single<br />
wide spread population all over the <strong>Lake</strong> (Turner et al. 1999). This implies no breeding<br />
isolation from any part <strong>of</strong> the <strong>Lake</strong> and then large scale migrations <strong>of</strong> individuals. It is<br />
therefore likely that the breeding season we observed in the SWA between June 98 and May<br />
99 was only a fixed and reductive picture <strong>of</strong> what happens at the <strong>Lake</strong> scale. Taking into<br />
account all the available information, it is probable that D. limnothrissa breeds all year long,<br />
but with seasonal geographical peak <strong>of</strong> activity, which would explain our observed pattern.<br />
Ripe females and males in breeding colour were found from 50 to 125 m with a higher<br />
frequency at 125 m for females and at 75 m for males (Table 16-1). It was previously thought<br />
that D. limnothrissa was not forming demersal spawning arenas because aggregation <strong>of</strong><br />
breeding males had never been observed (Turner 1994a, Thompson et al. 1996). This was<br />
used to emphasised that some <strong>of</strong> the pelagic cichlid species might be able to spawn<br />
independently <strong>of</strong> the bottom <strong>of</strong> the lake (Thompson et al. 1996), as already observed for<br />
Copadichromis ("Haplochromis") chrysonotus (Eccles & Lewis 1981). However, large<br />
aggregations <strong>of</strong> males in breeding colours (more than 300 specimens) were found at 75 and<br />
100 m in the SWA in April and May 99, suggesting that spawning probably occur close to the<br />
bottom at these depths. As already <strong>report</strong>ed by Turner (1994a, 1996), D. limnothrissa females<br />
were observed to moothbrood young to large sizes, up to 23 mm SL. Maturity was reached<br />
early in their second year at 16 months old at a mean size <strong>of</strong> 105 mm for females (Figure 16-<br />
4), a size a bit smaller than the 14 cm TL (about 113 mm SL) <strong>report</strong>ed by Thompson et al.<br />
(1996).<br />
Table 16-1. Percentage <strong>of</strong> ripe females (stages 4 and 5), males in breeding colour and<br />
immature individuals (whose size is below the size at maturity) per depth for Diplotaxodon<br />
limnothrissa in the SWA.<br />
Depth<br />
Non ripe<br />
females<br />
Ripe females<br />
Males not in<br />
breeding colour<br />
Males in breeding<br />
colour<br />
Immature<br />
specimens<br />
10 m 0.2 0 0.4 0 0.7<br />
50 m 14.4 25.7 18.5 4.1 34.7<br />
75 m 39.6 11 31.5 53.4 34.4<br />
100 m 35.4 17.8 41 31.2 27<br />
125 m 10.4 45.5 8.5 11.3 3.3<br />
76
% ripe females<br />
50<br />
45<br />
40<br />
35<br />
30<br />
25<br />
20<br />
15<br />
10<br />
5<br />
0<br />
Jun-98<br />
Jul-98<br />
Aug-98<br />
Sep-98<br />
Oct-98<br />
Nov-98<br />
Dec-98<br />
Jan-99<br />
Feb-99<br />
Mar-99<br />
Apr-99<br />
May-99<br />
a<br />
238 128 108 316 53 41 60 65 109 232 113<br />
% males in breeding colour<br />
80<br />
70<br />
60<br />
50<br />
40<br />
30<br />
20<br />
10<br />
0<br />
b<br />
Jun-98<br />
Jul-98<br />
Aug-98<br />
Sep-98<br />
Oct-98<br />
Figure 16-3. Seasonal progression <strong>of</strong> the percentage <strong>of</strong> ripe (stages 4 and 5) females (a) and<br />
males (b) Diplotaxodon limnothrissa in the SWA <strong>The</strong> values below the x-axis are the<br />
effective (number <strong>of</strong> male or females which size was above the size at maturity) for each<br />
month.<br />
Nov-98<br />
227 72 115 328 70 84 116 111 347 514 739<br />
Dec-98<br />
Jan-99<br />
Feb-99<br />
Mar-99<br />
Apr-99<br />
May-99<br />
100<br />
% mature females<br />
50<br />
0<br />
45 55 65 75 85 95 105 115 125 135 145<br />
Standard length (mm)<br />
Figure 16-4. Percentage <strong>of</strong> mature females (stage 3 and above) per size class (standard length)<br />
for Diplotaxodon limnothrissa in the SWA.<br />
77
Weight (g)<br />
80<br />
70<br />
60<br />
50<br />
40<br />
30<br />
20<br />
10<br />
0<br />
y = 5E-05x 2,7974<br />
R 2 = 0,9456<br />
20 40 60 80 100 120 140 160<br />
Length (mm)<br />
Figure 16-5. Length-weight relationship for Diplotaxodon limnothrissa females in the SWA.<br />
(R² = determination coefficient).<br />
Fecundity<br />
35<br />
30<br />
25<br />
20<br />
15<br />
10<br />
5<br />
y = 0,259x + 7,2365<br />
R 2 = 0,1148<br />
0<br />
20 30 40 50 60<br />
Weight (g)<br />
Figure 16-6. Fecundity-weight relationship for Diplotaxodon limnothrissa females in the<br />
SWA. (R² = determination coefficient).<br />
Oocyte weight (mg)<br />
90<br />
80<br />
70<br />
60<br />
50<br />
40<br />
30<br />
20<br />
y = 5,5821x + 41,918<br />
10<br />
R 2 = 0,1606<br />
0<br />
0,0 1,0 2,0 3,0 4,0 5,0 6,0<br />
GSI (%)<br />
Figure 16-7. Relationship between oocyte weight and gonado-somatic index (GSI) for<br />
Diplotaxodon limnothrissa. Oocytes from females whose GSI was below (in grey) and<br />
above (in black with regression) 3%. (R² = determination coefficient).<br />
78
Plate 9. Diplotaxodon macrops (by Dave Voorvelt).<br />
Overall mean catches (%)<br />
0 5 10 15<br />
Depth (m)<br />
75<br />
100<br />
Weight<br />
Number<br />
125<br />
Figure 17-1. Mean occurrence and abundance in the catches per depth <strong>of</strong> Diplotaxodon<br />
macrops in the SWA between July 1998 and May 1999.<br />
30<br />
25<br />
Frequency %<br />
20<br />
15<br />
10<br />
5<br />
0<br />
42 47 52 57 62 67 72 77 82 87 92 97 102 107 112 117 122 127 132 137 142 147<br />
Standard length (mm)<br />
Figure 17-2. Size range and frequencies <strong>of</strong> Diplotaxodon macrops caught in the SWA<br />
between July 1998 and May 1999.<br />
79
<strong>The</strong> length-weight and fecundity-weight relationships are given in Figure 16-5 and 16-<br />
6, respectively. Fecundity ranged from 10 to 30 for females weighing between 22 and 55 g<br />
and was not correlated to body weight. <strong>The</strong> fecundity range we found corresponded with the<br />
average fecundity <strong>of</strong> 15 eggs observed by Thompson et al. (1996) for females <strong>of</strong> 14-18 cm<br />
TL. No relation was found between oocyte weight and body weight. <strong>The</strong> GSI threshold above<br />
which the oocyte weight did no longer increase significantly was 3% (Figure 16-7). <strong>The</strong> mean<br />
oocyte weight was 62.30 mg (± 7.93 SD, N= 21).<br />
Diplotaxodon macrops (Turner & Stauffer) (Plate 9)<br />
1664 females and 2919 males were analysed. D. macrops was caught from 75 to 125<br />
m (Figure 17-1). It was a dominant species in the catches at 75 100 and 125 m, where it<br />
constituted (in number and weight, respectively) 5.3 and 4%, 11.6 and 10.4% and 10 and<br />
11.8% <strong>of</strong> the catches, respectively. <strong>The</strong> mean CPUE per depth category was 39.3 kg in the<br />
deep zone and 24 kg in the very deep zone. <strong>The</strong>re was no record for this species in Tómasson<br />
& Banda (1996). Specimens caught ranged between 40 and 135 mm (Figure 17-2). A single<br />
individual measuring 150 mm was caught, which was probably a specimen <strong>of</strong> the resembling<br />
D. '<strong>of</strong>fshore' that grows larger (Robinson R. L., pers. com.). <strong>The</strong> sex ratio observed over the<br />
full sampling period was F/M 0.4/0.6.<br />
Ripe females (Figure 17-3a) and males (Figure 17-3b) were found throughout the year<br />
with a decline between October and December and a peak <strong>of</strong> activity from February to April.<br />
Most ripe females and males in breeding colour were found at 100 and 125 m (Table 17-1).<br />
All the large aggregations <strong>of</strong> breeding males (between 100 and 400 specimens) observed in<br />
August 98, January, February, March , April and May 99, were caught at 100 and 125 m,<br />
suggesting that spawning probably occurs at these depths. <strong>The</strong> mean size at maturity for<br />
females was about 98 mm (Figure 17-4), which corresponded to a mean age at maturity <strong>of</strong> 20<br />
months.<br />
Table 17-1. Percentage <strong>of</strong> ripe females (stages 4 and 5), males in breeding colour and<br />
immature individuals (whose size is below the size at maturity) per depth for Diplotaxodon<br />
macrops in the SWA.<br />
Depth<br />
Non ripe<br />
females<br />
Ripe females<br />
Males not in<br />
breeding colour<br />
Males in breeding<br />
colour<br />
Immature<br />
specimens<br />
75 m 11.9 5.1 24.9 11.5 33.2<br />
100 m 52.1 49.1 47.8 30.4 46.5<br />
125 m 36.1 45.8 27.3 58 20.3<br />
<strong>The</strong> length-weight and fecundity-weight relationships are given in Figure 17-5 and 17-<br />
6, respectively. Fecundity ranged from 10 to 37 for females weighing between 20.6 and 51 g<br />
and was not correlated to body weight. No relation was found between oocyte weight and<br />
body weight. <strong>The</strong> GSI threshold above which the oocyte weight did no longer increase<br />
significantly was 3% (Figure 17-7). <strong>The</strong> mean oocyte weight was 56.04 mg (± 9.4 SD, N=<br />
46).<br />
80
60<br />
% ripe females<br />
a<br />
% males in breeding colour<br />
b<br />
50<br />
40<br />
30<br />
20<br />
10<br />
0<br />
100<br />
90<br />
80<br />
70<br />
60<br />
50<br />
40<br />
30<br />
20<br />
10<br />
0<br />
Jun-98<br />
Jul-98<br />
Aug-98<br />
Sep-98<br />
Oct-98<br />
Nov-98<br />
Dec-98<br />
Jan-99<br />
Feb-99<br />
Mar-99<br />
Apr-99<br />
May-99<br />
135 50 137 264 58 85 222 89 233 7 155<br />
Jun-98<br />
Jul-98<br />
Aug-98<br />
Sep-98<br />
Oct-98<br />
Nov-98<br />
Dec-98<br />
Jan-99<br />
Feb-99<br />
Mar-99<br />
Apr-99<br />
May-99<br />
29 24 273 132 140 111 538 335 315 366 656<br />
Figure 17-3. Seasonal progression <strong>of</strong> the percentage <strong>of</strong> ripe (stages 4 and 5) females (a) and<br />
males (b) Diplotaxodon macrops in the SWA <strong>The</strong> values below the x-axis are the effective<br />
(number <strong>of</strong> male or females which size was above the size at maturity) for each month.<br />
100<br />
% mature females<br />
50<br />
0<br />
45 55 65 75 85 95 105 115 125 135<br />
Standard length (mm)<br />
Figure 17-4. Percentage <strong>of</strong> mature females (stage 3 and above) per size class (standard length)<br />
for Diplotaxodon macrops in the SWA.<br />
81
Weight (g)<br />
70<br />
60<br />
50<br />
y = 7E-05x 2,7825<br />
R 2 = 0,9358<br />
40<br />
30<br />
20<br />
10<br />
0<br />
20 40 60 80 100 120 140<br />
Length (mm)<br />
Figure 17-5. Length-weight relationship for Diplotaxodon macrops females in the SWA. (R²<br />
= determination coefficient).<br />
Fecundity<br />
40<br />
35<br />
30<br />
25<br />
20<br />
15<br />
10<br />
y = 0,245x + 8,8603<br />
5<br />
R 2 = 0,085<br />
0<br />
20 25 30 35 40 45 50 55<br />
Weight (g)<br />
Figure 17-6. Fecundity-weight relationship for Diplotaxodon macrops females in the SWA.<br />
(R² = determination coefficient).<br />
Oocyte weight (mg)<br />
90<br />
80<br />
70<br />
60<br />
50<br />
40<br />
30<br />
20<br />
10<br />
0<br />
y = 1,5093x + 50,438<br />
R 2 = 0,0116<br />
0,0 1,0 2,0 3,0 4,0 5,0 6,0<br />
GSI (%)<br />
Figure 17-7. Relationship between oocyte weight and gonado-somatic index (GSI) for<br />
Diplotaxodon macrops. Oocytes from females whose GSI was below (in grey) and above<br />
(in black with regression) 3%. (R² = determination coefficient).<br />
82
Overall mean catches (%)<br />
0,0 0,5 1,0 1,5 2,0 2,5<br />
Depth (m)<br />
50<br />
75<br />
100<br />
Weight<br />
Number<br />
125<br />
Figure 18-1. Mean occurrence and abundance in the catches per depth <strong>of</strong> Pallidochromis<br />
tokolosh in the SWA between July 1998 and May 1999.<br />
25<br />
20<br />
Frequency %<br />
15<br />
10<br />
5<br />
0<br />
65 75 85 95 105 115 125 135 145 155 165 175 185 195 205 215<br />
Standard length (mm)<br />
Figure 18-2. Size range and frequencies <strong>of</strong> Pallidochromis tokolosh caught in the SWA<br />
between July 1998 and May 1999.<br />
83
Pallidochromis tokolosh (Turner)<br />
210 females and 134 males were analysed. P. tokolosh was common from 75 to 125 m<br />
and was occasionally caught at 50 m (Figure 18-1). It was more frequent at 125 m, where it<br />
constituted 1.1 and 1.9% <strong>of</strong> the catches in number and weight, respectively. <strong>The</strong> mean CPUE<br />
per depth category was 0.15 kg in the shallows, 3.6 kg in the deep zone and 4.4 kg in the very<br />
deep zone, which matched the values <strong>report</strong>ed by Tómasson & Banda (1996) for the shallow<br />
and deep zone but was more than twice as much for the very deep zone (1.8 kg). Specimens<br />
caught ranged between 62 and 213 mm with a mode from 100 to 160 mm (Figure 18-2). <strong>The</strong><br />
sex ratio observed over the full sampling period was F/M 0.6/0.4.<br />
P. tokolosh is not an abundant <strong>fish</strong> and low sample size at some months hampered the<br />
correct determination <strong>of</strong> breeding season. Next, we never observed any particular breeding<br />
dress for males and therefore the percentage <strong>of</strong> males in breeding colour was impossible to<br />
assess. From the data available, it seemed that the breeding season would occur between<br />
October and February (Figure 18-3). <strong>The</strong> depth distribution <strong>of</strong> ripe females (Table 18-1)<br />
reflected the relative abundance per depth with 67% at 125 m and 30% at 75 m. No particular<br />
indication about spawning depth was drawn from these results. Maturity was reached early in<br />
their second year at 16 months old at a mean size <strong>of</strong> 135 mm for females (Figure 18-4).<br />
Table 18-1. Percentage <strong>of</strong> ripe females (stages 4 and 5), males in breeding colour and<br />
immature individuals (whose size is below the size at maturity) per depth for<br />
Pallidochromis tokolosh in the SWA. Sample size between bracket.<br />
Depth<br />
Non ripe females<br />
(70)<br />
Ripe females<br />
(27)<br />
Immature<br />
Specimens<br />
(185)<br />
50 m 0 3.7 0<br />
75 m 22.9 29.6 44.3<br />
100 m 10 0 18.4<br />
125 m 67.1 66.7 37.3<br />
<strong>The</strong> length-weight and fecundity-weight relationships are presented in Figure 18-5 and<br />
18-6, respectively. Fecundity ranged from 13 to 87 for females weighing between 36 and 143<br />
g. No relation was found between oocyte weight and body weight. <strong>The</strong> largest and heaviest<br />
oocytes <strong>of</strong> all cichlid species studied were produced by P. tokolosh, the record being 85 mg.<br />
<strong>The</strong> GSI threshold above which the oocyte weight did no longer increase significantly was not<br />
determined owing to low sample size <strong>of</strong> high GSI (Figure 18-7). Nevertheless, assuming a 3%<br />
threshold as for the other species <strong>of</strong> the Diplotaxodon clade, the mean oocyte weight was<br />
70.49 mg (± 12.53 SD, N= 3).<br />
84
% ripe females<br />
80<br />
70<br />
60<br />
50<br />
40<br />
30<br />
20<br />
10<br />
0<br />
Jun-98<br />
Jul-98<br />
Aug-98<br />
Sep-98<br />
Oct-98<br />
Nov-98<br />
Dec-98<br />
Jan-99<br />
Feb-99<br />
Mar-99<br />
Apr-99<br />
May-99<br />
3 8 10 8 8 21 18 4 9 8 27<br />
Figure 18-3. Seasonal progression <strong>of</strong> the percentage <strong>of</strong> ripe (stages 4 and 5) females<br />
Pallidochromis tokolosh in the SWA <strong>The</strong> values below the x-axis are the effective (number<br />
<strong>of</strong> females which size was above the size at maturity) for each month.<br />
100<br />
% mature females<br />
50<br />
0<br />
65 75 85 95 105 115 125 135 145 155 165 175 185 195 205<br />
Standard length (mm)<br />
Figure 18-4. Percentage <strong>of</strong> mature females (stage 3 and above) per size class (standard length)<br />
for Pallidochromis tokolosh in the SWA.<br />
85
Weight (g)<br />
160<br />
140<br />
120<br />
100<br />
80<br />
60<br />
40<br />
y = 5E-05x 2,7716<br />
20<br />
R 2 = 0,9287<br />
0<br />
100 120 140 160 180 200 220<br />
Length (mm)<br />
Figure 18-5. Length-weight relationship for Pallidochromis tokolosh females in the SWA. (R²<br />
= determination coefficient).<br />
100<br />
80<br />
Fecundity<br />
60<br />
40<br />
20<br />
0<br />
y = 0,5496x - 4,5233<br />
R 2 = 0,7257<br />
0 50 100 150<br />
Weight (g)<br />
Figure 18-6. Fecundity-weight relationship for Pallidochromis tokolosh females in the SWA.<br />
(R² = determination coefficient).<br />
Oocyte weight (mg)<br />
90<br />
80<br />
70<br />
60<br />
50<br />
40<br />
30<br />
20<br />
10<br />
0<br />
0,0 1,0 2,0 3,0 4,0 5,0<br />
GSI (%)<br />
Figure 18-7. Relationship between oocyte weight and gonado-somatic index (GSI) for<br />
Pallidochromis tokolosh. Oocytes from females whose GSI was below (in grey) and above<br />
(in black) 3%.<br />
86
Plate 10. Lethrinops argenteus (by Dave Voorvelt).<br />
Overall mean catches (%)<br />
0 5 10 15 20<br />
10<br />
Depth (m)<br />
30<br />
50<br />
75<br />
100<br />
125<br />
Weight<br />
Number<br />
Figure 19-1. Mean occurrence and abundance in the catches per depth <strong>of</strong> Lethrinops<br />
argenteus in the SWA between July 1998 and May 1999.<br />
Frequency %<br />
9<br />
8<br />
7<br />
6<br />
5<br />
4<br />
3<br />
2<br />
1<br />
0<br />
52 57 62 67 72 77 82 87 92 97 102 107 112 117 122 127 132 137 142 147 152 157 162<br />
Standard length (mm)<br />
Figure 19-2. Size range and frequencies <strong>of</strong> Lethrinops argenteus caught in the SWA between<br />
July 1998 and May 1999.<br />
87
Lethrinops spp.<br />
Lethrinops argenteus (Ahl) (Plate 10)<br />
3176 females and 2424 males were analysed. L. argenteus was caught from 10 to 125<br />
m (Figure 19-1). It was abundant only between 10 and 50 m where it was a dominant species<br />
in the catches, constituting between 9 and 11% <strong>of</strong> the catches in number and between 13 and<br />
19% in weight. <strong>The</strong> mean CPUE per depth category was 127.4 kg in the shallows, 0.15 and<br />
0.3 kg in the deep and very deep zones, respectively. No reference was made to this species in<br />
Tómasson & Banda (1996), who probably included this species in the L. longipinnis group.<br />
Specimens caught ranged between 50 and 165 mm (Figure 19-2). <strong>The</strong> sex ratio observed over<br />
the full sampling period was F/M 0.6/0.4.<br />
Ripe females (Figure 19-3a) and males (Figure 19-3b) <strong>of</strong> L. argenteus were found<br />
throughout the year with steady decline from March to June and in October and peaks <strong>of</strong><br />
activity in August 98 and between December and February 99. 70% <strong>of</strong> males in breeding<br />
colour and 43% <strong>of</strong> ripe females were caught at 30 m (Table 19-1). Aggregations <strong>of</strong> breeding<br />
males, although small (between 30 and 80 individuals) compared to those observed for<br />
Diplotaxodon spp., were always found at 30 m suggesting that spawning could occur at this<br />
depth. <strong>The</strong> mean size at maturity for females was about 108 mm (Figure 19-4), which<br />
corresponded to a mean age at maturity <strong>of</strong> 12 months.<br />
Table 19-1. Percentage <strong>of</strong> ripe females (stages 4 and 5), males in breeding colour and<br />
immature individuals (whose size is below the size at maturity) per depth for Lethrinops<br />
argenteus in the SWA.<br />
Depth<br />
Non ripe<br />
females<br />
Ripe females<br />
Males not in<br />
breeding colour<br />
Males in breeding<br />
colour<br />
Immature<br />
specimens<br />
10 m 17.4 26.2 31.2 22.6 23.1<br />
30 m 35.8 41.1 43.1 70.2 27.3<br />
50 m 46.5 32.3 25.5 6.7 49.5<br />
75 m 0.1 0 0.2 0.2 0.2<br />
100 m 0 0.4 0 0 0<br />
125 m 0.2 0 0.1 0.3 0<br />
<strong>The</strong> length-weight and fecundity-weight relationships are presented in Figure 19-5 and<br />
19-6, respectively. Fecundity ranged from 43 to 218 for females weighing between 12.5 and<br />
103 g. No relation was found between oocyte weight and body weight. <strong>The</strong> GSI threshold<br />
above which the oocyte weight did no longer increase significantly was 4% (Figure 19-7).<br />
<strong>The</strong> mean oocyte weight was 20.09 mg (± 4.17 SD, N= 28).<br />
88
% ripe females<br />
a<br />
% ripe females<br />
b<br />
45<br />
40<br />
35<br />
30<br />
25<br />
20<br />
15<br />
10<br />
5<br />
0<br />
50<br />
45<br />
40<br />
35<br />
30<br />
25<br />
20<br />
15<br />
10<br />
5<br />
0<br />
Jun-98<br />
Jul-98<br />
Aug-98<br />
Sep-98<br />
Oct-98<br />
Nov-98<br />
Dec-98<br />
Jan-99<br />
Feb-99<br />
Mar-99<br />
Apr-99<br />
May-99<br />
87 219 129 191 199 179 164 180 206 362 190<br />
Jun-98<br />
Jul-98<br />
Aug-98<br />
Sep-98<br />
Oct-98<br />
Nov-98<br />
Dec-98<br />
Jan-99<br />
Feb-99<br />
Mar-99<br />
Apr-99<br />
May-99<br />
130 207 155 184 287 202 245 260 237 285 232<br />
Figure 19-3. Seasonal progression <strong>of</strong> the percentage <strong>of</strong> ripe (stages 4 and 5) females (a) and<br />
males (b) Lethrinops argenteus in the SWA <strong>The</strong> values below the x-axis are the effective<br />
(number <strong>of</strong> male or females which size was above the size at maturity) for each month.<br />
100<br />
% mature females<br />
50<br />
0<br />
55 65 75 85 95 105 115 125 135 145<br />
Standard length (mm)<br />
Figure 19-4. Percentage <strong>of</strong> mature females (stage 3 and above) per size class (standard length)<br />
for Lethrinops argenteus in the SWA.<br />
89
Weight (g)<br />
120<br />
100<br />
80<br />
60<br />
40<br />
20<br />
y = 3E-05x 3,0087<br />
R 2 = 0,9596<br />
0<br />
40 60 80 100 120 140 160<br />
Length (mm)<br />
Figure 19-5. Length-weight relationship for Lethrinops argenteus females in the SWA. (R² =<br />
determination coefficient).<br />
250<br />
200<br />
Fecundity<br />
150<br />
100<br />
50<br />
0<br />
y = 1,7255x + 21,72<br />
R 2 = 0,6123<br />
0 20 40 60 80 100 120<br />
Weight (g)<br />
Figure 19-6. Fecundity-weight relationship for Lethrinops argenteus females in the SWA. (R²<br />
= determination coefficient).<br />
35<br />
30<br />
Oocyte weight (mg)<br />
25<br />
20<br />
15<br />
10<br />
5<br />
y = 0,1084x + 19,545<br />
R 2 = 0,001<br />
0<br />
0,0 2,0 4,0 6,0 8,0 10,0<br />
GSI (%)<br />
Figure 19-7. Relationship between oocyte weight and gonado-somatic index (GSI) for<br />
Lethrinops argenteus Oocytes from females whose GSI was below (in grey) and above (in<br />
black with regression) 4%. (R² = determination coefficient).<br />
90
Plate 11. Lethrinops 'deep water albus' (by Dave Voorvelt).<br />
Overall mean catches (%)<br />
0,0 1,0 2,0 3,0 4,0<br />
75<br />
Depth (m)<br />
100<br />
Weight<br />
Number<br />
125<br />
Figure 20-1. Mean occurrence and abundance in the catches per depth <strong>of</strong> Lethrinops 'deep<br />
water albus' in the SWA between July 1998 and May 1999.<br />
Frequency %<br />
35<br />
30<br />
25<br />
20<br />
15<br />
10<br />
5<br />
0<br />
45 55 65 75 85 95 105 115 125 135 145 155<br />
Standard length (mm)<br />
Figure 20-2. Size range and frequencies <strong>of</strong> Lethrinops 'deep water albus' caught in the SWA<br />
between July 1998 and May 1999.<br />
91
Lethrinops 'deep water albus' (Plate 11)<br />
303 females and 171 males were analysed. L. 'deep water albus' was caught from 75 to<br />
125 m, though rarely at 100 m (Figure 20-1). It was not an abundant <strong>fish</strong>, always constituting<br />
less than 1% <strong>of</strong> the catches and <strong>of</strong>ten completely absent from the sampled part <strong>of</strong> the SWA.<br />
<strong>The</strong> 3.3 and 3.7% <strong>of</strong> the catches respectively in weight and number, observed at 75 m were<br />
due to an exceptional catch in November 98, during which L. 'deep water albus' made up to<br />
31 and 33% <strong>of</strong> the catch in weight and number. However, L. 'deep water albus' was very<br />
abundant <strong>of</strong>f Domira Bay and <strong>of</strong>f Leopard Bay, being the dominant species in catches <strong>of</strong> 400<br />
to 600 kg between 75 and 125 m. This species seemed to be dominant in the deep water<br />
catches when Lethrinops gossei was absent or rare. L. 'deep water albus' was <strong>of</strong>ten very<br />
abundant in the catches in these areas when we were targeting for L. gossei, and one or the<br />
other was dominant but never both <strong>of</strong> them at the same time. As a matter <strong>of</strong> fact, during the<br />
exceptional catch <strong>of</strong> L. 'deep water albus' at 75 m in the SWA in November 98, only 38<br />
specimens <strong>of</strong> L. gossei were caught. As L. gossei was a consistently dominant species in the<br />
deep zone <strong>of</strong> the SWA (see further), it might explain why L. 'deep water albus' was rare.<br />
Specimens caught ranged between 40 and 160 mm (Figure 20-2). <strong>The</strong> sex ratio observed over<br />
the full sampling period was F/M 0.6/0.4.<br />
Owing to irregularity in the catches <strong>of</strong> this species and low sample size for most <strong>of</strong> the<br />
months, precise determination <strong>of</strong> breeding season was not possible and. Ripe females were<br />
found from June to August 98 and in November and January 98 (Figure 20-3a) whereas males<br />
in breeding colour were found at each sampling date, including in May (Figure 20-3b). Size at<br />
maturity was estimated at about 82 mm for females and was probably slightly overestimated<br />
as this estimation was not done during the height <strong>of</strong> the breeding season but with all the data<br />
available for females (Figure 20-4).<br />
<strong>The</strong> length-weight and fecundity-weight relationships are presented in Figure 20-5 and<br />
20-6, respectively. Fecundity ranged from 65 to 151 for females weighing between 19 and 42<br />
g. No relation was found between oocyte weight and body weight. <strong>The</strong> GSI threshold above<br />
which the oocyte weight did no longer increase significantly was not determine precisely<br />
owing to low sample size, but was estimated at 4% (Figure 20-7). <strong>The</strong> mean oocyte weight<br />
was 10.27 mg (± 0.89 SD, N= 3).<br />
92
% ripe females<br />
a<br />
% males in breeding colour<br />
b<br />
100<br />
90<br />
80<br />
70<br />
60<br />
50<br />
40<br />
30<br />
20<br />
10<br />
0<br />
90<br />
80<br />
70<br />
60<br />
50<br />
40<br />
30<br />
20<br />
10<br />
0<br />
Jun-98<br />
Jul-98<br />
Aug-98<br />
Sep-98<br />
Oct-98<br />
Nov-98<br />
Dec-98<br />
Jan-99<br />
Feb-99<br />
Mar-99<br />
Apr-99<br />
May-99<br />
19 29 15 22 216 1 1<br />
Jun-98<br />
Jul-98<br />
Aug-98<br />
Sep-98<br />
Oct-98<br />
Nov-98<br />
Dec-98<br />
Jan-99<br />
Feb-99<br />
Mar-99<br />
Apr-99<br />
May-99<br />
15 33 7 38 64 3 9 2<br />
Figure 20-3. Seasonal progression <strong>of</strong> the percentage <strong>of</strong> ripe (stages 4 and 5) females (a) and<br />
males (b) Lethrinops 'deep water albus' in the SWA <strong>The</strong> values below the x-axis are the<br />
effective (number <strong>of</strong> male or females which size was above the size at maturity) for each<br />
month.<br />
100<br />
% mature females<br />
50<br />
0<br />
45 55 65 75 85 95 105 115 125 135 145<br />
Standard length (mm)<br />
Figure 20-4. Percentage <strong>of</strong> mature females (stage 3 and above) per size class (standard length)<br />
for Lethrinops 'deep water albus' in the SWA.<br />
93
60<br />
50<br />
Weight (g)<br />
40<br />
30<br />
20<br />
y = 3E-05x 3,0396<br />
10<br />
R 2 = 0,8992<br />
0<br />
70 80 90 100 110 120<br />
Length (mm)<br />
Figure 20-5. Length-weight relationship for Lethrinops 'deep water albus' females in the<br />
SWA. (R² = determination coefficient).<br />
Fecundity<br />
160<br />
140<br />
120<br />
100<br />
80<br />
60<br />
40<br />
y = 2,8411x + 22,771<br />
20<br />
R 2 = 0,7249<br />
0<br />
10 15 20 25 30 35 40 45<br />
Weight (g)<br />
Figure 20-6. Fecundity-weight relationship for Lethrinops 'deep water albus' females in the<br />
SWA. (R² = determination coefficient).<br />
12<br />
Oocyte weight (mg)<br />
10<br />
8<br />
6<br />
4<br />
2<br />
0<br />
1,0 2,0 3,0 4,0 5,0 6,0<br />
GSI (%)<br />
Figure 20-7. Relationship between oocyte weight and gonado-somatic index (GSI) for<br />
Lethrinops 'deep water albus' Oocytes from females whose GSI was below (in grey) and<br />
above (in black with regression) 4%. (R² = determination coefficient).<br />
94
Plate 12. Lethrinops 'deep water altus' (by Dave Voorvelt).<br />
Overall mean catches (%)<br />
0 5 10 15<br />
Depth (m)<br />
75<br />
100<br />
Weight<br />
Number<br />
125<br />
Figure 21-1. Mean occurrence and abundance in the catches per depth <strong>of</strong> Lethrinops 'deep<br />
water altus' in the SWA between July 1998 and May 1999.<br />
Frequency %<br />
35<br />
30<br />
25<br />
20<br />
15<br />
10<br />
5<br />
0<br />
35 45 55 65 75 85 95 105 115 125 135 145<br />
Standard length (mm)<br />
Figure 21-2. Size range and frequencies <strong>of</strong> Lethrinops 'deep water altus' caught in the SWA<br />
between July 1998 and May 1999.<br />
95
Lethrinops 'deep water altus' (Plate 12)<br />
625 females and 885 males were analysed. L. 'deep water altus' was an abundant<br />
species <strong>of</strong> the deep and very deep zones, increasing in occurrence and biomass with depth<br />
from 75 to 125 m to reach 5.3 and 11.5% <strong>of</strong> the catches in weight and number, respectively<br />
(Figure 21-1). <strong>The</strong> mean CPUE per depth category was 8.6 and 3.3 kg in the deep and very<br />
deep zones, respectively. No reference was made to this species in Tómasson & Banda<br />
(1996). Specimens caught ranged between 35 and 130 mm with a mode from 60 to 100 mm<br />
(Figure 21-2). <strong>The</strong> sex ratio observed over the full sampling period was F/M 0.4/0.6.<br />
Breeding season occurred between December and August-September with a peak <strong>of</strong><br />
activity from February to June and a cessation in October-November confirmed by the lower<br />
percentage <strong>of</strong> active males during this period (Figure 21-3a and b). Ripe females and<br />
immature individuals were evenly distributed between 75 and 125 m, whereas about 60% <strong>of</strong><br />
the males in breeding colour were caught at 125 m, suggesting that spawning could occur<br />
mostly at this depth (Table 21-1). <strong>The</strong> mean size at maturity for females was about 60 mm<br />
(Figure 21-4), which corresponded to a mean age at maturity <strong>of</strong> 11 months.<br />
Table 21-1. Percentage <strong>of</strong> ripe females (stages 4 and 5), males in breeding colour and<br />
immature individuals (whose size is below the size at maturity) per depth for Lethrinops<br />
'deep water altus' in the SWA.<br />
Depth<br />
Non ripe<br />
females<br />
Ripe females<br />
Males not in<br />
breeding colour<br />
Males in breeding<br />
colour<br />
Immature<br />
specimens<br />
75 m 14.2 29.5 12.6 11.5 23.5<br />
100 m 46.2 34.7 37.1 31.3 37.3<br />
125 m 39.7 35.8 50.3 57.2 39.2<br />
<strong>The</strong> length-weight and fecundity-weight relationships are presented in Figure 21-5 and<br />
21-6, respectively. Fecundity ranged from 10 to 84 for females weighing between 5 and 19 g<br />
and was not correlated with body weight. No relation was found between oocyte weight and<br />
body weight. <strong>The</strong> GSI threshold above which the oocyte weight did no longer increase<br />
significantly was 3% (Figure 21-7). <strong>The</strong> mean oocyte weight was 8.08 mg (± 2.32 SD, N=<br />
34).<br />
96
% ripe females<br />
a<br />
% males in breeding colour<br />
b<br />
45<br />
40<br />
35<br />
30<br />
25<br />
20<br />
15<br />
10<br />
5<br />
0<br />
90<br />
80<br />
70<br />
60<br />
50<br />
40<br />
30<br />
20<br />
10<br />
0<br />
Jul-98<br />
Aug-98<br />
Sep-98<br />
Oct-98<br />
Nov-98<br />
Figure 21-3. Seasonal progression <strong>of</strong> the percentage <strong>of</strong> ripe (stages 4 and 5) females (a) and<br />
males (b) Lethrinops 'deep water altus' in the SWA <strong>The</strong> values below the x-axis are the<br />
effective (number <strong>of</strong> male or females which size was above the size at maturity) for each<br />
month.<br />
Dec-98<br />
Jan-99<br />
Feb-99<br />
Mar-99<br />
Apr-99<br />
May-99<br />
84 40 42 38 17 61 25 23 116 108<br />
Jul-98<br />
Aug-98<br />
Sep-98<br />
Oct-98<br />
Nov-98<br />
Dec-98<br />
85 70 91 83 40 61 73 51 150 181<br />
Jan-99<br />
Feb-99<br />
Mar-99<br />
Apr-99<br />
May-99<br />
100<br />
% mature females<br />
50<br />
0<br />
37 42 47 52 57 62 67 72 77 82 87 92<br />
Standard length (mm)<br />
Figure 21-4. Percentage <strong>of</strong> mature females (stage 3 and above) per size class (standard length)<br />
for Lethrinops 'deep water altus' in the SWA.<br />
97
Weight (g)<br />
20<br />
18<br />
16<br />
14<br />
12<br />
10<br />
8<br />
6<br />
4<br />
2<br />
0<br />
y = 4E-05x 2,9176<br />
R 2 = 0,7929<br />
50 60 70 80 90<br />
Length (mm)<br />
Figure 21-5. Length-weight relationship for Lethrinops 'deep water altus' females in the<br />
SWA. (R² = determination coefficient).<br />
Fecundity<br />
90<br />
80<br />
70<br />
60<br />
50<br />
40<br />
30<br />
20<br />
10<br />
0<br />
y = 1,6315x + 21,615<br />
R 2 = 0,1206<br />
5 10 15 20<br />
Weight (g)<br />
Figure 21-6. Fecundity-weight relationship for Lethrinops 'deep water altus' females in the<br />
SWA. (R² = determination coefficient).<br />
14<br />
12<br />
Oocyte weight (mg)<br />
10<br />
8<br />
6<br />
4<br />
2<br />
y = 0,5544x + 5,7836<br />
R 2 = 0,0587<br />
0<br />
0,0 1,0 2,0 3,0 4,0 5,0 6,0 7,0 8,0<br />
GSI (%)<br />
Figure 21-7. Relationship between oocyte weight and gonado-somatic index (GSI) for<br />
Lethrinops 'deep water altus' Oocytes from females whose GSI was below (in grey) and<br />
above (in black with regression) 4%. (R² = determination coefficient).<br />
98
Plate 13. Lethrinops gossei (by Dave Voorvelt).<br />
Overall mean catches (%)<br />
0 10 20 30<br />
Depth (m)<br />
50<br />
75<br />
100<br />
Weight<br />
Number<br />
125<br />
Figure 22-1. Mean occurrence and abundance in the catches per depth <strong>of</strong> Lethrinops gossei in<br />
the SWA between July 1998 and May 1999.<br />
25<br />
20<br />
Frequency (%)<br />
15<br />
10<br />
5<br />
0<br />
40 50 60 70 80 90 100 110 120 130 140 150 160 170<br />
Standard length (mm)<br />
Figure 22-2. Size range and frequencies <strong>of</strong> Lethrinops gossei caught in the SWA between July<br />
1998 and May 1999.<br />
99
Lethrinops gossei (Burgess & Axelrod) (Plate 13)<br />
3513 females and 3425 males were analysed. L. gossei was caught from 50 to 125 m,<br />
becoming very abundant form 75 m downwards (Figure 22-1). It was a dominant species <strong>of</strong><br />
the deep and very deep zones, where it constituted between 13 and 16% <strong>of</strong> the catches in<br />
number and between 18 and 25% in weight. <strong>The</strong> mean CPUE per depth category was 0.3, 108<br />
and 51.6 kg for the shallow, deep and very deep zones, respectively. Except for the very deep<br />
zone, this was very different from the values <strong>report</strong>ed in Tómasson & Banda (1996), who<br />
caught much more L. gossei per time unit in the shallows (21.6 kg) and about two times less<br />
in the deep zone (61.9 kg). Specimens caught ranged between 35 and 170 mm with a mode<br />
from 95 to 135 mm (Figure 22-2). <strong>The</strong> sex ratio observed over the full sampling period was<br />
F/M 0.5/0.5.<br />
Breeding season occurred between November and August with a peak <strong>of</strong> activity from<br />
January to March-April and a stop in September-October (Figure 22-3a). It was one <strong>of</strong> the<br />
rare species for which the pr<strong>of</strong>ile <strong>of</strong> the percentage <strong>of</strong> ripe males followed exactly the female's<br />
one (Figure 22-3b). <strong>The</strong> breeding season we observed corresponded relatively well to that<br />
found by Lewis & Tweddle (1990), who <strong>report</strong>ed a decline in October-November and a peak<br />
in March for the period 1983-85. Ripe females and males were evenly distributed between 75<br />
and 125 m (Table 22-1), as were the aggregations <strong>of</strong> males in breeding colour (between 100<br />
and 200 specimens), suggesting that spawning probably takes place at all three depths. <strong>The</strong><br />
mean size at maturity for females was about 92 mm (Figure 22-4), which is much less than<br />
the 147 mm TL estimated by Lewis & Tweddle (1990). This corresponded to a mean age at<br />
maturity <strong>of</strong> 11 months.<br />
Table 22-1. Percentage <strong>of</strong> ripe females (stages 4 and 5), males in breeding colour and<br />
immature individuals (whose size is below the size at maturity) per depth for Lethrinops<br />
gossei in the SWA.<br />
Depth<br />
Non ripe<br />
females<br />
Ripe females<br />
Males not in<br />
breeding colour<br />
Males in breeding<br />
colour<br />
Immature<br />
specimens<br />
50 m 0 0 0.1 0.1 0.2<br />
75 m 33.5 42.1 28 27.8 44<br />
100 m 26.9 36.8 39.3 37.8 36.4<br />
125 m 39.6 21.1 32.6 34.3 19.4<br />
<strong>The</strong> length-weight and fecundity-weight relationships are presented in Figure 22-5 and<br />
22-6, respectively. Fecundity ranged from 23 to 234 for females weighing between 10 and<br />
109 g. No relation was found between oocyte weight and body weight. <strong>The</strong> GSI threshold<br />
above which the oocyte weight did no longer increase significantly was 4% (Figure 22-7).<br />
<strong>The</strong> mean oocyte weight was 21.34 mg (± 4.34 SD, N= 190). A GSI <strong>of</strong> 12.4% was recorded<br />
for a L. gossei female (Figure 22-7), which was the highest GSI calculated on any cichlid<br />
species during the course <strong>of</strong> this study.<br />
100
% ripe females<br />
a<br />
% males in breeding colour<br />
b<br />
35<br />
30<br />
25<br />
20<br />
15<br />
10<br />
5<br />
0<br />
90<br />
80<br />
70<br />
60<br />
50<br />
40<br />
30<br />
20<br />
10<br />
-<br />
Jun-98<br />
Jul-98<br />
Aug-98<br />
Sep-98<br />
Oct-98<br />
Nov-98<br />
Dec-98<br />
Jan-99<br />
Feb-99<br />
Mar-99<br />
Apr-99<br />
May-99<br />
242 313 347 237 251 127 276 263 356 362 251<br />
Jun-98<br />
Jul-98<br />
Aug-98<br />
Sep-98<br />
Oct-98<br />
Nov-98<br />
Dec-98<br />
Jan-99<br />
Feb-99<br />
Mar-99<br />
Apr-99<br />
May-99<br />
250 312 254 183 226 236 449 298 333 450 346<br />
Figure 22-3. Seasonal progression <strong>of</strong> the percentage <strong>of</strong> ripe (stages 4 and 5) females (a) and<br />
males (b) Lethrinops gossei in the SWA <strong>The</strong> values below the x-axis are the effective<br />
(number <strong>of</strong> male or females which size was above the size at maturity) for each month.<br />
100<br />
% mature females<br />
50<br />
0<br />
35 45 55 65 75 85 95 105 115 125 135 145 155<br />
Standard length (mm)<br />
Figure 22-4. Percentage <strong>of</strong> mature females (stage 3 and above) per size class (standard length)<br />
for Lethrinops gossei in the SWA.<br />
101
Weight (g)<br />
120<br />
100<br />
80<br />
60<br />
40<br />
20<br />
0<br />
y = 3E-05x 2,9934<br />
R 2 = 0,9639<br />
0 20 40 60 80 100 120 140 160<br />
Length (mm)<br />
Figure 22-5. Length-weight relationship for Lethrinops gossei females in the SWA. (R² =<br />
determination coefficient).<br />
250<br />
200<br />
Fecundity<br />
150<br />
100<br />
50<br />
0<br />
y = 1,6832x + 19,458<br />
R 2 = 0,5994<br />
0 20 40 60 80 100 120<br />
Weight (g)<br />
Figure 22-6. Fecundity-weight relationship for Lethrinops gossei females in the SWA. (R² =<br />
determination coefficient).<br />
40<br />
35<br />
Oocyte weight (mg)<br />
30<br />
25<br />
20<br />
15<br />
10<br />
5<br />
y = 1,0771x + 15,785<br />
R 2 = 0,0657<br />
0<br />
0,0 2,0 4,0 6,0 8,0 10,0 12,0 14,0<br />
GSI (%)<br />
Figure 22-7. Relationship between oocyte weight and gonado-somatic index (GSI) for<br />
Lethrinops gossei. Oocytes from females whose GSI was below (in grey) and above (in<br />
black with regression) 4%. (R² = determination coefficient).<br />
102
Overall mean catches (%)<br />
0,0 0,5 1,0 1,5 2,0<br />
30<br />
Depth (m)<br />
50<br />
75<br />
100<br />
125<br />
Weight<br />
Number<br />
Figure 23-1. Mean occurrence and abundance in the catches per depth <strong>of</strong> Lethrinops<br />
longimanus in the SWA between July 1998 and May 1999.<br />
Frequency %<br />
35<br />
30<br />
25<br />
20<br />
15<br />
10<br />
5<br />
0<br />
55 65 75 85 95 105 115 125 135 145<br />
Standard length (mm)<br />
Figure 23-2. Size range and frequencies <strong>of</strong> Lethrinops longimanus caught in the SWA<br />
between July 1998 and May 1999.<br />
103
Lethrinops longimanus (Trewavas)<br />
210 females and 154 males were analysed. L. longimanus was caught from 30 to 125<br />
m (Figure 23-1). It was a relatively rare <strong>fish</strong> averaging less than 1% <strong>of</strong> the catches at all<br />
depths except at 50 m where it made up to 1.6 and 1.7% in number and weight, respectively.<br />
<strong>The</strong> mean CPUE per depth category 11.7, 2 and 0.15 kg for the shallow, deep and very deep<br />
zones, respectively, were much lower than those <strong>report</strong>ed by Tómasson & Banda (1996)<br />
(18.9, 23.1 and 3.7 kg, respectively). Specimens caught ranged between 56 and 147 mm with<br />
a mode from 100 to 120 mm (Figure 23-2). <strong>The</strong> sex ratio observed over the full sampling<br />
period was F/M 0.6/0.4.<br />
Owing to low sample size at some months and low number <strong>of</strong> ripe females caught,<br />
determination <strong>of</strong> precise breeding season was impossible. What can be said from the few data<br />
available is that breeding probably did not take place during the period from November to<br />
February when sample size were correct (Figure 23-3a). <strong>The</strong> only significant proportion <strong>of</strong><br />
ripe females was found in August 98, and taking into account the data for males (Figure 23-<br />
3b), it might be hypothesised that breeding season occur from May-June to August-<br />
September. All the ripe females and 70% <strong>of</strong> the ripe males were found at 50m, suggesting that<br />
spawning might occur at this depth. However, most specimens <strong>of</strong> L. longimanus were caught<br />
at 50 m and this trend might reflect nothing more than the depth <strong>of</strong> occurrence. <strong>The</strong> mean size<br />
at maturity for females was about 107 mm, which was probably overestimated given that this<br />
estimation was done with all the data available for females, including females caught outside<br />
the breeding season (Figure 23-4). This corresponded to a mean age at maturity <strong>of</strong> 18 months,<br />
hence also probably overestimated.<br />
Owing to the very narrow size range <strong>of</strong> females measured, it was impossible to assess<br />
the length-weight relationship. <strong>The</strong> fecundity-weight relationship is presented in Figure 23-5.<br />
Fecundity ranged from 57 to 99 for females weighing between 35 and 47 g. No relation was<br />
found between oocyte weight and body weight. <strong>The</strong> GSI threshold above which the oocyte<br />
weight did no longer increase significantly was estimated at about 4% (Figure 23-6). <strong>The</strong><br />
mean oocyte weight was 14.88 mg (± 1.97 SD, N= 4).<br />
104
% ripe females<br />
a<br />
% males in breeding colour<br />
b<br />
50<br />
45<br />
40<br />
35<br />
30<br />
25<br />
20<br />
15<br />
10<br />
5<br />
0<br />
60<br />
50<br />
40<br />
30<br />
20<br />
10<br />
0<br />
Jul-98<br />
Aug-98<br />
Sep-98<br />
Oct-98<br />
Nov-98<br />
Dec-98<br />
Jan-99<br />
Feb-99<br />
Mar-99<br />
Apr-99<br />
May-99<br />
8 27 1 80 25 13 46 6 2 2<br />
Jul-98<br />
Aug-98<br />
Sep-98<br />
Oct-98<br />
Nov-98<br />
Dec-98<br />
Jan-99<br />
Feb-99<br />
Mar-99<br />
Apr-99<br />
May-99<br />
7 32 35 25 5 44 2 4<br />
Figure 23-3. Seasonal progression <strong>of</strong> the percentage <strong>of</strong> ripe (stages 4 and 5) females (a) and<br />
males (b) Lethrinops longimanus in the SWA <strong>The</strong> values below the x-axis are the effective<br />
(number <strong>of</strong> male or females which size was above the size at maturity) for each month.<br />
100<br />
% mature females<br />
50<br />
0<br />
55 65 75 85 95 105 115 125 135<br />
Standard length (mm)<br />
Figure 23-4. Percentage <strong>of</strong> mature females (stage 3 and above) per size class (standard length)<br />
for Lethrinops longimanus in the SWA.<br />
105
Fecundity<br />
120<br />
100<br />
80<br />
60<br />
40<br />
20<br />
y = 2,9578x - 43,716<br />
R 2 = 0,8193<br />
0<br />
30 35 40 45 50<br />
Weight (g)<br />
Figure 23-5. Fecundity-weight relationship for Lethrinops longimanus females in the SWA.<br />
(R² = determination coefficient).<br />
Oocyte weight (mg)<br />
18<br />
16<br />
14<br />
12<br />
10<br />
8<br />
6<br />
4<br />
2<br />
0<br />
y = -0,4321x + 16,853<br />
R 2 = 0,0121<br />
0,0 1,0 2,0 3,0 4,0 5,0 6,0<br />
GSI (%)<br />
Figure 23-6. Relationship between oocyte weight and gonado-somatic index (GSI) for<br />
Lethrinops longimanus. Oocytes from females whose GSI was below (in grey) and above<br />
(in black with regression) 4%. (R² = determination coefficient).<br />
106
Lethrinops macrochir (Regan)<br />
L. macrochir is a rare species caught only at 10 m. It was usually absent from the<br />
catches, except for November to February and once in August. 42 females and 89 males were<br />
analysed, giving a sex ratio <strong>of</strong> F/M 0.3/0.7. Specimens caught ranged from 59 to 150 mm<br />
(Figure 24-1).<br />
Frequency %<br />
20<br />
18<br />
16<br />
14<br />
12<br />
10<br />
8<br />
6<br />
4<br />
2<br />
0<br />
57 62 67 72 77 82 87 92 97 102 107 112 117 122<br />
Standard length (mm)<br />
Figure 24-1. Size range and frequencies <strong>of</strong> Lethrinops macrochir caught in the SWA between<br />
July 1998 and May 1999.<br />
Among the rare species, L. macrochir was one for which we caught some ripe females,<br />
allowing an estimation <strong>of</strong> the fecundity-weight relationship (Figure 24-2) and oocyte weight<br />
(for females whose GSI was above 4%, which is the maximum encountered for the genus):<br />
11.87 mg (± 0.97 SD, N= 2).<br />
Fecundity<br />
180<br />
160<br />
140<br />
120<br />
100<br />
80<br />
60<br />
40<br />
20<br />
0<br />
y = 2,7129x + 12,68<br />
R 2 = 0,9968<br />
20 30 40 50 60<br />
Weight (g)<br />
Figure 24-2. Fecundity-weight relationship for Lethrinops macrochir females in the SWA. (R²<br />
= determination coefficient).<br />
107
Plate 14. Lethrinops 'oliveri' (by Dave Voorvelt).<br />
Overall mean catches (%)<br />
0 10 20 30<br />
75<br />
Depth (m)<br />
100<br />
125<br />
Weight<br />
Number<br />
Figure 25-1. Mean occurrence and abundance in the catches per depth <strong>of</strong> Lethrinops 'oliveri'<br />
in the SWA between July 1998 and May 1999.<br />
30<br />
25<br />
Frequency %<br />
20<br />
15<br />
10<br />
5<br />
0<br />
32 37 42 47 52 57 62 67 72 77 82 87 92 97<br />
Standard length (mm)<br />
Figure 25-2. Size range and frequencies <strong>of</strong> Lethrinops 'oliveri' caught in the SWA between<br />
July 1998 and May 1999.<br />
108
Lethrinops 'oliveri' (Plate 14)<br />
875 females and 1017 males were analysed. L. 'oliveri' was caught between 75 and<br />
125 m, with a decreasing occurrence and biomass with depth (Figure 25-1). It was a dominant<br />
species <strong>of</strong> the deep and very deep zones, constituting between 3 and 10% <strong>of</strong> the catches in<br />
number and between 8 and 22% in weight. <strong>The</strong> mean CPUE per depth category, 39.8 and 5.4<br />
kg for the deep and very deep zones, respectively, matched the value <strong>report</strong>ed by Tómasson &<br />
Banda (1996) for the deep zone (36.7 kg), but was about three times less for the very deep<br />
zone (16.7 kg). <strong>The</strong> depth distribution observed in our study was more restricted than that <strong>of</strong><br />
Tómasson & Banda (1996), who <strong>report</strong>ed L. 'oliveri' from 20 to 150 m. Specimens caught<br />
ranged between 33 and 98 mm (Figure 25-2). <strong>The</strong> sex ratio observed over the full sampling<br />
period was F/M 0.5/0.5.<br />
Breeding occurred throughout the year with a trough from October to December and a<br />
peak <strong>of</strong> activity from February to April (Figure 25-3a). As for L. gossei, the pr<strong>of</strong>ile <strong>of</strong> the<br />
percentage <strong>of</strong> ripe males followed exactly the female's one (Figure 25-3b). Ripe females and<br />
males were most abundant at 75 m, suggesting that spawning could occur mainly at this depth<br />
(Table 25-1). <strong>The</strong> mean size at maturity for females was about 60 mm (Figure 25-4), which<br />
corresponded to a mean age at maturity <strong>of</strong> 11 months.<br />
Table 25-1. Percentage <strong>of</strong> ripe females (stages 4 and 5), males in breeding colour and<br />
immature individuals (whose size is below the size at maturity) per depth for Lethrinops<br />
'oliveri' in the SWA.<br />
Depth<br />
Non ripe<br />
females<br />
Ripe females<br />
Males not in<br />
breeding colour<br />
Males in breeding<br />
colour<br />
Immature<br />
specimens<br />
75 m 45.3 46.5 37.2 67.7 43.5<br />
100 m 38.3 31.6 38.1 27.3 36.6<br />
125 m 16.3 21.9 24.7 5.1 19.9<br />
<strong>The</strong> length-weight and fecundity-weight relationships are presented in Figure 25-5 and<br />
25-6, respectively. Fecundity ranged from 19 to 81 for females weighing between 4 and 16 g.<br />
No relation was found between oocyte weight and body weight. <strong>The</strong> GSI threshold above<br />
which the oocyte weight did no longer increase significantly was 3% (Figure 25-7). <strong>The</strong> mean<br />
oocyte weight was 7.21 mg (± 1.61 SD, N= 45).<br />
109
% ripe females<br />
50<br />
45<br />
40<br />
35<br />
30<br />
25<br />
20<br />
15<br />
10<br />
5<br />
0<br />
a<br />
% males in breeding colour<br />
b<br />
70<br />
60<br />
50<br />
40<br />
30<br />
20<br />
10<br />
0<br />
Jun-98<br />
Jul-98<br />
Aug-98<br />
Sep-98<br />
Oct-98<br />
Nov-98<br />
Dec-98<br />
Jan-99<br />
Feb-99<br />
Mar-99<br />
Apr-99<br />
May-99<br />
5 56 114 40 53 61 120 32 129 31 91<br />
Jun-98<br />
Jul-98<br />
Aug-98<br />
Sep-98<br />
Oct-98<br />
Nov-98<br />
Dec-98<br />
Jan-99<br />
Feb-99<br />
Mar-99<br />
Apr-99<br />
May-99<br />
10 68 148 69 97 88 148 45 169 11 164<br />
Figure 25-3. Seasonal progression <strong>of</strong> the percentage <strong>of</strong> ripe (stages 4 and 5) females (a) and<br />
males (b) Lethrinops 'oliveri' in the SWA <strong>The</strong> values below the x-axis are the effective<br />
(number <strong>of</strong> male or females which size was above the size at maturity) for each month.<br />
100<br />
% mature females<br />
50<br />
0<br />
32 37 42 47 52 57 62 67 72 77 82 87 92 97<br />
Standard length (mm)<br />
Figure 25-4. Percentage <strong>of</strong> mature females (stage 3 and above) per size class (standard length)<br />
for Lethrinops 'oliveri' in the SWA.<br />
110
Weight (g)<br />
20<br />
18<br />
16<br />
14<br />
12<br />
10<br />
8<br />
6<br />
4<br />
2<br />
0<br />
y = 0,0005x 2,314<br />
R 2 = 0,7327<br />
40 50 60 70 80 90 100<br />
Length (mm)<br />
Figure 25-5. Length-weight relationship for Lethrinops 'oliveri' females in the SWA. (R² =<br />
determination coefficient).<br />
Fecundity<br />
90<br />
80<br />
70<br />
60<br />
50<br />
40<br />
30<br />
20<br />
10<br />
0<br />
y = 4,5704x + 3,0726<br />
R 2 = 0,4043<br />
0 5 10 15 20<br />
Weight (g)<br />
Figure 25-6. Fecundity-weight relationship for Lethrinops 'oliveri' females in the SWA. (R² =<br />
determination coefficient).<br />
12<br />
Oocyte weight (mg)<br />
10<br />
8<br />
6<br />
4<br />
2<br />
y = 0,4753x + 5,1611<br />
R 2 = 0,0634<br />
0<br />
0,0 1,0 2,0 3,0 4,0 5,0 6,0<br />
GSI (%)<br />
Figure 25-7. Relationship between oocyte weight and gonado-somatic index (GSI) for<br />
Lethrinops 'oliveri'. Oocytes from females whose GSI was below (in grey) and above (in<br />
black with regression) 3%. (R² = determination coefficient).<br />
111
Overall mean catches (%)<br />
0 2 4 6<br />
Depth (m)<br />
75<br />
100<br />
125<br />
Weight<br />
Number<br />
Figure 26-1. Mean occurrence and abundance in the catches per depth <strong>of</strong> Lethrinops polli in<br />
the SWA between July 1998 and May 1999.<br />
30<br />
25<br />
Frequency %<br />
20<br />
15<br />
10<br />
5<br />
0<br />
32 37 42 47 52 57 62 67 72 77 82 87 92 97 102 107 112 117<br />
Standard length (mm)<br />
Figure 26-2. Size range and frequencies <strong>of</strong> Lethrinops polli caught in the SWA between July<br />
1998 and May 1999.<br />
112
Lethrinops polli (Burgess & Axelrod)<br />
229 females and 198 males were analysed. L. polli was caught between 75 and 125 m,<br />
with a decreasing occurrence and biomass with depth (Figure 26-1). It was caught regularly in<br />
the deep and very deep zones, constituting between 0.1 and 3% <strong>of</strong> the catches in weight and<br />
between 0.3 and 5.6% in number. <strong>The</strong> mean CPUE per depth category, 12.3 and 0.3 kg for the<br />
deep and very deep zones, respectively, was about four times as much as the value <strong>report</strong>ed<br />
by Tómasson & Banda (1996) for the deep zone (3 kg), and about seven times less for the<br />
very deep zone (2.2 kg). As for L. 'oliveri', the depth distribution observed in our study was<br />
more restricted than that <strong>of</strong> Tómasson & Banda (1996), who <strong>report</strong>ed L. polli from 10 to 140<br />
m. Specimens caught ranged between 30 and 120 mm (Figure 26-2). <strong>The</strong> sex ratio observed<br />
over the full sampling period was F/M 0.5/0.5.<br />
Breeding season occurred from May to August-September, with an isolated activity in<br />
December, in the middle <strong>of</strong> the resting period (Figure 26-3a). As for L. gossei and L. 'oliveri',<br />
the pr<strong>of</strong>ile <strong>of</strong> the percentage <strong>of</strong> ripe males followed exactly the female's one (Figure 26-3b).<br />
Ripe females and males were clearly most abundant at 75 m, suggesting that spawning could<br />
occur mainly at this depth (Table 26-1). <strong>The</strong> mean size at maturity for females was about 65<br />
mm (Figure 26-4), which corresponded to a mean age at maturity <strong>of</strong> 10 months.<br />
Table 26-1. Percentage <strong>of</strong> ripe females (stages 4 and 5), males in breeding colour and<br />
immature individuals (whose size is below the size at maturity) per depth for Lethrinops<br />
polli in the SWA.<br />
Depth<br />
Non ripe<br />
females<br />
Ripe females<br />
Males not in<br />
breeding colour<br />
Males in breeding<br />
colour<br />
Immature<br />
specimens<br />
75 m 68.9 76.3 50.4 85.5 83.3<br />
100 m 28.9 21.1 41.1 10.1 5.6<br />
125 m 2.1 2.6 8.5 4.3 11.1<br />
<strong>The</strong> length-weight and fecundity-weight relationships are presented in Figure 26-5 and<br />
26-6, respectively. Fecundity ranged from 11 to 89 for females weighing between 9 and 35 g.<br />
No relation was found between oocyte weight and body weight. <strong>The</strong> GSI threshold above<br />
which the oocyte weight did no longer increase significantly was 3% (Figure 26-7). <strong>The</strong> mean<br />
oocyte weight was 12.26 mg (± 2.16 SD, N= 18).<br />
113
% ripe females<br />
80<br />
70<br />
60<br />
50<br />
40<br />
30<br />
20<br />
10<br />
0<br />
a<br />
Jun-98<br />
Jul-98<br />
Aug-98<br />
Sep-98<br />
Oct-98<br />
Nov-98<br />
Dec-98<br />
Jan-99<br />
Feb-99<br />
Mar-99<br />
Apr-99<br />
May-99<br />
1 27 19 34 26 5 28 12 26 8 42<br />
% males in breeding colour<br />
90<br />
80<br />
70<br />
60<br />
50<br />
40<br />
30<br />
20<br />
10<br />
0<br />
b<br />
Jun-98<br />
Jul-98<br />
Aug-98<br />
Sep-98<br />
Oct-98<br />
Nov-98<br />
Dec-98<br />
Jan-99<br />
Feb-99<br />
Mar-99<br />
Apr-99<br />
May-99<br />
7 27 15 20 22 8 23 20 15 10 31<br />
Figure 26-3. Seasonal progression <strong>of</strong> the percentage <strong>of</strong> ripe (stages 4 and 5) females (a) and<br />
males (b) Lethrinops polli in the SWA <strong>The</strong> values below the x-axis are the effective<br />
(number <strong>of</strong> male or females which size was above the size at maturity) for each month.<br />
100<br />
% mature females<br />
50<br />
0<br />
52 57 62 67 72 77 82 87 92<br />
Standard length (mm)<br />
Figure 26-4. Percentage <strong>of</strong> mature females (stage 3 and above) per size class (standard length)<br />
for Lethrinops polli in the SWA.<br />
114
Weight (g)<br />
40<br />
35<br />
30<br />
25<br />
20<br />
15<br />
10<br />
y = 3E-05x 2,9546<br />
5<br />
R 2 = 0,8425<br />
0<br />
50 60 70 80 90 100 110 120<br />
Length (mm)<br />
Figure 26-5. Length-weight relationship for Lethrinops polli females in the SWA. (R² =<br />
determination coefficient).<br />
Fecundity<br />
100<br />
90<br />
80<br />
70<br />
60<br />
50<br />
40<br />
30<br />
20<br />
10<br />
0<br />
y = 2,5654x + 2,6796<br />
R 2 = 0,5713<br />
0 10 20 30 40<br />
Weight (g)<br />
Figure 26-6. Fecundity-weight relationship for Lethrinops polli females in the SWA. (R² =<br />
determination coefficient).<br />
Oocyte weight (mg)<br />
18<br />
16<br />
14<br />
12<br />
10<br />
8<br />
6<br />
4<br />
y = 0,9759x + 8,4406<br />
2<br />
R 2 = 0,0776<br />
0<br />
0,0 1,0 2,0 3,0 4,0 5,0 6,0<br />
GSI (%)<br />
Figure 26-7. Relationship between oocyte weight and gonado-somatic index (GSI) for<br />
Lethrinops polli. Oocytes from females whose GSI was below (in grey) and above (in<br />
black with regression) 3%. (R² = determination coefficient).<br />
115
Plate 15. Mylochromis anaphyrmus (by Dave Voorvelt).<br />
Overall mean catches (%)<br />
0 2 4 6 8<br />
10<br />
Depth (m)<br />
30<br />
50<br />
75<br />
Weight<br />
Number<br />
Figure 27-1. Mean occurrence and abundance in the catches per depth <strong>of</strong> Mylochromis<br />
anaphyrmus in the SWA between July 1998 and May 1999.<br />
Frequency %<br />
9<br />
8<br />
7<br />
6<br />
5<br />
4<br />
3<br />
2<br />
1<br />
0<br />
42 47 52 57 62 67 72 77 82 87 92 97 102 107 112 117 122 127 132 137 142 147 152 157 162 167<br />
Standard length (mm)<br />
Figure 27-2. Size range and frequencies <strong>of</strong> Mylochromis anaphyrmus caught in the SWA<br />
between July 1998 and May 1999.<br />
116
Mylochromis spp.<br />
Mylochromis anaphyrmus (Burgess & Axelrod) (Plate 15)<br />
1375 females and 1058 males were analysed. M. anaphyrmus was caught from 10 to<br />
75 m, but mostly abundant at 10 and 30 m (Figure 27-1). Actually, a single specimen was<br />
caught at 75 m. It was a very common species in the shallow zone, constituting between 4 and<br />
7% <strong>of</strong> the catches in weight and between 2 and 6% in number. <strong>The</strong> mean CPUE per depth<br />
category, 23.3 kg for the shallows, was more than twice as much as the value found by<br />
Tómasson & Banda (1996) (9.8 kg). <strong>The</strong> depth distribution they <strong>report</strong>ed was very similar to<br />
the one we observed. Specimens caught ranged between 40 and 164 mm (Figure 27-2). <strong>The</strong><br />
sex ratio observed over the full sampling period was F/M 0.6/0.4.<br />
<strong>The</strong> breeding season was from January to October, with a peak between March and<br />
June, a steady decline in November, and ceasing in December (Figure 27-3a), even though<br />
occurrence <strong>of</strong> males in breeding colour was more erratic (Figure 27-3b). Ripe males and<br />
immature individuals were evenly distributed between 10 and 30 m (Table 27-1). However, as<br />
more than three quarters <strong>of</strong> the ripe females were found at 30 m, spawning probably occurs at<br />
30 m. Maturity was reached early in their second year at 17 months old, at a mean size <strong>of</strong> 105<br />
mm for females (Figure 27-4), which was less than the 160 mm TL (about 130 mm SL) and 3<br />
years old <strong>report</strong>ed by Tweddle & Turner (1977).<br />
Table 27-1. Percentage <strong>of</strong> ripe females (stages 4 and 5), males in breeding colour and<br />
immature individuals (whose size is below the size at maturity) per depth for Mylochromis<br />
anaphyrmus in the SWA.<br />
Depth<br />
Non ripe<br />
females<br />
Ripe females<br />
Males not in<br />
breeding colour<br />
Males in breeding<br />
colour<br />
Immature<br />
specimens<br />
10 m 25.8 11.4 35.6 48.9 39.4<br />
30 m 64.2 76.2 60.9 46.7 56.6<br />
50 m 10 12.4 3.5 4.4 4.1<br />
<strong>The</strong> length-weight and fecundity-weight relationships are presented in Figure 27-5 and<br />
27-6, respectively. Fecundity ranged from 58 to 236 for females weighing between 21 and 98<br />
g. No relation was found between oocyte weight and body weight. <strong>The</strong> GSI threshold above<br />
which the oocyte weight did no longer increase significantly was 3% (Figure 27-7). <strong>The</strong> mean<br />
oocyte weight was 11.13 mg (± 1.93 SD, N= 21).<br />
117
% ripe females<br />
a<br />
% males in breeding colour<br />
50<br />
45<br />
40<br />
35<br />
30<br />
25<br />
20<br />
15<br />
10<br />
5<br />
0<br />
50<br />
45<br />
40<br />
35<br />
30<br />
25<br />
20<br />
15<br />
10<br />
5<br />
-<br />
Jun-98<br />
Jul-98<br />
Aug-98<br />
Sep-98<br />
Oct-98<br />
Nov-98<br />
Dec-98<br />
Jan-99<br />
Feb-99<br />
Mar-99<br />
Apr-99<br />
May-99<br />
19 68 74 40 104 51 77 68 45 49 49<br />
Jun-98<br />
Jul-98<br />
Aug-98<br />
Sep-98<br />
Oct-98<br />
Nov-98<br />
Dec-98<br />
Jan-99<br />
Feb-99<br />
Mar-99<br />
Apr-99<br />
May-99<br />
b<br />
100 98 105 109 63 41 165 79 42 64 114<br />
Figure 27-3. Seasonal progression <strong>of</strong> the percentage <strong>of</strong> ripe (stages 4 and 5) females (a) and<br />
males (b) Mylochromis anaphyrmus in the SWA <strong>The</strong> values below the x-axis are the<br />
effective (number <strong>of</strong> male or females which size was above the size at maturity) for each<br />
month.<br />
100<br />
% mature females<br />
50<br />
0<br />
45 55 65 75 85 95 105 115 125 135 145 155<br />
Standard length (mm)<br />
Figure 27-4. Percentage <strong>of</strong> mature females (stage 3 and above) per size class (standard length)<br />
for Mylochromis anaphyrmus in the SWA.<br />
118
Weight (g)<br />
160<br />
140<br />
120<br />
100<br />
80<br />
60<br />
40<br />
20<br />
0<br />
y = 2E-05x 3,1127<br />
R 2 = 0,9759<br />
20 40 60 80 100 120 140 160 180<br />
Length (mm)<br />
Figure 27-5. Length-weight relationship for Mylochromis anaphyrmus females in the SWA.<br />
(R² = determination coefficient).<br />
250<br />
200<br />
Fecundity<br />
150<br />
100<br />
50<br />
0<br />
y = 1,9783x + 25,864<br />
R 2 = 0,7413<br />
0 20 40 60 80 100 120<br />
Weight (g)<br />
Figure 27-6. Fecundity-weight relationship for Mylochromis anaphyrmus females in the<br />
SWA. (R² = determination coefficient).<br />
16<br />
14<br />
Oocyte weight (mg)<br />
12<br />
10<br />
8<br />
6<br />
4<br />
2<br />
y = 1,5242x + 6,0293<br />
R 2 = 0,0812<br />
0<br />
1,0 1,5 2,0 2,5 3,0 3,5 4,0 4,5<br />
GSI (%)<br />
Figure 27-7. Relationship between oocyte weight and gonado-somatic index (GSI) for<br />
Mylochromis anaphyrmus. Oocytes from females whose GSI was below (in grey) and<br />
above (in black with regression) 3%. (R² = determination coefficient).<br />
119
Plate 16. Nyassachromis 'argyrosoma' (by Dave Voorvelt).<br />
% ripe females<br />
50<br />
45<br />
40<br />
35<br />
30<br />
25<br />
20<br />
15<br />
10<br />
5<br />
0<br />
a<br />
% males in breeding colour<br />
b<br />
50<br />
45<br />
40<br />
35<br />
30<br />
25<br />
20<br />
15<br />
10<br />
5<br />
0<br />
Oct-98<br />
Nov-98<br />
Dec-98<br />
Jan-99<br />
Feb-99<br />
Mar-99<br />
Apr-99<br />
May-99<br />
59 147 46 133 222 262 324 215<br />
Oct-98<br />
Nov-98<br />
Dec-98<br />
Jan-99<br />
Feb-99<br />
Mar-99<br />
Apr-99<br />
May-99<br />
116 303 170 105 296 185 167 221<br />
Figure 28-3. Seasonal progression <strong>of</strong> the percentage <strong>of</strong> ripe (stages 4 and 5) females (a) and<br />
males (b) Nyassachromis 'argyrosoma' in the SWA <strong>The</strong> values below the x-axis are the<br />
effective (number <strong>of</strong> male or females which size was above the size at maturity) for each<br />
month.<br />
120
Nyassachromis spp.<br />
Nyassachromis 'argyrosoma' (Plate 16)<br />
1440 females and 1563 males were analysed. N. 'argyrosoma' is a small species caught<br />
from 10 to 50 m, but was most abundant at 10 and 30 m (Figure 28-1).<br />
Overall mean catches (%)<br />
0 10 20 30 40 50<br />
10<br />
Depth (m)<br />
30<br />
50<br />
Weight<br />
Number<br />
Figure 28-1. Mean occurrence and abundance in the catches per depth <strong>of</strong> Nyassachromis<br />
'argyrosoma' in the SWA between July 1998 and May 1999.<br />
With Aulonocara 'blue orange' and Copadichromis virginalis, N. 'argyrosoma' was a<br />
numerically dominant species in the shallow zone, constituting about 23% <strong>of</strong> the catches in<br />
weight, and 41 and 43% in number at 10 and 30 m, respectively. <strong>The</strong> mean CPUE per depth<br />
category was 91.8 kg for the shallows. No reference to this species (under this name at least)<br />
was made in Tómasson & Banda (1996). Specimens caught ranged between 38 and 97 mm<br />
(Figure 28-2).<br />
35<br />
30<br />
Frequency %<br />
25<br />
20<br />
15<br />
10<br />
5<br />
0<br />
37 42 47 52 57 62 67 72 77 82 87 92 97<br />
Standard length (mm)<br />
Figure 28-2. Size range and frequencies <strong>of</strong> Nyassachromis 'argyrosoma' caught in the SWA<br />
between July 1998 and May 1999.<br />
<strong>The</strong> sex ratio observed over the full sampling period was F/M 0.5/0.5.<br />
121
100<br />
% mature females<br />
50<br />
0<br />
42 47 52 57 62 67 72 77 82 87 92<br />
Standard length (mm)<br />
Figure 28-4. Percentage <strong>of</strong> mature females (stage 3 and above) per size class (standard length)<br />
for Nyassachromis 'argyrosoma' in the SWA.<br />
Weight (g)<br />
14<br />
12<br />
10<br />
8<br />
6<br />
4<br />
2<br />
0<br />
y = 0,0003x 2,3822<br />
R 2 = 0,7256<br />
50 55 60 65 70 75 80 85 90<br />
Length (mm)<br />
Figure 28-5. Length-weight relationship for Nyassachromis 'argyrosoma' females in the<br />
SWA. (R² = determination coefficient).<br />
60<br />
50<br />
Fecundity<br />
40<br />
30<br />
20<br />
10<br />
0<br />
y = 3,2835x + 10,481<br />
R 2 = 0,449<br />
2 4 6 8 10 12 14<br />
Weight (g)<br />
Figure 28-6. Fecundity-weight relationship for Nyassachromis 'argyrosoma' females in the<br />
SWA. (R² = determination coefficient).<br />
122
Oocyte weight (mg)<br />
14<br />
12<br />
10<br />
8<br />
6<br />
4<br />
2<br />
0<br />
y = 0,77x - 1,0704<br />
R 2 = 0,3293<br />
0 2 4 6 8 10 12 14<br />
Body weight (g)<br />
Figure 28-7. Relationship between oocyte weight and body weight for Nyassachromis<br />
'argyrosoma' females in the SWA. (R² = determination coefficient).<br />
14<br />
12<br />
Oocyte weight (mg)<br />
10<br />
8<br />
6<br />
4<br />
2<br />
y = 0,0983x + 7,2789<br />
R 2 = 0,0007<br />
0<br />
0,0 1,0 2,0 3,0 4,0 5,0 6,0<br />
GSI (%)<br />
Figure 28-8. Relationship between oocyte weight and gonado-somatic index (GSI) for<br />
Nyassachromis 'argyrosoma'. Oocytes from females whose GSI was below (in grey) and<br />
above (in black with regression) 3.2%. (R² = determination coefficient).<br />
123
Ripe females (Figure 28-3a) and males (Figure 28-3b) were found at all the sampled<br />
months, with peaks in December and March and decreased activity in November and<br />
February. Owing to inconsistencies in species identification during the first three months <strong>of</strong><br />
sampling, data were removed from analyses. However, it is likely that breading occurred all<br />
year long. Three quarters <strong>of</strong> the ripe females and more than half the ripe males were found at<br />
10 m, the rest were at 30 m (Table 28-1), suggesting that spawning probably occurs between<br />
10 and 30 m and mostly at 10 m. As most immature individuals were caught at 30 and 50 m,<br />
it appears that after being released, juveniles migrate into deeper waters. <strong>The</strong> mean size at<br />
maturity was about 57 mm for females (Figure 28-4), which corresponded to a mean age at<br />
maturity <strong>of</strong> 10 months. <strong>The</strong> upper part <strong>of</strong> the sigmoïd curve does reach 100% after various<br />
steps, which is unexpected for an abundant species. Even though we had to take into account<br />
data from months outside the peaks <strong>of</strong> breeding activity to increase the sample size in each<br />
size class, an alternative explanation can not be excluded for this species. <strong>The</strong> taxonomy <strong>of</strong><br />
the Nyassachromis spp. complex is one <strong>of</strong> the most difficult and despite the particular<br />
attention given to this species on board, specimen <strong>of</strong> an other larger species might have been<br />
included, which would explain the significant occurrence <strong>of</strong> immature specimens above the<br />
mean size at maturity.<br />
Table 28-1. Percentage <strong>of</strong> ripe females (stages 4 and 5), males in breeding colour and<br />
immature individuals (whose size is below the size at maturity) per depth for<br />
Nyassachromis 'argyrosoma' in the SWA.<br />
Depth<br />
Non ripe<br />
females<br />
Ripe females<br />
Males not in<br />
breeding colour<br />
Males in breeding<br />
colour<br />
Immature<br />
specimens<br />
10 m 48.9 74.1 47.3 57.6 16.5<br />
30 m 51.1 25.9 45.8 30 31.7<br />
50 m 0 0 6.9 12.4 51.8<br />
<strong>The</strong> length-weight and fecundity-weight relationships are presented in Figure 28-5 and<br />
28-6, respectively. Fecundity ranged from 16 to 56 for females weighing between 3 and 13 g.<br />
A positive correlation was found between oocyte weight and body weight (Figure 28-7). This<br />
is the only species for which a relationship between oocyte weight and body weight was<br />
found and it might be due to identification inaccuracies. <strong>The</strong> GSI threshold above which the<br />
oocyte weight did no longer increase significantly was 3.2% (Figure 28-8). <strong>The</strong> mean oocyte<br />
weight was 7.66 mg (± 2.36 SD, N= 16). <strong>The</strong> standard deviation was very high for such a low<br />
mean oocyte weight, which was probably due to the fact that oocyte weight was correlated<br />
with body weight.<br />
124
20<br />
Frequency %<br />
15<br />
10<br />
5<br />
0<br />
77 82 87 92 97 102 107 112 117 122 127 132<br />
Standard length (mm)<br />
Figure 29-1. Size range and frequencies <strong>of</strong> Otopharynx 'productus' caught in the SWA<br />
between July 1998 and May 1999.<br />
25<br />
20<br />
Weight (g)<br />
15<br />
10<br />
5<br />
y = 0,0016x 2,0084<br />
R 2 = 0,838<br />
0<br />
70 80 90 100 110<br />
Length (mm)<br />
Figure 29-2. Length-weight relationship for Otopharynx 'productus' females in the SWA. (R²<br />
= determination coefficient).<br />
Fecundity<br />
70<br />
60<br />
50<br />
40<br />
30<br />
20<br />
10<br />
0<br />
y = 2,8372x - 7,8469<br />
R 2 = 0,8262<br />
5 10 15 20 25<br />
Weight (g)<br />
Figure 29-3. Fecundity-weight relationship for Otopharynx 'productus' females in the SWA.<br />
(R² = determination coefficient).<br />
125
Frequency %<br />
16<br />
14<br />
12<br />
10<br />
8<br />
6<br />
4<br />
2<br />
0<br />
55 65 75 85 95 105 115 125 135 145 155 165 175 185 195 205 215 225 235 245 255<br />
Standard length (mm)<br />
Figure 30-1. Size range and frequencies <strong>of</strong> Otopharynx speciosus caught in the SWA between<br />
July 1998 and May 1999.<br />
Weight (g)<br />
400<br />
350<br />
300<br />
250<br />
200<br />
150<br />
100<br />
50<br />
0<br />
y = 1E-05x 3,1606<br />
R 2 = 0,9954<br />
120 140 160 180 200 220 240<br />
Length (mm)<br />
Figure 30-2. Length-weight relationship for Otopharynx speciosus females in the SWA. (R² =<br />
determination coefficient).<br />
Fecundity<br />
350<br />
300<br />
250<br />
200<br />
150<br />
100<br />
50<br />
0<br />
y = 1,0452x - 25,644<br />
R 2 = 0,9918<br />
0 100 200 300 400<br />
Weight (g)<br />
Figure 30-3. Fecundity-weight relationship for Otopharynx speciosus females in the SWA.<br />
(R² = determination coefficient).<br />
126
Otopharynx spp.<br />
Otopharynx 'productus'<br />
O. 'productus' is a rare species encountered at 10 and 30 m. 27 females and 20 males<br />
were analysed, giving a sex ratio <strong>of</strong> F/M 0.6/0.4. Specimens caught ranged between 75 and<br />
134 mm (Figure 29-1). Among the rare species, O. 'productus' was one for which we caught<br />
some ripe females, allowing an estimation <strong>of</strong> the length-weight (Figure 29-2) and fecundityweight<br />
relationships (Figure 29-3). Fecundity ranged between 22 and 61 for females weighing<br />
between 9 and 22 g. <strong>The</strong> mean oocyte weight was impossible to assess from the few data<br />
available, but the largest oocytes weighed averaged 14.2 mg for a GSI <strong>of</strong> 2.8%.<br />
Otopharynx speciosus (Trewavas)<br />
Like O. 'productus', O. speciosus is not an abundant species and was essentially caught<br />
between 30 and 75 m. 61 females and 38 males were analysed, giving a sex ratio <strong>of</strong> F/M<br />
0.6/0.4. Specimens caught ranged between 55 and 260 mm (Figure 30-1). Among the rare<br />
species, O. 'productus' was also one for which we caught some ripe females, allowing an<br />
estimation <strong>of</strong> the length-weight (Figure 30-2) and fecundity-weight relationships (Figure 30-<br />
3). Fecundity ranged between 51 and 322 for females weighing between 85 and 337 g. <strong>The</strong><br />
mean oocyte weight was impossible to assess from the few data available, but the largest<br />
oocytes weighed averaged 25 mg for a GSI <strong>of</strong> 2.9%.<br />
127
Placidochromis spp.<br />
Placidochromis 'long'<br />
111 females and 180 males were analysed. P. 'long' is a small species caught from 10<br />
to 50 m, with an increasing occurrence and biomass with depth (Figure 31-1).<br />
Overall mean catches (%)<br />
0 1 2 3 4 5<br />
Depth (m)<br />
10<br />
30<br />
Weight<br />
Number<br />
50<br />
Figure 31-1. Mean occurrence and abundance in the catches per depth <strong>of</strong> Placidochromis<br />
'long' in the SWA between July 1998 and May 1999.<br />
It was most common at 50 m, where it constituted 1.6 and 4.3% <strong>of</strong> the catches in weight and<br />
number, respectively. <strong>The</strong> mean CPUE per depth category was 3.2 kg for the shallows. No<br />
reference to this species (under this name at least) was made in Tómasson & Banda (1996).<br />
Specimens caught ranged between 47 and 77 mm (Figure 31-2). <strong>The</strong> sex ratio observed over<br />
the full sampling period was F/M 0.4/0.6.<br />
Owing to low sample size or absence <strong>of</strong> data for some months, the precise<br />
determination <strong>of</strong> breeding season and size at maturity was not possible. Ripe females (Figure<br />
31-3a) and males (Figure 31-3b) were found only in October and in April-May and breeding<br />
season might occur from April-May to October.<br />
<strong>The</strong> length-weight and fecundity-weight relationships are presented in Figure 31-4 and<br />
31-5, respectively. Fecundity ranged from 17 to 38 for females weighing between 4.7 and 6.7<br />
g. No relationship was found between oocyte weight and body weight. <strong>The</strong> GSI threshold<br />
above which the oocyte weight no longer increased significantly was estimated at 2% (Figure<br />
31-6). <strong>The</strong> mean oocyte weight was 4.36 mg (± 1.30 SD, N= 10).<br />
128
Frequency %<br />
18<br />
16<br />
14<br />
12<br />
10<br />
8<br />
6<br />
4<br />
2<br />
0<br />
47 49 51 53 55 57 59 61 63 65 67 69 71 73 75 77<br />
Standard length (mm)<br />
Figure 31-2. Size range and frequencies <strong>of</strong> Placidochromis 'long' caught in the SWA between<br />
July 1998 and May 1999.<br />
30<br />
% ripe females<br />
a<br />
25<br />
20<br />
15<br />
10<br />
5<br />
0<br />
Oct-98<br />
Nov-98<br />
Dec-98<br />
Jan-99<br />
Feb-99<br />
Mar-99<br />
Apr-99<br />
May-99<br />
10 13 24 8 3 8 45<br />
% males in breeding colour<br />
100<br />
90<br />
80<br />
70<br />
60<br />
50<br />
40<br />
30<br />
20<br />
10<br />
0<br />
Oct-98<br />
Nov-98<br />
Dec-98<br />
b 14 25 36 11 7 4 1 82<br />
Jan-99<br />
Feb-99<br />
Mar-99<br />
Apr-99<br />
May-99<br />
Figure 31-3. Seasonal progression <strong>of</strong> the percentage <strong>of</strong> ripe (stages 4 and 5) females (a) and<br />
males (b) Placidochromis 'long' in the SWA <strong>The</strong> values below the x-axis are the effective<br />
(number <strong>of</strong> male or females which size was above the size at maturity) for each month.<br />
129
Weight (g)<br />
8<br />
7<br />
6<br />
5<br />
4<br />
3<br />
2<br />
1<br />
0<br />
y = 0,0019x 1,9262<br />
R 2 = 0,6995<br />
56 58 60 62 64 66 68<br />
Length (mm)<br />
Figure 31-4. Length-weight relationship for Placidochromis 'long' females in the SWA. (R² =<br />
determination coefficient).<br />
Fecundity<br />
40<br />
35<br />
30<br />
25<br />
20<br />
15<br />
10<br />
5<br />
0<br />
y = 6,8445x - 12,583<br />
R 2 = 0,3545<br />
4 4,5 5 5,5 6 6,5 7<br />
Weight (g)<br />
Figure 31-5. Fecundity-weight relationship for Placidochromis 'long' females in the SWA.<br />
(R² = determination coefficient).<br />
7<br />
6<br />
Oocyte weight (mg)<br />
5<br />
4<br />
3<br />
2<br />
1<br />
y = 0,9679x + 2,0288<br />
R 2 = 0,0943<br />
0<br />
1,5 2,0 2,5 3,0 3,5<br />
GSI (%)<br />
Figure 31-6. Relationship between oocyte weight and gonado-somatic index (GSI) for<br />
Placidochromis 'long'. Oocytes from females whose GSI was below (in grey) and above<br />
(in black with regression) 3.2%. (R² = determination coefficient).<br />
130
Overall mean catches (%)<br />
0 2 4 6<br />
Depth (m)<br />
75<br />
100<br />
Weight<br />
Number<br />
125<br />
Figure 32-1. Mean occurrence and abundance in the catches per depth <strong>of</strong> Placidochromis<br />
'platyrhynchos' in the SWA between July 1998 and May 1999.<br />
30<br />
25<br />
Frequency %<br />
20<br />
15<br />
10<br />
5<br />
0<br />
47 52 57 62 67 72 77 82 87 92 97 102 107 112<br />
Standard length (mm)<br />
Figure 32-2. Size range and frequencies <strong>of</strong> Placidochromis 'platyrhynchos' caught in the<br />
SWA between July 1998 and May 1999.<br />
131
Placidochromis 'platyrhynchos'<br />
263 females and 225 males were analysed. P. 'platyrhynchos' is a relatively small<br />
species caught from 75 to 125 m, with an increasing occurrence and biomass with depth<br />
(Figure 32-1). It was a very common species at 125 m, where it constituted 3.5 and 4.7% <strong>of</strong><br />
the catches in weight and number, respectively. <strong>The</strong> mean CPUE per depth category was 1.7<br />
kg for the deep zone and 6.2 kg for the very deep zone, which matched with the value<br />
<strong>report</strong>ed by Tómasson & Banda (1996) for the deep zone (1.4 kg) and was more than twice as<br />
much for the very deep zone (2.8 kg). Specimens caught ranged between 46 and 115 mm<br />
(Figure 32-2). <strong>The</strong> sex ratio observed over the full sampling period was F/M 0.5/0.5.<br />
Ripe females were found from July to August and from December to May (Figure 32-<br />
3a). Considering the very low sample size for June, it can be estimated than breeding season<br />
occurred from December to October, with a peak from January to May and a cessation in<br />
November. This pattern was confirmed by males data, excluding the months with very low<br />
sample size such as August and November (Figure 32-3b). Nearly all the ripe females and<br />
males and the immature individuals were caught at 125 m, suggesting that spawning could<br />
take place at this depth (Table 32-1). <strong>The</strong> mean size at maturity was about 80 mm (Figure 32-<br />
4), which was probably overestimated given that this estimation was with all the data<br />
available to increase the sample size, including data outside the breeding season. This<br />
corresponded to a mean age at maturity <strong>of</strong> 12 months.<br />
Table 32-1. Percentage <strong>of</strong> ripe females (stages 4 and 5), males in breeding colour and<br />
immature individuals (whose size is below the size at maturity) per depth for<br />
Placidochromis 'platyrhynchos' in the SWA.<br />
Depth<br />
Non ripe<br />
females<br />
Ripe females<br />
Males not in<br />
breeding colour<br />
Males in breeding<br />
colour<br />
Immature<br />
specimens<br />
75 m 0 0 1.2 0 0<br />
100 m 23.4 7.5 28.2 1.4 16.7<br />
125 m 76.6 92.5 70.6 98.6 83.3<br />
<strong>The</strong> length-weight and fecundity-weight relationships are presented in Figure 32-5 and<br />
32-6, respectively. Fecundity ranged from 23 to 93 for females weighing between 9 and 31 g.<br />
No relation was found between oocyte weight and body weight. <strong>The</strong> GSI threshold above<br />
which the oocyte weight did no longer increase significantly was 3.5% (Figure 32-7). <strong>The</strong><br />
mean oocyte weight was 13.83 mg (± 1.88 SD, N= 24).<br />
132
% ripe females<br />
a<br />
% males in breeding colour<br />
b<br />
100<br />
90<br />
80<br />
70<br />
60<br />
50<br />
40<br />
30<br />
20<br />
10<br />
0<br />
100<br />
90<br />
80<br />
70<br />
60<br />
50<br />
40<br />
30<br />
20<br />
10<br />
0<br />
Jun-98<br />
Jun-98<br />
Jul-98<br />
Aug-98<br />
Sep-98<br />
Oct-98<br />
Figure 32-3. Seasonal progression <strong>of</strong> the percentage <strong>of</strong> ripe (stages 4 and 5) females (a) and<br />
males (b) Placidochromis 'platyrhynchos' in the SWA <strong>The</strong> values below the x-axis are the<br />
effective (number <strong>of</strong> male or females which size was above the size at maturity) for each<br />
month.<br />
Nov-98<br />
Dec-98<br />
Jan-99<br />
Feb-99<br />
Mar-99<br />
Apr-99<br />
May-99<br />
4 39 16 30 13 22 12 27 23 18 30<br />
Jul-98<br />
Aug-98<br />
Sep-98<br />
Oct-98<br />
Nov-98<br />
Dec-98<br />
Jan-99<br />
Feb-99<br />
Mar-99<br />
Apr-99<br />
May-99<br />
26 1 49 1 17 21 17 31 15 47<br />
100<br />
% mature females<br />
50<br />
0<br />
52 57 62 67 72 77 82 87 92 97 102 107 112<br />
Standard length (mm)<br />
Figure 32-4. Percentage <strong>of</strong> mature females (stage 3 and above) per size class (standard length)<br />
for Placidochromis 'platyrhynchos' in the SWA.<br />
133
Weight (g)<br />
35<br />
30<br />
25<br />
20<br />
15<br />
10<br />
5<br />
0<br />
y = 4E-05x 2,8938<br />
R 2 = 0,8149<br />
60 70 80 90 100 110 120<br />
Length (mm)<br />
Figure 32-5. Length-weight relationship for Placidochromis 'platyrhynchos' females in the<br />
SWA. (R² = determination coefficient).<br />
Fecundity<br />
100<br />
90<br />
80<br />
70<br />
60<br />
50<br />
40<br />
30<br />
20<br />
10<br />
0<br />
y = 1,8798x + 14,85<br />
R 2 = 0,2775<br />
5 10 15 20 25 30 35<br />
Weight (g)<br />
Figure 32-6. Fecundity-weight relationship for Placidochromis 'platyrhynchos' females in the<br />
SWA. (R² = determination coefficient).<br />
25<br />
Oocyte weight (mg)<br />
20<br />
15<br />
10<br />
5<br />
y = 0,8026x + 10,028<br />
R 2 = 0,1582<br />
0<br />
0,0 1,0 2,0 3,0 4,0 5,0 6,0 7,0<br />
GSI (%)<br />
Figure 32-7. Relationship between oocyte weight and gonado-somatic index (GSI) for<br />
Placidochromis 'platyrhynchos'. Oocytes from females whose GSI was below (in grey) and<br />
above (in black with regression) 3.5%. (R² = determination coefficient).<br />
134
Overall mean catches (%)<br />
0 1 2 3 4 5<br />
Depth (m)<br />
10<br />
30<br />
Weight<br />
Number<br />
Figure 33-1. Mean occurrence and abundance in the catches per depth <strong>of</strong> Pseudotropheus<br />
livingstonii in the SWA between July 1998 and May 1999.<br />
25<br />
20<br />
Frequency %<br />
15<br />
10<br />
5<br />
0<br />
37 39 41 43 45 47 49 51 53 55 57 59 61 63<br />
Standard length (mm)<br />
Figure 33-2. Size range and frequencies <strong>of</strong> Pseudotropheus livingstonii caught in the SWA<br />
between July 1998 and May 1999.<br />
135
Pseudotropheus spp.<br />
Pseudotropheus livingstonii (Boulenger)<br />
68 females and 124 males were analysed. Ps. livingstonii is a small species principally<br />
caught at 10 and sometimes at 30 m (Figure 33-1). It constituted 1.4 and 4% <strong>of</strong> the catches in<br />
weight and number, respectively. <strong>The</strong> mean CPUE per depth category was 1.8 kg for the<br />
shallow zone, which was about five times less than the value <strong>report</strong>ed by Tómasson & Banda<br />
(1996) (9.8 kg). Specimens caught ranged between 37 and 63 mm (Figure 33-2). <strong>The</strong> sex ratio<br />
observed over the full sampling period was F/M 0.4/0.6.<br />
As Ps. Livingstonii was sometimes relatively abundant and sometimes absent from the<br />
catches for a few months, precise determination <strong>of</strong> the breeding season was impossible. Each<br />
time it was present in the catches (October, November, March, April, May), ripe females were<br />
found (Figure 33-3a), which was not always the case for males in breeding colour (Figure 33-<br />
3b). Maturity was reached at about 37 mm for females (Figure 33-4).<br />
<strong>The</strong> length-weight and fecundity-weight relationships are presented in Figure 33-5 and<br />
33-6, respectively. Fecundity ranged from 15 to 33 for females weighing between 3 and 5 g.<br />
No relation was found between oocyte weight and body weight. <strong>The</strong> GSI threshold above<br />
which the oocyte weight did no longer increase significantly was estimated at about 2%<br />
(Figure 33-7). <strong>The</strong> mean oocyte weight was 5.45 mg (± 0.59 SD, N= 7).<br />
136
60<br />
% mature females<br />
50<br />
40<br />
30<br />
20<br />
10<br />
a<br />
% males in breeding colour<br />
b<br />
90<br />
80<br />
70<br />
60<br />
50<br />
40<br />
30<br />
20<br />
10<br />
0<br />
0<br />
Oct-98<br />
Oct-98<br />
Nov-98<br />
Dec-98<br />
Jan-99<br />
Figure 33-3. Seasonal progression <strong>of</strong> the percentage <strong>of</strong> ripe (stages 4 and 5) females (a) and<br />
males (b) Pseudotropheus livingstonii in the SWA <strong>The</strong> values below the x-axis are the<br />
effective (number <strong>of</strong> male or females which size was above the size at maturity) for each<br />
month.<br />
Feb-99<br />
Mar-99<br />
Apr-99<br />
May-99<br />
11 4 20 9 24<br />
Nov-98<br />
Dec-98<br />
Jan-99<br />
Feb-99<br />
Mar-99<br />
Apr-99<br />
May-99<br />
22 7 1 1 22 17 54<br />
100<br />
% mature females<br />
50<br />
0<br />
32 37 42 47 52 57 62<br />
Standard length (mm)<br />
Figure 33-4. Percentage <strong>of</strong> mature females (stage 3 and above) per size class (standard length)<br />
for Pseudotropheus livingstonii in the SWA.<br />
137
Weight (g)<br />
6<br />
5<br />
4<br />
3<br />
2<br />
1<br />
0<br />
y = 7E-05x 2,8076<br />
R 2 = 0,4355<br />
45 46 47 48 49 50 51 52 53<br />
Length (mm)<br />
Figure 33-5. Length-weight relationship for Pseudotropheus livingstonii females in the SWA.<br />
(R² = determination coefficient).<br />
Fecundity<br />
35<br />
30<br />
25<br />
20<br />
15<br />
10<br />
5<br />
0<br />
y = 6,4275x + 1,2343<br />
R 2 = 0,3916<br />
3 3,5 4 4,5 5<br />
Weight (g)<br />
Figure 33-6. Fecundity-weight relationship for Pseudotropheus livingstonii females in the<br />
SWA. (R² = determination coefficient).<br />
7<br />
6<br />
Oocyte weight (mg)<br />
5<br />
4<br />
3<br />
2<br />
y = 0,0035x + 5,4322<br />
1<br />
R 2 = 6E-05<br />
0<br />
0,0 1,0 2,0 3,0 4,0 5,0 6,0 7,0<br />
GSI (%)<br />
Figure 33-7. Relationship between oocyte weight and gonado-somatic index (GSI) for<br />
Pseudotropheus livingstonii. Oocytes from females whose GSI was below (in grey) and<br />
above (in black with regression) 2%. (R² = determination coefficient).<br />
138
Weight (g)<br />
35<br />
30<br />
25<br />
20<br />
15<br />
10<br />
y = 0,0064x 1,782<br />
5<br />
R 2 = 0,6384<br />
0<br />
80 85 90 95 100 105 110 115<br />
Length (mm)<br />
Figure 34-3. Length-weight relationship for Sciaenochromis ahli females in the SWA. (R² =<br />
determination coefficient).<br />
Fecundity<br />
100<br />
90<br />
80<br />
70<br />
60<br />
50<br />
40<br />
30<br />
20<br />
10<br />
0<br />
y = 4,4172x - 55,843<br />
R 2 = 0,6611<br />
15 20 25 30 35<br />
Weight (g)<br />
Figure 34-4. Fecundity-weight relationship for Sciaenochromis ahli females in the SWA. (R²<br />
= determination coefficient).<br />
25<br />
Oocytes weight (mg)<br />
20<br />
15<br />
10<br />
5<br />
0<br />
0,0 1,0 2,0 3,0 4,0 5,0<br />
GSI (%)<br />
Figure 34-5. Relationship between oocyte weight and gonado-somatic index (GSI) for<br />
Sciaenochromis ahli. Oocytes from females whose GSI was below (in grey) and above (in<br />
black with regression) 3.5%. (R² = determination coefficient).<br />
139
Sciaenochromis spp.<br />
Sciaenochromis ahli (Trewavas)<br />
38 females and 37 males were analysed. S. ahli is a relatively small species<br />
encountered at every depth from 10 to 125 m but never numerous in any <strong>of</strong> them. <strong>The</strong> mean<br />
CPUE per depth category was 0.9, 0.8 and 0.3 kg for the shallow, deep and very deep zones,<br />
respectively. No reference to this species (under this name at least) was made in Tómasson &<br />
Banda (1996). Specimens caught ranged between 62 and 124 mm (Figure 34-1).<br />
30<br />
25<br />
Frequency %<br />
20<br />
15<br />
10<br />
5<br />
0<br />
62 67 72 77 82 87 92 97 102 107 112 117 122<br />
Standard length (mm)<br />
Figure 34-1. Size range and frequencies <strong>of</strong> Sciaenochromis ahli caught in the SWA between<br />
July 1998 and May 1999.<br />
<strong>The</strong> sex ratio observed over the full sampling period was F/M 0.5/0.5.<br />
Owing to low sample size or absence <strong>of</strong> data for some months, the precise<br />
determination <strong>of</strong> breeding season and size at maturity was not possible. Ripe females were<br />
found at each sampling date except when sample size were almost null (March and April)<br />
(Figure 34-2). Only three males in breeding colour were found, in November and May, all at<br />
75 m. Breeding season could then occur at least from October to May.<br />
% mature females<br />
100<br />
90<br />
80<br />
70<br />
60<br />
50<br />
40<br />
30<br />
20<br />
10<br />
0<br />
Oct-98<br />
Nov-98<br />
Dec-98<br />
Jan-99<br />
Feb-99<br />
Mar-99<br />
Apr-99<br />
May-99<br />
11 10 5 4 1 1 1 5<br />
Figure 34-2. Seasonal progression <strong>of</strong> the percentage <strong>of</strong> ripe (stages 4 and 5) females<br />
Sciaenochromis ahli in the SWA <strong>The</strong> values below the x-axis are the sample size for each<br />
month.<br />
140
Overall mean catches (%)<br />
0,0 0,5 1,0 1,5<br />
10<br />
Depth (m)<br />
30<br />
50<br />
75<br />
100<br />
125<br />
Weight<br />
Number<br />
Figure 35-1. Mean occurrence and abundance in the catches per depth <strong>of</strong> Sciaenochromis<br />
benthicola in the SWA between July 1998 and May 1999.<br />
30<br />
25<br />
Frequency %<br />
20<br />
15<br />
10<br />
5<br />
0<br />
45 55 65 75 85 95 105 115 125 135 145 155 165<br />
Standard length (mm)<br />
Figure 35-2. Size range and frequencies <strong>of</strong> Sciaenochromis benthicola caught in the SWA<br />
between July 1998 and May 1999.<br />
141
<strong>The</strong> length-weight and fecundity-weight relationships are presented in Figure 34-3 and<br />
34-4, respectively. Fecundity ranged from 35 to 90 for females weighing between 19 and 31<br />
g. No relation was found between oocyte weight and body weight. <strong>The</strong> GSI threshold above<br />
which the oocyte weight did no longer increase significantly was impossible to assess because<br />
<strong>of</strong> low sample size. However, despite the fact that oocyte weight apparently still increased<br />
with GSI above 3.5% (Figure 34-5), the mean oocyte weight was estimated from the three<br />
females whose GSI was above 3.5%, and was 19.11 mg (± 1.25 SD, N= 3).<br />
Sciaenochromis benthicola (Konings)<br />
188 females and 182 males were analysed. S. benthicola was encountered at every<br />
depth from 10 to 125 m but was more frequent at 50 and 75 m, where it constituted 1 to 1.3%<br />
<strong>of</strong> the catches in weight and 0.4 to 1.4% in number, respectively (Figure 35-1). <strong>The</strong> mean<br />
CPUE per depth category was 5.6, 2.4 kg and almost nothing for the shallow, deep and very<br />
deep zones, respectively. No reference to this species (under this name at least) was made in<br />
Tómasson & Banda (1996). Specimens caught ranged between 48 and 168 mm (Figure 35-2).<br />
<strong>The</strong> sex ratio observed over the full sampling period was F/M 0.5/0.5.<br />
Owing to low sample size or absence <strong>of</strong> data for some months, the precise<br />
determination <strong>of</strong> breeding season was not possible. Ripe females were found in June, August<br />
and from November to February, with peaks in August and December (Figure 35-3a). Data<br />
for males gave approximately the same pattern except for the period from June to August,<br />
when no ripe males were found (Figure 35-3b). 100% <strong>of</strong> the ripe females and 91% <strong>of</strong> the<br />
males in breeding colour were found at 50 and 75 m, suggesting that spawning could occur at<br />
these depths. <strong>The</strong> mean size at maturity was about 100 mm for females (Figure 35-4). Size at<br />
maturity has to be determined at the height <strong>of</strong> the breeding season to be accurate, but owing to<br />
the low sample size we had to consider every data available. As a consequence, females<br />
caught outside the peak <strong>of</strong> breeding season were included in the analyses, even large resting<br />
females, which explains the shape <strong>of</strong> the upper part <strong>of</strong> the curve.<br />
<strong>The</strong> length-weight and fecundity-weight relationships are presented in Figure 35-5 and<br />
35-6, respectively. Fecundity ranged from 32 to 99 for females weighing between 26 and 69<br />
g. No relation was found between oocyte weight and body weight. <strong>The</strong> GSI threshold above<br />
which the oocyte weight no longer increased significantly was 3% (Figure 35-7). <strong>The</strong> mean<br />
oocyte weight was 27.31 mg (± 4.12 SD, N= 13).<br />
142
% ripe females<br />
a<br />
% males in breeding colour<br />
b<br />
60<br />
50<br />
40<br />
30<br />
20<br />
10<br />
0<br />
30<br />
25<br />
20<br />
15<br />
10<br />
5<br />
0<br />
Jun-98<br />
Jul-98<br />
Aug-98<br />
Sep-98<br />
Oct-98<br />
Nov-98<br />
Dec-98<br />
Jan-99<br />
Feb-99<br />
Mar-99<br />
Apr-99<br />
May-99<br />
17 6 17 22 26 18 25 49 9 6<br />
Jun-98<br />
Jul-98<br />
Aug-98<br />
Sep-98<br />
Oct-98<br />
Nov-98<br />
Dec-98<br />
Jan-99<br />
Feb-99<br />
Mar-99<br />
Apr-99<br />
May-99<br />
11 14 5 28 14 24 28 30 5 8 15<br />
Figure 35-3. Seasonal progression <strong>of</strong> the percentage <strong>of</strong> ripe (stages 4 and 5) females (a) and<br />
males (b) Sciaenochromis benthicola in the SWA <strong>The</strong> values below the x-axis are the<br />
effective (number <strong>of</strong> male or females which size was above the size at maturity) for each<br />
month.<br />
100<br />
% mature females<br />
50<br />
0<br />
82 87 92 97 102 107 112 117 122 127 132 137 142 147 152 157<br />
Standard length (mm)<br />
Figure 35-4. Percentage <strong>of</strong> mature females (stage 3 and above) per size class (standard length)<br />
for Sciaenochromis benthicola in the SWA.<br />
143
Weight (g)<br />
100<br />
90<br />
80<br />
70<br />
60<br />
50<br />
40<br />
30<br />
20<br />
10<br />
0<br />
y = 2E-05x 3,0263<br />
R 2 = 0,9874<br />
0 50 100 150 200<br />
Length (mm)<br />
Figure 35-5. Length-weight relationship for Sciaenochromis benthicola females in the SWA.<br />
(R² = determination coefficient).<br />
120<br />
100<br />
Fecundity<br />
80<br />
60<br />
40<br />
20<br />
y = 1,264x - 0,3265<br />
R 2 = 0,5579<br />
0<br />
20 30 40 50 60 70 80<br />
Weight (g)<br />
Figure 35-6. Fecundity-weight relationship for Sciaenochromis benthicola females in the<br />
SWA. (R² = determination coefficient).<br />
Oocyte weight (mg)<br />
35<br />
30<br />
25<br />
20<br />
15<br />
10<br />
5<br />
0<br />
y = 1,8563x + 19,776<br />
R 2 = 0,1418<br />
0,0 1,0 2,0 3,0 4,0 5,0 6,0<br />
GSI (%)<br />
Figure 35-7. Relationship between oocyte weight and gonado-somatic index (GSI) for<br />
Sciaenochromis benthicola. Oocytes from females whose GSI was below (in grey) and<br />
above (in black with regression) 3%. (R² = determination coefficient).<br />
144
Stigmatochromis spp.<br />
Stigmatochromis 'guttatus'<br />
62 females and 22 males were analysed. S. 'guttatus' was encountered at every depth<br />
from 10 to 125 m but was never abundant in any <strong>of</strong> them although it occurred more frequently<br />
at 50 and 75 m. Specimens caught ranged between 64 and 147 mm (Figure 36-1). <strong>The</strong> sex<br />
ratio observed over the full sampling period was F/M 0.7/0.3.<br />
Owing to low sample size or absence <strong>of</strong> data for some months, the precise<br />
determination <strong>of</strong> breeding season was not possible. Ripe females were found from October to<br />
December, in February and in April-May (Figure 36-2). <strong>The</strong> six males in breeding colour we<br />
found were caught at 50 m in March. <strong>The</strong> mean size at maturity was about 100 mm for<br />
females (Figure 36-3), which was probably overestimated as this estimation was not done<br />
during the height <strong>of</strong> the breeding season but with all the data available for females, to increase<br />
the sample size.<br />
<strong>The</strong> length-weight and fecundity-weight relationships are presented in Figure 36-4 and<br />
36-5, respectively. Fecundity ranged from 21 to 64 for females weighing between 20 and 46<br />
g. No relation was found between oocyte weight and body weight. <strong>The</strong> GSI threshold above<br />
which the oocyte weight did no longer increase significantly was 3% (Figure 36-6). <strong>The</strong> mean<br />
oocyte weight was 29.09 mg (± 2.97 SD, N= 4).<br />
145
Frequency %<br />
30<br />
25<br />
20<br />
15<br />
10<br />
5<br />
0<br />
67 72 77 82 87 92 97 102 107 112 117 122 127 132<br />
Standard length (mm)<br />
Figure 36-1. Size range and frequencies <strong>of</strong> Stigmatochromis 'guttatus' caught in the SWA<br />
between July 1998 and May 1999.<br />
% ripe females<br />
100<br />
90<br />
80<br />
70<br />
60<br />
50<br />
40<br />
30<br />
20<br />
10<br />
0<br />
Oct-98<br />
Nov-98<br />
Dec-98<br />
Jan-99<br />
Figure 36-2. Seasonal progression <strong>of</strong> the percentage <strong>of</strong> ripe (stages 4 and 5) females<br />
Stigmatochromis 'guttatus' in the SWA <strong>The</strong> values below the x-axis are the effective<br />
(number <strong>of</strong> male or females which size was above the size at maturity) for each month.<br />
Feb-99<br />
Mar-99<br />
Apr-99<br />
12 5 5 2 15 14 8 1<br />
May-99<br />
100<br />
% mature females<br />
50<br />
0<br />
67 72 77 82 87 92 97 102 107 112 117 122 127 132<br />
Standard length (mm)<br />
Figure 36-3. Percentage <strong>of</strong> mature females (stage 3 and above) per size class (standard length)<br />
for Stigmatochromis 'guttatus' in the SWA.<br />
146
Weight (g)<br />
50<br />
45<br />
40<br />
35<br />
30<br />
25<br />
20<br />
15<br />
10<br />
5<br />
0<br />
y = 0,0001x 2,6693<br />
R 2 = 0,8511<br />
90 100 110 120 130<br />
Length (mm)<br />
Figure 36-4. Length-weight relationship for Stigmatochromis 'guttatus' females in the SWA.<br />
(R² = determination coefficient).<br />
70<br />
60<br />
50<br />
Fecundity<br />
40<br />
30<br />
20<br />
10<br />
y = 1,4769x - 8,0045<br />
R 2 = 0,8872<br />
0<br />
10 20 30 40 50<br />
Weight (g)<br />
Figure 36-5. Fecundity-weight relationship for Stigmatochromis 'guttatus' females in the<br />
SWA. (R² = determination coefficient).<br />
35<br />
30<br />
Oocyte weight (mg)<br />
25<br />
20<br />
15<br />
10<br />
5<br />
y = 2,6415x + 18,855<br />
R 2 = 0,1457<br />
0<br />
0,0 1,0 2,0 3,0 4,0 5,0<br />
GSI (%)<br />
Figure 36-6. Relationship between oocyte weight and gonado-somatic index (GSI) for<br />
Stigmatochromis 'guttatus'. Oocytes from females whose GSI was below (in grey) and<br />
above (in black with regression) 3%. (R² = determination coefficient).<br />
147
Taeniolethrinops spp.<br />
Taeniolethrinops furcicauda (Trewavas) (Plate 17)<br />
135 females and 88 males were analysed. T. furcicauda was mostly encountered at 10<br />
m where it made up to 1.2 and 1.6% <strong>of</strong> the catches in number and weight, respectively. It was<br />
also found sometimes at 30 m. Specimens caught ranged between 65 and 178 mm (Figure 37-<br />
1).<br />
50<br />
Frequency %<br />
40<br />
30<br />
20<br />
10<br />
0<br />
65 75 85 95 105 115 125 135 145 155 165 175<br />
Standard length (mm)<br />
Figure 37-1. Size range and frequencies <strong>of</strong> Taeniolethrinops furcicauda caught in the SWA<br />
between July 1998 and May 1999.<br />
<strong>The</strong> sex ratio observed over the full sampling period was F/M 0.6/0.4.<br />
Owing to low sample size or absence <strong>of</strong> data for some months, the precise<br />
determination <strong>of</strong> breeding season was not possible. Ripe females were only found in July<br />
(Figure 37-2), as was the single male in breeding colour caught. <strong>The</strong> mean size at maturity<br />
was about 130 mm for females (Figure 37-3), which was probably overestimated as this<br />
estimation was not done during the height <strong>of</strong> the breeding season but with all the data<br />
available for females, to increase the sample size.<br />
<strong>The</strong> length-weight relationship is not given because <strong>of</strong> the too narrow size range <strong>of</strong><br />
females measured. <strong>The</strong> fecundity-weight relationship is presented in Figure 37-4. Fecundity<br />
ranged from 138 to 219 for females weighing between 88 and 109 g and was not correlated to<br />
body weight. No relation was found between oocyte weight and body weight. <strong>The</strong> GSI<br />
threshold above which the oocyte weight did no longer increase significantly was difficult to<br />
assess owing to low sample size. However, as the oocyte weight did no longer increase above<br />
a GSI <strong>of</strong> 1.5% (Figure 37-5), the mean oocyte weight was estimated (probably<br />
underestimated) at 10.13 mg (± 0.83 SD, N= 3).<br />
148
Plate 17. Taeniolethrinops furcicauda (by Dave Voorvelt).<br />
% ripe females<br />
90<br />
80<br />
70<br />
60<br />
50<br />
40<br />
30<br />
20<br />
10<br />
0<br />
Jul-98<br />
Aug-98<br />
Sep-98<br />
Oct-98<br />
Nov-98<br />
Dec-98<br />
Jan-99<br />
Feb-99<br />
Mar-99<br />
Apr-99<br />
May-99<br />
7 9 1 2 14 11 27 64<br />
Figure 37-2. Seasonal progression <strong>of</strong> the percentage <strong>of</strong> ripe (stages 4 and 5) females<br />
Taeniolethrinops furcicauda in the SWA <strong>The</strong> values below the x-axis are the effective for<br />
each month.<br />
149
100<br />
% mature females<br />
50<br />
0<br />
70 80 90 100 110 120 130 140 150 160 170<br />
Standard length (mm)<br />
Figure 37-3. Percentage <strong>of</strong> mature females (stage 3 and above) per size class (standard length)<br />
for Taeniolethrinops furcicauda in the SWA.<br />
250<br />
200<br />
Fecundity<br />
150<br />
100<br />
50<br />
y = 0,5165x + 135,84<br />
R 2 = 0,0209<br />
0<br />
80 85 90 95 100 105 110 115<br />
Weight (g)<br />
Figure 37-4. Fecundity-weight relationship for Taeniolethrinops furcicauda females in the<br />
SWA. (R² = determination coefficient).<br />
12<br />
Oocyte weight (mg)<br />
10<br />
8<br />
6<br />
4<br />
2<br />
y = -0,0077x + 10,148<br />
R 2 = 8E-06<br />
0<br />
0,0 0,5 1,0 1,5 2,0 2,5<br />
GSI (%)<br />
Figure 37-5. Relationship between oocyte weight and gonado-somatic index (GSI) for<br />
Taeniolethrinops furcicauda. Oocytes from females whose GSI was below (in grey) and<br />
above (in black with regression) 1.5%. (R² = determination coefficient).<br />
150
Taeniolethrinops praeorbitalis (Regan) (Plate 18)<br />
85 females and 78 males were analysed. T. praeorbitalis was encountered at 10 m and<br />
30 m, but was never frequent at any depth. Specimens caught ranged between 71 and 199 mm<br />
(Figure 38-1).<br />
25<br />
Frequency %<br />
20<br />
15<br />
10<br />
5<br />
0<br />
75 85 95 105 115 125 135 145 155 165 175 185 195<br />
Standard length (mm)<br />
Figure 38-1. Size range and frequencies <strong>of</strong> Taeniolethrinops praeorbitalis caught in the SWA<br />
between July 1998 and May 1999.<br />
<strong>The</strong> sex ratio observed over the full sampling period was F/M 0.5/0.5.<br />
Owing to low sample size or absence <strong>of</strong> data for some months, the precise<br />
determination <strong>of</strong> breeding season was not possible. Ripe females were only found in August,<br />
and no male in breeding colour was ever caught. <strong>The</strong> mean size at maturity was about 155<br />
mm for females (Figure 38-2), which was probably overestimated as this estimation was not<br />
done during the height <strong>of</strong> the breeding season but with all the data available for females, to<br />
increase the sample size. <strong>The</strong> first inflexion <strong>of</strong> the lower part <strong>of</strong> the curve came from the<br />
August data and it is likely that the mean size at maturity would rather be around 130 mm.<br />
<strong>The</strong> length-weight and fecundity-weight relationships are presented in Figure 38-3 and<br />
38-4, respectively. Fecundity ranged from 193 to 250 for females weighing between 135 and<br />
184 g. No relation was found between oocyte weight and body weight. <strong>The</strong> GSI threshold<br />
above which the oocyte weight did no longer increase significantly was estimated from the<br />
few data available at about 3% (Figure 38-5) and the mean oocyte weight was 25.73 mg (±<br />
2.02 SD, N= 3).<br />
151
Plate 18. Taeniolethrinops praeorbitalis (by Dave Voorvelt).<br />
100<br />
% mature females<br />
50<br />
0<br />
85 95 105 115 125 135 145 155 165 175 185 195<br />
Standard length (mm)<br />
Figure 38-2. Percentage <strong>of</strong> mature females (stage 3 and above) per size class (standard length)<br />
for Taeniolethrinops praeorbitalis in the SWA.<br />
152
250<br />
200<br />
Weight (g)<br />
150<br />
100<br />
50<br />
y = 2E-05x 3,0304<br />
R 2 = 0,9549<br />
0<br />
60 80 100 120 140 160 180 200<br />
Length (mm)<br />
Figure 38-3. Length-weight relationship for Taeniolethrinops praeorbitalis females in the<br />
SWA. (R² = determination coefficient).<br />
Fecundity<br />
280<br />
260<br />
240<br />
220<br />
200<br />
180<br />
160<br />
140<br />
120<br />
100<br />
y = 0,9672x + 74,587<br />
R 2 = 0,8658<br />
130 140 150 160 170 180 190<br />
Weight (g)<br />
Figure 38-4. Fecundity-weight relationship for Taeniolethrinops praeorbitalis females in the<br />
SWA. (R² = determination coefficient).<br />
30<br />
Oocyte weight (mg)<br />
25<br />
20<br />
15<br />
10<br />
y = 0,5292x + 23,623<br />
5<br />
R 2 = 0,0304<br />
0<br />
2,0 2,5 3,0 3,5 4,0 4,5 5,0<br />
GSI (%)<br />
Figure 38-5. Relationship between oocyte weight and gonado-somatic index (GSI) for<br />
Taeniolethrinops praeorbitalis. Oocytes from females whose GSI was below (in grey) and<br />
above (in black with regression) 3%. (R² = determination coefficient).<br />
153
Overall mean catches (%)<br />
0 5 10 15<br />
Depth (m)<br />
30<br />
50<br />
Weight<br />
Number<br />
Figure 39-1. Mean occurrence and abundance in the catches per depth <strong>of</strong> Trematocranus<br />
brevirostris in the SWA between July 1998 and May 1999.<br />
Frequency %<br />
35<br />
30<br />
25<br />
20<br />
15<br />
10<br />
5<br />
0<br />
42 47 52 57 62 67 72 77 82<br />
Standard length (mm)<br />
Figure 39-2. Size range and frequencies <strong>of</strong> Trematocranus brevirostris caught in the SWA<br />
between July 1998 and May 1999.<br />
154
Trematocranus spp.<br />
Trematocranus brevirostris (Trewavas)<br />
162 females and 249 males were analysed. T. brevirostris is a small species<br />
encountered at 30 and 50 m but mostly present at 50 m where it made up to 6.3 and 11.1% <strong>of</strong><br />
the catches in weight and number, respectively (Figure 39-1). <strong>The</strong> mean CPUE per depth<br />
category was 9.9 kg for the shallows. No reference to this species (under this name at least)<br />
was made in Tómasson & Banda (1996). Specimens caught ranged between 40 and 85 mm<br />
(Figure 39-2). <strong>The</strong> sex ratio observed over the full sampling period was F/M 0.4/0.6.<br />
Owing to low sample size or absence <strong>of</strong> data for some months, the precise<br />
determination <strong>of</strong> breeding season was not possible. <strong>The</strong> monthly progression <strong>of</strong> ripe females<br />
(Figure 39-3a) and males (Figure 39-3b) were very similar, indicating a breeding activity<br />
from January to May, and in October, with a peak in March-April. According to the<br />
percentages <strong>of</strong> ripe females and males in May and October, it is likely that some breeding also<br />
activity occur between May and October. As almost all the specimens <strong>of</strong> T. brevirostris were<br />
caught at 50 m, spawning probably takes place at this depth. Maturity was reached in their<br />
first year at 11 months old at a mean size <strong>of</strong> 50 mm for females (Figure 39-4). Size at maturity<br />
has to be determined at the height <strong>of</strong> the breeding season to be accurate, but owing to the low<br />
sample size we had to consider every data available. As a consequence, females caught<br />
outside the peak <strong>of</strong> breeding season were included in the analyse, even large resting females,<br />
which explain the shape <strong>of</strong> the upper part <strong>of</strong> the curve.<br />
<strong>The</strong> length-weight and fecundity-weight relationships are presented in Figure 39-5 and<br />
39-6, respectively. Fecundity ranged from 13 to 47 for females weighing between 4 and 13 g<br />
and was not correlated to body weight. No relation was found between oocyte weight and<br />
body weight. <strong>The</strong> GSI threshold above which the oocyte weight did no longer increase<br />
significantly was estimated from the few data available at about 3% (Figure 39-7) and the<br />
mean oocyte weight was 6.70 mg (± 1.12 SD, N= 12).<br />
155
% ripe females<br />
50<br />
45<br />
40<br />
35<br />
30<br />
25<br />
20<br />
15<br />
10<br />
5<br />
0<br />
a<br />
Oct-98<br />
Nov-98<br />
Dec-98<br />
Jan-99<br />
Feb-99<br />
Mar-99<br />
Apr-99<br />
May-99<br />
25 8 13 16 38 53 9<br />
% males in breeding colour<br />
b<br />
50<br />
45<br />
40<br />
35<br />
30<br />
25<br />
20<br />
15<br />
10<br />
5<br />
0<br />
Oct-98<br />
Nov-98<br />
Dec-98<br />
Jan-99<br />
Feb-99<br />
Mar-99<br />
Apr-99<br />
May-99<br />
58 22 6 8 22 52 65 16<br />
Figure 39-3. Seasonal progression <strong>of</strong> the percentage <strong>of</strong> ripe (stages 4 and 5) females (a) and<br />
males (b) Trematocranus brevirostris in the SWA <strong>The</strong> values below the x-axis are the<br />
effective (number <strong>of</strong> male or females which size was above the size at maturity) for each<br />
month.<br />
100<br />
% mature females<br />
50<br />
0<br />
42 47 52 57 62 67 72 77<br />
Standard length (mm)<br />
Figure 39-4. Percentage <strong>of</strong> mature females (stage 3 and above) per size class (standard length)<br />
for Trematocranus brevirostris in the SWA.<br />
156
Weight (g)<br />
14<br />
12<br />
10<br />
8<br />
6<br />
4<br />
2<br />
0<br />
y = 7E-05x 2,7752<br />
R 2 = 0,881<br />
50 55 60 65 70 75 80 85<br />
Length (mm)<br />
Figure 39-5. Length-weight relationship for Trematocranus brevirostris females in the SWA.<br />
(R² = determination coefficient).<br />
Fecundity<br />
50<br />
45<br />
40<br />
35<br />
30<br />
25<br />
20<br />
15<br />
10<br />
5<br />
0<br />
y = 1,9389x + 17,924<br />
R 2 = 0,1812<br />
2 4 6 8 10 12 14<br />
Weight (g)<br />
Figure 39-6. Fecundity-weight relationship for Trematocranus brevirostris females in the<br />
SWA. (R² = determination coefficient).<br />
Oocyte weight (mg)<br />
10<br />
9<br />
8<br />
7<br />
6<br />
5<br />
4<br />
3<br />
2<br />
1<br />
0<br />
y = 0,5913x + 4,362<br />
R 2 = 0,1534<br />
0,0 1,0 2,0 3,0 4,0 5,0<br />
GSI (%)<br />
Figure 39-7. Relationship between oocyte weight and gonado-somatic index (GSI) for<br />
Trematocranus brevirostris. Oocytes from females whose GSI was below (in grey) and<br />
above (in black with regression) 3%. (R² = determination coefficient).<br />
157
Trematocranus placodon (Regan) (Plate 19)<br />
34 females and 17 males were analysed. T. placodon is a common but not abundant<br />
species only encountered at 10 m. <strong>The</strong> mean CPUE per depth category was about 2 kg for the<br />
shallows, which was about three times less than the value <strong>report</strong>ed (5.8 kg) by Tómasson &<br />
Banda (1996). Specimens caught ranged between 90 and 160 mm (Figure 40-1).<br />
Frequency %<br />
35<br />
30<br />
25<br />
20<br />
15<br />
10<br />
5<br />
0<br />
95 105 115 125 135 145 155<br />
Standard length (mm)<br />
Figure 40-1. Size range and frequencies <strong>of</strong> Trematocranus placodon caught in the SWA<br />
between July 1998 and May 1999.<br />
<strong>The</strong> sex ratio observed over the full sampling period was F/M 0.7/0.3.<br />
Owing to low sample size or absence <strong>of</strong> data for some months, the precise<br />
determination <strong>of</strong> breeding season was not possible. Ripe females were found from June too<br />
August and in January-February (Figure 40-2). Only three males in breeding colour were<br />
caught, in July 98. <strong>The</strong> mean size at maturity was about 105 mm for females (Figure 40-3),<br />
which was probably overestimated as this estimation was not done during the height <strong>of</strong> the<br />
breeding season but with all the data available for females, to increase the sample size.<br />
<strong>The</strong> length-weight and fecundity-weight relationships are presented in Figure 40-4 and<br />
40-5, respectively. Fecundity ranged from 76 to 178 for females weighing between 41 and 91<br />
g. No relation was found between oocyte weight and body weight. <strong>The</strong> GSI threshold above<br />
which the oocyte weight did no longer increase significantly was estimated from the few data<br />
available at about 2.5% (Figure 40-6) and the mean oocyte weight was 12.83 mg (± 1.15 SD,<br />
N= 5).<br />
158
Plate 19. Trematocranus placodon (by Dave Voorvelt).<br />
% ripe females<br />
100<br />
90<br />
80<br />
70<br />
60<br />
50<br />
40<br />
30<br />
20<br />
10<br />
0<br />
Jun-98<br />
Jul-98<br />
Aug-98<br />
Sep-98<br />
Oct-98<br />
Nov-98<br />
Dec-98<br />
Jan-99<br />
Feb-99<br />
4 6 4 4 2 14<br />
Figure 40-2. Seasonal progression <strong>of</strong> the percentage <strong>of</strong> ripe (stages 4 and 5) females<br />
Trematocranus placodon in the SWA <strong>The</strong> values below the x-axis are the effective for<br />
each month.<br />
100<br />
% mature females<br />
50<br />
0<br />
85 95 105 115 125 135 145<br />
Standard length (mm)<br />
Figure 40-3. Percentage <strong>of</strong> mature females (stage 3 and above) per size class (standard length)<br />
for Trematocranus placodon in the SWA.<br />
159
Weight (g)<br />
100<br />
90<br />
80<br />
70<br />
60<br />
50<br />
40<br />
30<br />
20<br />
10<br />
0<br />
y = 5E-05x 2,906<br />
R 2 = 0,8417<br />
100 110 120 130 140 150<br />
Length (mm)<br />
Figure 40-4. Length-weight relationship for Trematocranus placodon females in the SWA.<br />
(R² = determination coefficient).<br />
Fecundity<br />
200<br />
180<br />
160<br />
140<br />
120<br />
100<br />
80<br />
60<br />
40<br />
20<br />
0<br />
y = 1,2303x + 50,512<br />
R 2 = 0,5123<br />
40 50 60 70 80 90 100<br />
Weight (g)<br />
Figure 40-5. Fecundity-weight relationship for Trematocranus placodon females in the SWA.<br />
(R² = determination coefficient).<br />
Oocyte weight (mg)<br />
16<br />
14<br />
12<br />
10<br />
8<br />
6<br />
4<br />
2<br />
y = 0,4948x + 11,361<br />
R 2 = 0,048<br />
0<br />
0,0 0,5 1,0 1,5 2,0 2,5 3,0 3,5 4,0<br />
GSI (%)<br />
Figure 40-6. Relationship between oocyte weight and gonado-somatic index (GSI) for<br />
Trematocranus placodon. Oocytes from females whose GSI was below (in grey) and<br />
above (in black with regression) 3%. (R² = determination coefficient).<br />
160
Table 41. Peak <strong>of</strong> breeding activity <strong>of</strong> species per depth category. X = data supported by good<br />
sample size, x = data supported by low sample size. "Intermediate" means common in both<br />
deep and shallow zone.<br />
1998 1999<br />
Depth<br />
category Species Jun Jul Aug Oct Nov Dec Jan Feb Mar Apr May<br />
Deep<br />
water<br />
(75-<br />
125m)<br />
A. 'ge<strong>of</strong>freyi' X X X X<br />
A. macrocleithrum x X X x<br />
A. mentale X X X<br />
A. pectinatum X X<br />
Au. minutus X X<br />
D. apogon X X X X<br />
D. macrops X X X<br />
P. tokolosh X X X<br />
L. 'deep water altus' X X X X X<br />
L. gossei X X X X<br />
L. 'oliveri' X X X<br />
L. polli X<br />
Pl. 'platyrhynchos' x X X X X X<br />
Intermed<br />
-iate<br />
D. limnothrissa X X X<br />
C. quadrimaculatus x<br />
C. virginalis X X X<br />
L. longimanus x<br />
Sc. ahli X X<br />
Sc. Benthicola X X<br />
Shallow<br />
water<br />
(10-50m)<br />
Au. 'blue orange' X X X<br />
L. argenteus X X X X<br />
M. anaphyrmus X X X X<br />
N. 'argyrosoma' X X<br />
Pl. 'long'<br />
x<br />
T. furcicauda x<br />
T. praeorbitalis x<br />
Tr. brevirostris X X<br />
161
Discussion<br />
Depth distribution and mean CPUE for the major species were compared with those<br />
found by Tómasson & Banda (1996) in the SWA. Several <strong>of</strong> the species we regularly caught<br />
were absent <strong>of</strong> Tómasson & Banda (1996) survey <strong>of</strong> the SWA, and the other way round. This<br />
is likely due to identification differences between the two studies, some species being either<br />
lumped together under their generic names or accurately identified. Also, the smaller area<br />
covered might explain the absence <strong>of</strong> some species in our survey. However, global trends in<br />
CPUE were similar for both studies and the observed differences may lies in the fact that<br />
Tómasson & Banda covered the entire SWA whereas our work focused on the northern part<br />
<strong>of</strong> it.<br />
Breeding species were found throughout the year at any depth. Some species were<br />
capable <strong>of</strong> breeding throughout the year (as already <strong>report</strong>ed by Marsh et al. 1986, Lewis &<br />
Tweddle 1990, Thompson et al. 1996) with marked seasonal variations in the proportions <strong>of</strong><br />
ripe individuals, whereas others appeared to have distinct breeding season (as the<br />
Oreochromis spp., Lowe-McConnell 1987 or members <strong>of</strong> the Utaka group, Iles 1960, 1971,<br />
Jackson et al. 1963), generally over 6 months long. Again, these patterns were independent<br />
from the depth distribution <strong>of</strong> the species. An interesting hypothesis linking the length <strong>of</strong> the<br />
breeding season to the fecundity <strong>of</strong> the species was proposed by Marsh et al. (1986): the lower<br />
the fecundity the longer the breeding season. If this hypothesis seemed to fit for the mbuna, it<br />
does however not hold for the demersal cichlids. Indeed, species such as Lethrinops<br />
argenteus, or L. oliveri, which had continuous breeding season also presented amongst the<br />
highest relative fecundity (2162 eggs.kg -1 , 4931 eggs.kg -1 , respectively) whereas species such<br />
as Diplotaxodon apogon with definite breeding season had amongst the lowest relative<br />
fecundity (632 eggs.kg -1 ). Apart from a single species, Copadichromis virginalis, whose<br />
peaks <strong>of</strong> breeding activity were clearly related to plankton abundance, the breeding cycle <strong>of</strong><br />
the other species was not directly related to any <strong>of</strong> the monitored environmental factors<br />
(temperature, oxygen concentration, photoperiod, algal abundance, conductivity). No<br />
particular breeding distribution pattern was found among the several species studied, when<br />
they were grouped per trophic category, per genera or per depth category. Even when<br />
focusing on the peaks <strong>of</strong> breeding activity per depth category (Table 41), no marked structure<br />
appeared. <strong>The</strong> peaks <strong>of</strong> breeding activity were evenly distributed over the year for the shallow<br />
water species. <strong>The</strong> only slight remarkable trend was that the highest concentration <strong>of</strong> breeding<br />
peaks occurred from January to May for the deep water species whereas no peak was recorded<br />
from January to March for the species with "intermediate" depth distribution. <strong>The</strong> period from<br />
December to April is the time <strong>of</strong> the year when the lake is most strongly stratified, the<br />
thermocline being around 40-50 m (Eccles 1974, see Figure 11 previous chapter). It also<br />
corresponds to the period <strong>of</strong> lowest phytoplankton and zooplankton abundance (Irvine 1995).<br />
However, most <strong>of</strong> the studied species are supposed to be benthic invertebrates feeders and the<br />
observed breeding patterns might be related to the relative abundance <strong>of</strong> their main food<br />
sources, as seems to be the rule for mbuna (Marsh et al. 1986). <strong>The</strong> seasonal progression <strong>of</strong><br />
benthic invertebrate abundance and biomass, which is currently under study in the European<br />
Union Project: "<strong>The</strong> trophic <strong>ecology</strong> <strong>of</strong> the demersal <strong>fish</strong> community <strong>of</strong> <strong>Lake</strong> <strong>Malawi</strong>/Niasa",<br />
might shed a new light on the determinism <strong>of</strong> the observed breeding patterns. On the other<br />
hand, the reason for this apparent time sharing could lie in Fryer & Iles (1972) hypothesis <strong>of</strong><br />
self-controlled population densities (population homeostasis) achieved through sharing <strong>of</strong><br />
spawning territories. Lowe-McConnell (1979) also suggested that for tropical <strong>fish</strong>es<br />
asynchronous breeding could be a good way <strong>of</strong> maximising resource use for species with<br />
similar requirements. However, given the good correspondence between food availability and<br />
162
Table 42. Ratio <strong>of</strong> length at maturity (L 50 ) to maximum observed length (MOL) for several<br />
cichlids species caught by trawling in the South West Arm <strong>of</strong> <strong>Lake</strong> <strong>Malawi</strong> between June<br />
1998 and May 1999. <strong>The</strong> lengths are standard lengths. In italic are values for which<br />
determination <strong>of</strong> L 50 was uncertain owing to low effective.<br />
Species MOL (mm) L 50 (mm) Ratio<br />
A. 'ge<strong>of</strong>freyi' 165 90 0.55<br />
A. macrocleithrum 148 100 0.68<br />
A. mentale 245 160 0.65<br />
A. pectinatum 140 70 0.5<br />
Au. 'blue orange' 78 48 0.62<br />
Au. 'cf macrochir' 134 100 0.75<br />
Au. 'minutus' 72 42 0.58<br />
Au. 'rostratum deep' 140 75 0.54<br />
B. lepturus 326 160 0.49<br />
B. nototaenia 300 115 0.38<br />
C. quadrimaculatus 150 100 0.67<br />
C. virginalis 123 75 0.61<br />
D. apogon 130 88 0.68<br />
D. argenteus 206 140 0.68<br />
D. limnothrissa 175 105 0.6<br />
D. macrops 135 98 0.73<br />
P. tokolosh 213 135 0.63<br />
L. argenteus 165 108 0.65<br />
L. 'deep water albus' 160 82 0.51<br />
L. 'deep water altus' 130 60 0.46<br />
L. gossei 170 92 0.54<br />
L. longimanus 147 107 0.73<br />
L. 'oliveri' 98 60 0.61<br />
L. polli 120 65 0.54<br />
M. anaphyrmus 164 105 0.64<br />
N. 'argyrosoma' 97 57 0.59<br />
Pl. 'platyrhynchos' 115 80 0.69<br />
Ps. livingstonii 63 37 0.59<br />
Sc. benthicola 168 100 0.60<br />
St. 'guttatus' 147 100 0.68<br />
T. furcicauda 178 130 0.73<br />
T. praeorbitalis 199 130 0.65<br />
Tr. brevirostris 85 50 0.59<br />
Tr. placodon 160 105 0.66<br />
163
eeding patterns for rock-dwelling species and C. virginalis, this is likely to be also the case<br />
for demersal species. For every species, more males than females in breeding condition were<br />
caught at any time <strong>of</strong> the year. This was also observed by Lewis & Tweddle (1990) on the<br />
three studied Lethrinops spp. Although not demonstrated for every species, the general trend<br />
<strong>of</strong> <strong>Malawi</strong> cichlids males to form breeding aggregations is likely to account for this<br />
difference, breeding males being more vulnerable to trawling when they form leks (Fryer<br />
1972, 1984).<br />
Among the species for which we determined the size at maturity, a few had already<br />
been studied: Diplotaxodon limnothrissa (Thompson et al. 1996), Lethrinops gossei (Lewis &<br />
Tweddle (1990), Mylochromis anaphyrmus (Tweddle & Turner 1977). <strong>The</strong> size at maturity<br />
we got for L. gossei and M. anaphyrmus were much smaller than those <strong>report</strong>ed by Lewis &<br />
Tweddle and Tweddle & Turner. Size at maturity may vary among successive years for a<br />
same population under environmental variation (Duponchelle & Panfili 1998), or over longer<br />
time periods under <strong>fish</strong>ing pressure (Stewart 1988, Lowe-McConnell 1982, Trewavas 1983).<br />
<strong>The</strong> observed differences in size at maturity could thus lie in the distant time period and<br />
geographical area between the studies. However, the method they both used overestimated the<br />
L 50 . <strong>The</strong> average size at first maturation (L 50 ) is defined as the length at which 50% <strong>of</strong> the<br />
females are mature during the breeding season. Tweddle & Turner and Lewis & Tweddle<br />
considered the "length at the percentage point which is one-half <strong>of</strong> the maximum percentage<br />
<strong>of</strong> mature <strong>fish</strong> found in any length group", that is the highest point on the sigmoid curve. But<br />
as they considered in fact ripe <strong>fish</strong> as being mature, and that there is always only a fraction <strong>of</strong><br />
the population in a "ripe" state, they consistently overestimated the L 50 . That's the reason why<br />
their sigmoid never reached 100%. Iles (1971) stated that the ratio <strong>of</strong> length at maturity to<br />
asymptotic length for cichlids was characteristically a little above 0.7. <strong>The</strong> ratios found by<br />
Tweddle & Turner (1977) tended to confirm that mean value. However, as they overestimated<br />
the L 50 , the ratios they found were also overestimated. In our study, the asymptotic length was<br />
not calculated for all the species (see Chapter "Growth"), thus the maximum observed length,<br />
considered to be close to the asymptotic length, was used to calculate the ratio (Table 42).<br />
Ratios ranged between 0.38 and 0.75 with an averaged value <strong>of</strong> 0.61. As the L 50 for some<br />
species were probably overestimated due to low sample size (in italic in Table 42) and<br />
considering that the maximum observed length is usually smaller than the theoretic<br />
asymptotic length, the average ratio is likely to be a little below 0.6. In the case <strong>of</strong> Lethrinops<br />
'deep water altus', the ratio value <strong>of</strong> 0.46 might have been underestimated. Indeed, this low<br />
value might lie in misidentification <strong>of</strong> the largest specimens (up to 130 mm), as Turner (1996)<br />
<strong>report</strong>ed a maximum size <strong>of</strong> 10 cm TL for this species. It is interesting to note that some<br />
genera present ratio values that tend to be close to 0.7 (e.g. Diplotaxodon spp., Copadichromis<br />
spp.) whereas others show values closer to 0.5 such as the Buccochromis and Lethrinops spp..<br />
Despite the importance <strong>of</strong> this population parameter in <strong>fish</strong>eries management, age at<br />
maturity had only been estimated on a few species so far: Lethrinops longipinnis, L.<br />
parvidens, Mylochromis ("Haplochromis") anaphyrmus, Copadichromis ("Haplochromis")<br />
mloto (Tweddle & Turner 1977). <strong>The</strong>se species were believed to reach maturity at the end <strong>of</strong><br />
their third year except C. mloto, which matured at the end <strong>of</strong> its second year. M. anaphyrmus<br />
was the only common species between Tweddle & Turner study and ours. We found M.<br />
anaphyrmus was reaching maturity early in its second year at 18 months old. <strong>The</strong> growth<br />
parameters determined by Tweddle & Turner (1977), K=0.671 and LJ=196 mm TL, being<br />
very similar to ours: K=0.62 and LJ=180 mm SL (see Chapter "Growth"), the two fold<br />
difference in age at maturity observed between the two studies (which took place in the same<br />
area) lies mainly in the overestimation <strong>of</strong> size at maturity by the method used in Tweddle &<br />
Turner (1977). Assuming the same mean size at maturity <strong>of</strong> 160 mm TL (about 130 mm SL in<br />
our case), they would mature early in their third year (25 months) as well. It is very likely that<br />
164
this overestimation <strong>of</strong> age and size at maturity hold as well for the others species they studied.<br />
Growth and age at maturity were also estimated for C. ("Haplochromis") virginalis and C.<br />
("Haplochromis") quadrimaculatus by Iles (1971). <strong>The</strong>y were both reaching maturity at three<br />
years old whereas we found they matured in their first and second year at 12 and 20 months<br />
for C. virginalis and C. quadrimaculatus, respectively. Despite slight differences in growth<br />
parameters, the differences between the two sets <strong>of</strong> estimations lies in the fact that<br />
determination <strong>of</strong> the size at maturity was based on ripe females in Iles's study (Iles 1971,<br />
Jackson et al. 1963), which leads to an overestimation <strong>of</strong> L 50 . Indeed, the size at maturity they<br />
determined represented 88 and 84 % <strong>of</strong> the maximum theoretical length (asymptotic length)<br />
for C. virginalis and C. quadrimaculatus, respectively. It is assumed that in unexploited<br />
stocks, which is certainly not the case for members <strong>of</strong> the Utaka group, the oldest <strong>fish</strong> reach<br />
only about 95% <strong>of</strong> their asymptotic length (review in Pauly 1980). This means that in Iles's<br />
case, they would breed for the first time close to their maximum size, which only few <strong>fish</strong><br />
reach. Also, assuming the mean maturity length ratio Iles (1971) considered as the rule for<br />
cichlids (0.7), age at maturity would have been 1.6 and 2.0 years old for its populations <strong>of</strong> C.<br />
virginalis and C. quadrimaculatus, respectively, which would place them in the range <strong>of</strong> age<br />
at maturity we observed. <strong>The</strong> 22 species for which we determined A 50 reached maturity before<br />
the end <strong>of</strong> their second year or during their first year for the smallest species (Au. 'Blue<br />
orange', Au. 'minutus', N. 'argyrosoma'…). It is more conceivable that highly exploited<br />
species with such low fecundity as the <strong>Lake</strong> <strong>Malawi</strong> cichlids, mature early in their life<br />
(around one year old) rather than in the last part <strong>of</strong> their lives (more than three years old).<br />
Indeed, very few species grew older than four years (see Chapter "Growth", see also the<br />
abacus <strong>of</strong> longevity versus mean maximum length drawn out <strong>of</strong> 111 species <strong>of</strong> <strong>Africa</strong>n<br />
freshwater <strong>fish</strong>es by de Merona 1983). Next, as only a very small fraction <strong>of</strong> a <strong>fish</strong> population<br />
reach the asymptotic length, which is usually slightly higher than the maximum observed<br />
length, this means that very few <strong>fish</strong> indeed would reach maturity and would therefore<br />
reproduce to ensure the replenishment <strong>of</strong> populations or the species survival. This clearly<br />
appears when looking at the proportion <strong>of</strong> <strong>fish</strong> reaching the size at maturity on the length<br />
frequency distributions presented in Iles (1971). Species with such a life history strategy<br />
would have unlikely survive about thirty years <strong>of</strong> intense exploitation by <strong>fish</strong>eries, which<br />
systematically remove the large specimens <strong>of</strong> <strong>fish</strong> populations (Turner 1977b, Turner 1995,<br />
Turner et al. 1995).<br />
It is a well known characteristic <strong>of</strong> <strong>Lake</strong> <strong>Malawi</strong> cichlids, they usually produce few but<br />
large eggs (see for review Fryer & Iles 1972, Konings 1995, Turner 1996). <strong>The</strong> forty species<br />
studied perfectly fitted into this trend. However, as already mentioned above, distinct<br />
reproductive strategies are distinguished among species and genera: species <strong>of</strong> the<br />
Diplotaxodon clade (sensu Turner et al. 1999) and Rhamphochromis spp. (pers. obs.) clearly<br />
presented the lowest relative fecundities and the largest eggs <strong>of</strong> all species. Although in a<br />
lesser extent, C. quadrimaculatus also presented low fecundity and large eggs. On the other<br />
hand, for a same body weight Lethrinops, Alticorpus or Mylochromis species produced much<br />
smaller but more numerous eggs. It appears that the species having a more pelagic life style<br />
such as the Diplotaxodon spp., Rhamphochromis spp. (Allison et al. 1996, Thompson et al.<br />
1995, 1996, Turner et al. 1999), or C. quadrimaculatus (Allison et al. 1996, Thompson et al.<br />
1995, 1996) are characterised by reduced fecundity, very large eggs and delayed maturity<br />
(Diplotaxodon and Copadichromis spp. had the highest Lmax to L 50 ratios). This reproductive<br />
strategy, which enable females to moothbrood young to very large sizes (observed for D.<br />
limnothrissa Turner 1994a, 1996, this study), is likely to be an adaptation to the pelagic<br />
environment. Egg size is an essential parameter <strong>of</strong> <strong>fish</strong> reproductive strategy for it conditions<br />
the ability to use a large array <strong>of</strong> food sources, to avoid predators and to survive unfavourable<br />
165
A C<br />
Plate 20. Gonad <strong>of</strong> a ripe Lethrinops longimanus female with at least three batches <strong>of</strong> oocytes.<br />
A = oocytes in late vitellogenesis that will be laid at the next spawn. B = second batch <strong>of</strong><br />
developing vitellogenic oocytes (characteristic <strong>of</strong> a stage 3). C = third batch <strong>of</strong> oocytes in<br />
early development (characteristic <strong>of</strong> a stage 2).<br />
B<br />
166
environmental conditions (Bagenal 1969, 1978, Ware 1977, Mann & Mills 1979, Reznick,<br />
1982, Marsh 1986, Sargent et al. 1987, Wootton 1990, Cambray & Bruton 1994, Wootton<br />
1994). An inverse relationship links the egg size and the fecundity in most <strong>fish</strong> species (Mann<br />
& Mills 1979, Albaret 1982, Stearns 1983, Duarte & Alcaraz 1989, Elgar 1990) and in<br />
cichlids particularly (Peters 1963, De Silva 1986, Legendre & Ecoutin 1989, 1996,<br />
Duponchelle et al. 2000, this study). According to the energetic cost <strong>of</strong> gamete production,<br />
food is probably one <strong>of</strong> the most important environmental factors involved in the regulation <strong>of</strong><br />
fecundity (Wooton & Evans 1976, Wooton 1979). <strong>The</strong>refore, food availability being<br />
relatively poor in the pelagic zone, a logical strategy to improve both parents and <strong>of</strong>fspring's<br />
fitness is to produce fewer eggs but <strong>of</strong> larger size and to moothbrood young to large size to<br />
enhance their survival. Indeed, the larger the fry when released by the female the more<br />
effective they will be in utilising the scarce food resources <strong>of</strong> the open waters. If this<br />
hypothesis is true, the cichlid reproductive strategy to adapt to pelagic environment would<br />
differ markedly from the strategy <strong>of</strong> most other pelagic <strong>fish</strong> families, which generally produce<br />
large numbers <strong>of</strong> small eggs (reviews by Duarte & Alcaraz 1989, Elgar 1990), including the<br />
freshwater pelagic cyprinids Engraulicypris sardella in <strong>Lake</strong> <strong>Malawi</strong> (Jackson et al. 1963)<br />
and Rastrineobola argentea in <strong>Lake</strong> Victoria (review in Witte & van Densen 1995), or the<br />
clupeids Stolothrissa tanganicae and Limnothrissa miodon in <strong>Lake</strong> Tanganyika (reviews by<br />
Coulter 1991, Marshall 1993, and Patterson & Makin 1998).<br />
As pointed out by Fryer & Iles (1972), to know how many eggs each female produces at each<br />
brood is important but how many times a year that number is produced is even more essential<br />
for <strong>fish</strong>eries management. Determining the number <strong>of</strong> times a female can spawn during a<br />
breeding season is a difficult task in natural environments, particularly for the demersal<br />
<strong>Malawi</strong> cichlids. <strong>Cichlid</strong>s are known world-wide for their capacity to have multiple spawning<br />
events during the same breeding season when environmental conditions are favourable (Lowe<br />
1955, Trewavas 1983 for review, James & Bruton 1992). However, based on the observation<br />
<strong>of</strong> only one batch <strong>of</strong> eggs at a time in ovaries <strong>of</strong> ripe female cichlids in <strong>Lake</strong> <strong>Malawi</strong>, it was<br />
assumed that a same female was able to spawn only once per breeding season (Lowe 1955,<br />
Iles 1971, Tweddle and Turner 1977). Having analysed tens <strong>of</strong> thousands demersal cichlids<br />
pertaining to at least 170 species (Appendix 1) during the course <strong>of</strong> this study, three sets <strong>of</strong><br />
evidence have emerged to suggest that annual multiple spawning is likely. <strong>The</strong> evidence is<br />
presented below:<br />
(1) - For most <strong>of</strong> the studied species it was observed but not recorded that more than one<br />
batch <strong>of</strong> eggs were in the ovaries <strong>of</strong> ripe females. An example is given on Plate 20, which<br />
presents the ovaries <strong>of</strong> a ripe Lethrinops longimanus female. A minimum <strong>of</strong> three batches <strong>of</strong><br />
developing oocytes are clearly visible: the batch that will be released soon (A), a second batch<br />
that already undertook vitellogenesis (B), and a third one <strong>of</strong> smaller oocytes in early<br />
development (C). To verify the observation, and taking the opportunity <strong>of</strong> a <strong>fish</strong>ing cruise<br />
with the RV Ndunduma in the SWA in July 1999, a special survey was organised in order to<br />
check the existence <strong>of</strong> more than one batch <strong>of</strong> oocyte in cichlids ripe gonads. All the females<br />
found with ripe gonads had two and sometimes three batches <strong>of</strong> oocytes. <strong>The</strong> sample included<br />
the following species: Alticorpus 'ge<strong>of</strong>freyi', A. macrocleithrum, A. mentale, A. pectinatum,<br />
Aulonocara 'blue orange', Copadichromis virginalis, Diplotaxodon greenwoodi,<br />
Hemitaeniochromis insignis, Lethrinops longimanus, L. gossei, L. 'oliveri', L. polli,<br />
Mylochromis anaphyrmus, Otopharynx speciosus, O. brooksi and Sciaenochromis 'guttatus'.<br />
(2) - <strong>The</strong> gonad maturity stage 6-3 (see Material and methods) was frequently observed for all<br />
the studied species. This stage is characteristic <strong>of</strong> post-spawning females initiating another<br />
cycle <strong>of</strong> vitellogenesis.<br />
167
(3) - Moothbrooding females <strong>of</strong> many species were <strong>of</strong>ten found with developing ovaries<br />
(stages 6-3 or 3).<br />
<strong>The</strong>se three sets <strong>of</strong> evidence strongly suggest that each female probably spawns more than<br />
once during the breeding season, for haplochromine cichlids at least. Indeed, it would be very<br />
poor energetic strategy for a female to initiate another vitellogenesis cycle if the developed<br />
oocytes were not to be laid. In such a stable environment as <strong>Lake</strong> <strong>Malawi</strong>, it is very unlikely<br />
that environmental conditions become so unfavourable that a female would resorb her eggs<br />
during the few weeks needed to complete a vetillogenesis cycle (four to five weeks in<br />
cichlids, Fishelson 1966, Gauthier et al. 1996, Tacon et al. 1996). Furthermore, although<br />
extensive breeding season does not mean that individual <strong>fish</strong> breed continuously, most <strong>of</strong> the<br />
studied species have breeding seasons lasting more than six months, and several showed<br />
continuous breeding seasons. It appears very reasonable in these conditions that individual<br />
<strong>fish</strong>, known to breed repeatedly in aquarium, may then reproduce more than once, as do<br />
cichlids everywhere else (reviews by Fryer & Iles 1972, Trewavas 1983, Lowe-McConnell<br />
1987).<br />
Although this study presents the most comprehensive work on <strong>Lake</strong> <strong>Malawi</strong> cichlids<br />
life histories, it is based on a one year survey only. As inter annual variability <strong>of</strong> reproductive<br />
characteristics can be important in <strong>Africa</strong>n cichlids (Duponchelle & Panfili 1998,<br />
Duponchelle et al. 1999, 2000), the described breeding patterns might not represent a<br />
permanent situation but rather a situation representative <strong>of</strong> the prevalent environmental<br />
conditions. However, <strong>Lake</strong> <strong>Malawi</strong> is a stable environment where important environmental<br />
perturbations are unlikely. <strong>The</strong> likeliest unexpected fluctuations are in resource availability,<br />
which might modify the intensity <strong>of</strong> breeding activity rather than its periodicity (Duponchelle<br />
et al. 1999). Furthermore, the breeding season observed for C. ("Haplochromis") virginalis<br />
and C. ("Haplochromis") quadrimaculatus were the same over a period <strong>of</strong> five years (Iles<br />
1971) and Lewis & Tweddle (1990) <strong>report</strong>ed very similar trends in breeding seasonality<br />
among the three years <strong>of</strong> their study, which suggested little or no inter annual variability <strong>of</strong><br />
breeding patterns.<br />
168
Chapter 3:<br />
Growth patterns <strong>of</strong> some <strong>of</strong> the most<br />
important demersal <strong>fish</strong> species<br />
caught by trawling in the South West<br />
Arm <strong>of</strong> <strong>Lake</strong> <strong>Malawi</strong>
Chapter 3: Growth patterns <strong>of</strong> some <strong>of</strong> the most important<br />
demersal <strong>fish</strong> species caught by trawling in the South West Arm<br />
<strong>of</strong> <strong>Lake</strong> <strong>Malawi</strong><br />
F. Duponchelle, A.J. Ribbink, A. Msukwa, J. Mafuka & D. Mandere<br />
Introduction<br />
Several methods exist to assess <strong>fish</strong> growth parameters, such as analysis <strong>of</strong> periodic<br />
marks on opercular bones, scales, vertebrae or otoliths, individual tagging or analysis <strong>of</strong><br />
length frequency distributions (review by Casselman 1987, de Merona et al. 1988, Wootton<br />
1990, King 1995). Among these methods, analysis <strong>of</strong> the modal progression <strong>of</strong> length<br />
frequency distributions (Ricker 1975) has been commonly used for <strong>Africa</strong>n freshwater <strong>fish</strong>es<br />
despite its potential biases in tropical conditions, where lack <strong>of</strong> seasonality, long spawning<br />
periods, non-year events giving rise to variations in growth and survival rates (hence to age<br />
and size modes) may lead to erroneously interpret size modes as differing in age by units <strong>of</strong><br />
year. Indeed, tropical species <strong>of</strong>ten have extended breeding seasons during which multiple<br />
broods are produced and several cohorts (a cohort is a group <strong>of</strong> <strong>fish</strong> born at the same time) are<br />
likely to be encountered. In these conditions following year classes is <strong>of</strong>ten difficult and<br />
hamper precise interpretation <strong>of</strong> length progression series (Fryer & Iles 1972, Casselman<br />
1987, Lowe-McConnell 1987, de Merona et al. 1988, King 1995). As just seen in the previous<br />
chapter, most <strong>of</strong> the studied species have extended breeding seasons. However, when<br />
reasonably accurate information on the species biology is available, such as the breeding<br />
season and the maximum length, it is still possible to obtain correct estimates <strong>of</strong> growth using<br />
modal length progression analysis. For most <strong>of</strong> the species studied below, more than one<br />
cohort per year was identifiable and different sets <strong>of</strong> K and L J provided reasonable fit <strong>of</strong> the<br />
length frequency distributions. In every case, we retained the set <strong>of</strong> parameters that best<br />
corresponded with the breeding patterns observed for the species (ie. which estimated date <strong>of</strong><br />
birth best corresponded with breeding peaks) and that best described the distributions (ie.<br />
which went through the largest number <strong>of</strong> large modes). Also, as an extensive sampling was<br />
done monthly over a complete annual cycle, always on the same sites, it was assumed that for<br />
most species the maximum observed length was close to the asymptotic length (L J ), which<br />
participated in selecting the best set <strong>of</strong> parameters. This was particularly true for the small<br />
abundant species, for which we fixed LJ within a few millimetres from the maximum<br />
observed length. This process also permitted to diminish the tendency <strong>of</strong> ELEFAN method to<br />
underestimate K and overestimate LJ (Moreau et al. 1995).<br />
Despite the 35 mm cod end mesh size, the length frequency distributions were<br />
influenced either by the trawl selectivity or the absence <strong>of</strong> the juveniles from trawled areas.<br />
Indeed; juveniles <strong>of</strong> species were seldom caught before 50 mm and were usually accessible to<br />
the trawl gear between 60 and 90 mm depending on species and shapes. Consequently, adults<br />
were better represented in the catches than juveniles and length frequency distributions below<br />
the size <strong>of</strong> full selection were not adequate for mortality estimates. Whenever one or more<br />
suitable distributions were available, mortality estimates were based only on them. But in<br />
most <strong>of</strong> the cases, they were based on all the distributions. This must be kept in mind even<br />
169
though mortality estimates <strong>of</strong>ten appeared reasonable. FiSAT allows correction <strong>of</strong> the bias<br />
due to <strong>fish</strong>ing gear's selectivity, which <strong>of</strong>ten leads to a better estimation <strong>of</strong> the growth<br />
parameters (Moreau et al. 1995, Gayanilo et al. 1996). This correction was tried for every<br />
species and never lead to better estimations (according to the "goodness <strong>of</strong> fit" index <strong>of</strong> the<br />
ELEFAN routine, see Gayanilo & Pauly 1997). <strong>The</strong> weight given to small length<br />
systematically flattened out the rest <strong>of</strong> the distribution and the resulting fits were bad. All the<br />
estimations were therefore based on non corrected data. However, for every species except the<br />
small ones for which it was not necessary, the smoothing <strong>of</strong> the data by calculating the<br />
running averages over three length bins (5 mm for most <strong>of</strong> the species and 10 mm for large<br />
and not abundant species) helped to track the progression <strong>of</strong> modes.<br />
All the lengths are standard lengths.<br />
Material and methods<br />
All the <strong>fish</strong> analysed were collected during the monthly trawl catches in the north <strong>of</strong><br />
the South West Arm (see Chapter 1 for details).<br />
<strong>The</strong> following equation was used to convert total lengths (TL) from literature into standard<br />
length (SL):<br />
SL = 0.785 TL + 3.477 (1)<br />
This equation was calculated from Table G1.<br />
Table G1. Growth estimates (mm in TL) <strong>of</strong> <strong>Lake</strong> <strong>Malawi</strong> cichlids species given by Iles<br />
(1971) and Tweddle & Turner (1977) and the same growth estimates expressed in SL by de<br />
Merona et al. (1988).<br />
Species LJ (TL) K References LJ (SL) References<br />
H. anaphyrmus 196 0,671 Tweddle & Turner<br />
(1977)<br />
157 De Merona et al.<br />
(1988)<br />
H. intermedius 229 0,571 Tweddle & Turner<br />
(1977)<br />
184 De Merona et al.<br />
(1988)<br />
H. virginalis 121 0,778 Iles (1971) 99 De Merona et al.<br />
(1988)<br />
H. quadrimaculatus 190 0,65 Iles (1971) 153 De Merona et al.<br />
(1988)<br />
H. pleurostigmoides 144 0,764 Iles (1971) 116 De Merona et al.<br />
(1988)<br />
L. parvidens 208 0,487 Tweddle & Turner 166 De Merona et al.<br />
(1977)<br />
L. longipinnis 202 0,571 Tweddle & Turner<br />
(1977)<br />
(1988)<br />
162 De Merona et al.<br />
(1988)<br />
Growth was estimated from the modal progressions <strong>of</strong> length frequency distributions<br />
<strong>of</strong> species at every sampled month. <strong>The</strong> growth parameters were calculated by the Von<br />
Bertalanffy Growth Curve (VBGC) equation (equation 2) fitted by the electronic length<br />
frequency analysis (ELEFAN) method (Pauly 1987) using the FAO-ICLARM Package<br />
FiSAT (Gayanilo et al. 1996, Gayanilo & Pauly 1997).<br />
170
L t = L J (1-exp (-K (t-t 0 )) (2)<br />
Where L t is the mean length at age t, L J is the asymptotic length, K the growth coefficient and<br />
t 0 the size at age 0.<br />
Among the several growth models available (VBGC, Richards, Gompertz, logistic, quadratic,<br />
exponential, ect. see Schnute 1981 for review), the VBGC model was retained for the<br />
following reasons: 1)- for <strong>Africa</strong>n <strong>fish</strong> species the VBGC usually provides a good fit <strong>of</strong> the<br />
data (de Merona et al. 1988, Moreau et al. 1995). 2)- it proves useful for comparative<br />
purposes as it has been largely utilised for <strong>Africa</strong>n freshwater species and cichlids<br />
particularly, for which synthesis are available (de Merona et al. 1983, 1988, Moreau et al.<br />
1995). <strong>The</strong> ELEFAN method, used by Moreau et al. (1995) on 57 stocks <strong>of</strong> <strong>Africa</strong>n<br />
freshwater species was also utilised in this study for comparative purposes.<br />
Mortality estimates were obtained as described in Moreau et al. (1991) and Moreau &<br />
Nyakageni (1992) for <strong>Lake</strong> Tanganyika <strong>fish</strong>es. Total mortality (Z) was estimated by the<br />
method <strong>of</strong> the length-converted catch curves (LCC) (Pauly 1983). This method consists in<br />
pooling all the distributions while keeping their relative importance to obtain a single<br />
frequency distribution. This decreases part <strong>of</strong> the sampling biases. Total mortality is then<br />
calculated on the descending part <strong>of</strong> this single global distribution. But Z is determined in a<br />
given age/size range and the estimation makes sense only within this range. Natural mortality<br />
(M) was evaluated using Pauly's equation (Pauly 1980) based on LJ, K and the mean annual<br />
environmental temperature <strong>of</strong> the species concerned. For each species, the mean annual<br />
temperature used for natural mortality estimates corresponds to the mean annual temperature<br />
at the depth to which the species was more abundant (see Chapter "Breeding and depth<br />
distribution"). Fishing mortality (F) was calculated as F = Z-M. All these methods were<br />
provided by the FiSAT package, including the estimation <strong>of</strong> the probability <strong>of</strong> capture.<br />
<strong>The</strong> mean size at first capture by the trawl (Lc = length at which 50% <strong>of</strong> the <strong>fish</strong> entering the<br />
trawl are retained by the gear) was calculated for each species from the length-converted<br />
catch curves using FiSAT (Gayanilo & Pauly 1997).<br />
171
Jun Jul Aug Sep Oct Nov Dec Jan Feb Mar Apr May<br />
1998 1999<br />
FigureG1-1.LengthfrequencyplotsforA.'ge<strong>of</strong>freyi'<br />
intheSWA<strong>of</strong><strong>Lake</strong><strong>Malawi</strong>.<br />
Relativeage(years-t0)<br />
Relativeage(years-t0)<br />
FigureG2-2.Lengthconvertedcatchcurvefor A.macrocleithrum.<br />
Jun Jul Aug Sep Oct Nov Dec Jan Feb Mar Apr May<br />
1998 1999<br />
FigureG2-1.Lengthfrequencyplotsfor A.macrocleithrum<br />
intheSWA<strong>of</strong><strong>Lake</strong><strong>Malawi</strong>.
Results<br />
Alticorpus spp.<br />
Alticorpus 'ge<strong>of</strong>freyi'<br />
<strong>The</strong> length frequency distributions, based on 1721 <strong>fish</strong> are presented in Figure G1-1.<br />
Three year classes were identified by the model with L J =181 mm and K=0.6. <strong>The</strong> calculated<br />
date <strong>of</strong> birth (June) corresponded to the middle <strong>of</strong> the observed breeding peak.<br />
Assuming a mean environmental temperature <strong>of</strong> 24°C and taking into account all the<br />
distributions, the mortality estimates were: Z=3.29, M=1.37 and F=1.92 for the age range<br />
showed in Figure G1-2. Given that the length frequency distributions were not adequate, it is<br />
likely that mortality was overestimated, particularly for a deep water species subjected to little<br />
if any exploitation in this part <strong>of</strong> the lake. <strong>The</strong> selectivity <strong>of</strong> the 35 mm cod end trawl net for<br />
this species was 120 mm.<br />
Alticorpus macrocleithrum<br />
A. macrocleithrum was not an abundant <strong>fish</strong> and only 437 specimens were measured<br />
over the sampling period. <strong>The</strong> length frequency distributions are presented in Figure G2-1.<br />
Two sets <strong>of</strong> growth estimates, correctly fitting the distributions and giving birth dates<br />
consistent with breeding observation were obtained: L J = 166, K = 0.92 (dashed line) and L J<br />
= 166, K = 0.6 (solid line). <strong>The</strong> calculated date <strong>of</strong> birth, May-June for the first set and July-<br />
August for the second corresponded to the middle <strong>of</strong> the observed breeding peak. Given the<br />
low number <strong>of</strong> individuals <strong>of</strong> the length frequency distributions, particularly in the small sizes<br />
(little peaks between 60 and 80 mm were all based on one or two <strong>fish</strong> only), it was difficult to<br />
decide for one or the other set <strong>of</strong> parameters.<br />
Assuming a mean environmental temperature <strong>of</strong> 24°C corresponding to the depth distribution<br />
<strong>of</strong> A. macrocleithrum (75 to 125 m) and taking into account all the distributions, the mortality<br />
estimates were: Z=6.04, M=1.86 and F=4.18 with L J =166, K=0.92 and Z=3.94, M=1.40 and<br />
F=2.54 with L J =166, K=0.6. <strong>The</strong> mean size at first capture by the 35 mm cod end trawl net<br />
for this species was 106 mm with both sets <strong>of</strong> parameters. In both cases, mortality estimates<br />
were high partly because the shapes <strong>of</strong> distributions were not adapted to calculate mortality<br />
parameters. However, the second set <strong>of</strong> mortality estimates, though overestimated, appeared<br />
more realistic, particularly for a deep water species subjected to little if any exploitation.<br />
Furthermore, with K=0.92, <strong>fish</strong> would reach their maximum size and die at the end <strong>of</strong> their<br />
second year, which appears too fast for a <strong>fish</strong> <strong>of</strong> this size compared to others related species.<br />
For these reasons, the set <strong>of</strong> parameters L J = 166 and K = 0.6 was chosen for the<br />
calculation <strong>of</strong> age at maturity and mortality estimates (Z=3.94, M=1.40 and F=2.54 for the<br />
age range showed in Figure G2-2).<br />
172
Jun Jul Aug Sep Oct Nov Dec Jan Feb Mar Apr May<br />
1998 1999<br />
FigureG3-1.Lengthfrequencyplotsfor A.mentale<br />
intheSWA<strong>of</strong><strong>Lake</strong><strong>Malawi</strong>.<br />
Relativeage(years-t0)<br />
Relativeage(years-t0)<br />
Figure G4-2.Lengthconvertedcatchcurvefor A.pectinatum.<br />
Jun Jul Aug Sep Oct Nov Dec Jan Feb Mar Apr May<br />
1998 1999<br />
FigureG4-1.LengthfrequencyplotsforA.pectinatum<br />
intheSWA<strong>of</strong><strong>Lake</strong><strong>Malawi</strong>.
Alticorpus mentale<br />
<strong>The</strong> length frequency distributions, based on 2150 <strong>fish</strong> are presented in Figure G3-1.<br />
Two year classes were identified by the s<strong>of</strong>tware, with L J =266 mm and K=0.7 (solid line).<br />
<strong>The</strong> calculated date <strong>of</strong> birth, April corresponded with a period <strong>of</strong> intense breeding activity.<br />
Assuming a mean environmental temperature <strong>of</strong> 24°C corresponding to the depth<br />
distribution <strong>of</strong> A. mentale (75 to 125 m) and considering only the June distribution, the<br />
mortality estimates were: Z=1.63, M=1.36 and F=0.27 for the age range showed in Figure G3-<br />
2. <strong>The</strong> mean size at first capture by the 35 mm cod end trawl net for this species was 91 mm.<br />
Another set <strong>of</strong> parameters provided a good fit <strong>of</strong> the distributions: LJ=256 mm and K=0.68<br />
(dashed line). <strong>The</strong> birth date, October-November also matched a period <strong>of</strong> intense breeding<br />
activity. However, the corresponding fit was going through a smaller number <strong>of</strong> large peaks<br />
than the first set <strong>of</strong> parameters, which was therefore considered better.<br />
Alticorpus pectinatum<br />
<strong>The</strong> length frequency distributions, based on 942 <strong>fish</strong> are presented in Figure G4-1.<br />
Three year classes were identified by the s<strong>of</strong>tware with L J =160 mm and K=0.58. <strong>The</strong><br />
calculated date <strong>of</strong> birth, December corresponded with a period <strong>of</strong> intense breeding activity.<br />
Assuming a mean environmental temperature <strong>of</strong> 24°C corresponding to the depth distribution<br />
<strong>of</strong> A. pectinatum (75 to 125 m) and considering only the October distribution, the mortality<br />
estimates were: Z=1.90, M=1.39 and F=0.51 for the age range showed in Figure G4-2. <strong>The</strong><br />
mean size at first capture by the 35 mm cod end trawl net for this species was 84 mm.<br />
Aulonocara spp.<br />
Aulonocara 'blue orange'<br />
<strong>The</strong> length frequency distributions, based on 7793 <strong>fish</strong> are presented in Figure G5-1.<br />
Au. 'blue orange' is a small species and juveniles were not caught by the net. Consequently a<br />
single year class was identified by the s<strong>of</strong>tware with L J =80 mm and K=1.21. <strong>The</strong> calculated<br />
date <strong>of</strong> birth, December-January corresponded with a peak <strong>of</strong> breeding activity.<br />
Assuming a mean environmental temperature <strong>of</strong> 26°C corresponding to the depth distribution<br />
<strong>of</strong> Au. 'blue orange' (10 to 30 m) and considering all the distributions, the mortality estimates<br />
were: Z=4.67, M=2.83 and F=1.84 for the age range showed in Figure G5-2. <strong>The</strong> mean size at<br />
first capture by the 35 mm cod end trawl net for this species was 51 mm. Although Au. 'blue<br />
orange' is a short lived fast growing species with a high natural mortality (M), the estimated<br />
total mortality was probably overestimated owing to the shape <strong>of</strong> length distributions.<br />
173
Jun Jul Aug Sep Oct Nov Dec Jan Feb Mar Apr May<br />
1998 1999<br />
Figure G5-1.Lengthfrequencyplotsfor Au.'blueorange' intheSWA<strong>of</strong><strong>Lake</strong><strong>Malawi</strong>.<br />
Relativeage(years-t0)<br />
Relativeage(years-t0)<br />
FigureG6-2.Lengthconvertedcatchcurvefor Au.'minutus' .<br />
Jun Jul Aug Sep Oct Nov Dec Jan Feb Mar Apr May<br />
1998 1999<br />
Figure G6-1.Lengthfrequencyplotsfor Au.'minutus' intheSWA<strong>of</strong><strong>Lake</strong><strong>Malawi</strong>.
Aulonocara 'minutus'<br />
<strong>The</strong> length frequency distributions, based on 4539 <strong>fish</strong> are presented in Figure G6-1.<br />
Au. 'minutus' is also a small species and juveniles were not caught by the net. Consequently a<br />
single year class was identified by the s<strong>of</strong>tware with L J =75 mm and K=1.44. <strong>The</strong> calculated<br />
date <strong>of</strong> birth, March corresponded with a period <strong>of</strong> intense breeding activity.<br />
Assuming a mean environmental temperature <strong>of</strong> 23.5°C corresponding to the depth<br />
distribution <strong>of</strong> Au. 'minutus' (75 to 125 m) and considering all the distributions, the mortality<br />
estimates were: Z=6.07, M=3.08 and F=2.99 for the age range showed in Figure G6-2. <strong>The</strong><br />
mean size at first capture by the 35 mm cod end trawl net for this species was 41 mm.<br />
Although Au. 'minutus' is a short lived fast growing species with a high natural mortality rate<br />
(M), mortality estimates were probably overestimated owing to the shape <strong>of</strong> length<br />
distributions. Indeed, <strong>fish</strong>ing mortality is likely to be close to zero in this deep part <strong>of</strong> the lake<br />
where almost no trawling activity takes place.<br />
Copadichromis spp.<br />
Copadichromis quadrimaculatus<br />
C. quadrimaculatus was a relatively rare <strong>fish</strong> and only 631 specimens were measured<br />
over the sampling period. <strong>The</strong> length frequency distributions are presented in Figure G7-1.<br />
Despite the low sample size, a reasonably good growth estimation was obtained with L J =160<br />
mm and K=0.58. <strong>The</strong> calculated date <strong>of</strong> birth, September corresponded with a period <strong>of</strong><br />
breeding activity.<br />
Assuming a mean environmental temperature <strong>of</strong> 25°C corresponding to the depth distribution<br />
<strong>of</strong> C. quadrimaculatus (10 to 75 m) and considering only the November and January<br />
distributions, the mortality estimates were: Z=1.95, M=1.41 and F=0.54 for the age range<br />
showed in Figure G7-2. <strong>The</strong> mean size at first capture by the 35 mm cod end trawl net for this<br />
species was 59 mm.<br />
Copadichromis virginalis<br />
<strong>The</strong> length frequency distributions, based on 11982 <strong>fish</strong> are presented in Figure G8-1.<br />
Two year classes were identified by the s<strong>of</strong>tware with L J =130 mm and K=0.84. <strong>The</strong><br />
calculated date <strong>of</strong> birth, May corresponded to the middle <strong>of</strong> the main peak <strong>of</strong> breeding<br />
activity.<br />
Assuming a mean environmental temperature <strong>of</strong> 25.5°C corresponding to the depth<br />
distribution <strong>of</strong> C. virginalis (10 to 50 m) and considering only the April distribution, the<br />
mortality estimates were: Z=3.55, M=1.93 and F=1.62 for the age range showed in Figure G8-<br />
2. <strong>The</strong> mean size at first capture by the 35 mm cod end trawl net for this species was 72 mm.<br />
174
Jun Jul Aug Sep Oct Nov Dec Jan Feb Mar Apr May<br />
1998 1999<br />
FigureG7-1.Lengthfrequencyplotsfor<br />
C.quadrimaculatus intheSWA<strong>of</strong><strong>Lake</strong><strong>Malawi</strong>.<br />
Relativeage(years-t0)<br />
Relativeage(years-t0)<br />
FigureG8-2.Lengthconvertedcatchcurvefor C.virginalis .<br />
Jun Jul Aug Sep Oct Nov Dec Jan Feb Mar Apr May<br />
1998 1999<br />
FigureG8-1.Lengthfrequencyplotsfor C.virginalis intheSWA<strong>of</strong><strong>Lake</strong><strong>Malawi</strong>.
Jun Jul Aug Sep Oct Nov Dec Jan Feb Mar Apr May<br />
1998 1999<br />
FigureG9-1.Lengthfrequencyplotsfor D.apogon intheSWA<strong>of</strong><strong>Lake</strong><strong>Malawi</strong>.<br />
Relativeage(years-t0)<br />
Relativeage(years-t0)<br />
FigureG10-2.Lengthconvertedcatchcurvefor D.argenteus.<br />
Jun Jul Aug Sep Oct Nov Dec Jan Feb Mar Apr May<br />
1998 1999<br />
FigureG10-1.LengthfrequencyplotsforD.argenteus<br />
intheSWA<strong>of</strong><strong>Lake</strong><strong>Malawi</strong>.
Jun Jul Aug Sep Oct Nov Dec Jan Feb Mar Apr May<br />
1998 1999<br />
FigureG11-1.Lengthfrequencyplotsfor D.limnothrissa intheSWA<strong>of</strong><strong>Lake</strong><strong>Malawi</strong>.<br />
A<br />
Relativeage(years-t0)<br />
B<br />
Relativeage(years-t0)<br />
Jun Jul Aug Sep Oct Nov Dec Jan Feb Mar Apr May<br />
1998 1999<br />
FigureG12-1.Lengthfrequencyplotsfor D.macrops<br />
intheSWA<strong>of</strong><strong>Lake</strong><strong>Malawi</strong>.
Diplotaxodon and Pallidochromis spp.<br />
Diplotaxodon apogon<br />
<strong>The</strong> length frequency distributions, based on 2754 <strong>fish</strong> are presented in Figure G9-1.<br />
Three year classes were identified by the s<strong>of</strong>tware with L J =140 mm and K=0.56. <strong>The</strong><br />
calculated date <strong>of</strong> birth, April corresponded to the end <strong>of</strong> the main peak <strong>of</strong> breeding activity.<br />
Assuming a mean environmental temperature <strong>of</strong> 23.5°C corresponding to the depth<br />
distribution <strong>of</strong> D. apogon (75 to 125 m) and considering all the distributions, the mortality<br />
estimates were: Z=2.86, M=1.39 and F=1.47 for the age range showed in Figure G9-2. <strong>The</strong><br />
mean size at first capture by the 35 mm cod end trawl net for this species was 80 mm.<br />
Diplotaxodon argenteus<br />
<strong>The</strong> length frequency distributions, based on 908 <strong>fish</strong> are presented in Figure G10-1.<br />
Two sets <strong>of</strong> parameters gave good fit <strong>of</strong> the distribution, each <strong>of</strong> them fitting three year<br />
classes. With the first set, L J =219 mm and K=0.78 (solid line), the date <strong>of</strong> birth was<br />
December. Assuming a mean environmental temperature <strong>of</strong> 24°C corresponding to the depth<br />
distribution <strong>of</strong> D. argenteus (50 to 125 m) and considering the November and December<br />
distributions only, the mortality estimates were: Z=2.19, M=1.54 and F=0.65 for the age range<br />
0.8 to 3 years. With the second set <strong>of</strong> parameters, L J =220 mm and K=0.62 (dashed line), the<br />
date <strong>of</strong> birth was April and the mortality estimates were: Z=1.74, M=1.33 and F=0.41 for the<br />
age range 0.8 to 4 years.<br />
<strong>The</strong> mean size at first capture by the 35 mm cod end trawl net for this species was 57 mm<br />
with both sets <strong>of</strong> parameters.<br />
Both fits were good, however, the dashed line went better through the middle <strong>of</strong> the major<br />
peaks whereas the solid line went <strong>of</strong>ten through the end <strong>of</strong> the peaks (ex. October or<br />
December). Next, a birth in April, during the major breeding season appeared more<br />
reasonable than a birth in December after a little isolated breeding peak based on low sample<br />
size. Furthermore, mortality estimates and life span (Figure G10-2) obtained with the second<br />
set <strong>of</strong> parameters (L J =220 mm, K=0.62, dashed line), also appeared more reasonable for a<br />
deep water species subjected to little if any exploitation.<br />
Consequently, the following parameters were considered to better represent the data and were<br />
used for the calculation <strong>of</strong> age at maturity: L J =220 mm, K=0.62, Z=1.74, M=1.33 and<br />
F=0.41.<br />
Diplotaxodon limnothrissa<br />
<strong>The</strong> length frequency distributions, based on 5823 <strong>fish</strong> are presented in Figure G11-1.<br />
Three year classes were identified by the s<strong>of</strong>tware (solid line), with L J =192 mm, K=0.64. <strong>The</strong><br />
calculated date <strong>of</strong> birth, July-August corresponded to the last two months <strong>of</strong> the breeding<br />
season.<br />
Assuming a mean environmental temperature <strong>of</strong> 24°C corresponding to the depth distribution<br />
<strong>of</strong> D. limnothrissa (50 to 125 m) and considering only the August, November and March<br />
distributions, the mortality estimates were: Z=3.48, M=1.41 and F=2.07 for the age range<br />
showed in Figure G11-2A. Given that the length frequency distributions were not adequate, it<br />
is likely that mortality estimates were overestimated, particularly for a deep water species<br />
175
Relativeage(years-t0)<br />
FigureG12-2.Lengthconvertedcatchcurvefor D.macrops.<br />
Jun Jul Aug Sep Oct Nov Dec Jan Feb Mar Apr May<br />
1998 1999<br />
FigureG13-1.Lengthfrequencyplotsfor P.tokolosh intheSWA<strong>of</strong><strong>Lake</strong><strong>Malawi</strong>.<br />
Relativeage(years-t0)<br />
FigureG13-2.Lengthconvertedcatchcurvefor P.tokolosh.
subjected to little if any exploitation in this part <strong>of</strong> the lake. <strong>The</strong> mean size at first capture by<br />
the 35 mm cod end trawl net for this species was 77 mm.<br />
More than one cohort per year class were present. <strong>The</strong> major peak in March appeared to be<br />
from the same year class that the lower peaks fitted by the solid lined model in February and<br />
April. <strong>The</strong> best estimation fitting that cohort (dashed line) was obtained with L J =188 mm,<br />
K=0.62. <strong>The</strong> calculated date <strong>of</strong> birth, May corresponded to the first two months <strong>of</strong> the<br />
breeding season. Mortality estimates were: Z=3.22, M=1.39 and F=1.83 for the age range<br />
showed in Figure G11-2B. <strong>The</strong> selectivity <strong>of</strong> the 10 mm cod end trawl net with this set <strong>of</strong><br />
parameters was 74 mm.<br />
<strong>The</strong>se two estimations, one taking into account the cohort born in the beginning <strong>of</strong> the<br />
breeding season, the other considering the cohort born at the end <strong>of</strong> the breeding season were<br />
very similar and gave very close growth and mortality estimates. <strong>The</strong> cohort born at the<br />
beginning <strong>of</strong> the breeding season (dashed line) had a slightly slower growth leading to an age<br />
at maturity <strong>of</strong> 16 months old whereas the cohort born at the end <strong>of</strong> the breeding season (solid<br />
line) reached maturity at 15 months old.<br />
Diplotaxodon macrops<br />
<strong>The</strong> length frequency distributions, based on 5778 <strong>fish</strong> are presented in Figure G12-1.<br />
Three year classes were identified by the s<strong>of</strong>tware with L J =143 mm, K=0.7. <strong>The</strong> calculated<br />
date <strong>of</strong> birth, September-October corresponded to the last months <strong>of</strong> the second peak <strong>of</strong><br />
breeding activity. No correct fit gave a birth in the major breeding peak (January-May).<br />
Assuming a mean environmental temperature <strong>of</strong> 23.5°C corresponding to the depth<br />
distribution <strong>of</strong> D. macrops (75 to 125 m) and considering all the distributions, the mortality<br />
estimates were: Z=3.12, M=1.6 and F=1.52 for the age range showed in Figure G12-2. Given<br />
that the length frequency distributions were not adequate, it is likely that mortality estimates<br />
were overestimated, particularly for a deep water species subjected to little if any exploitation<br />
in this part <strong>of</strong> the lake. <strong>The</strong> mean size at first capture by the 35 mm cod end trawl net for this<br />
species was 106 mm, which also appeared overestimated.<br />
Pallidochromis tokolosh<br />
P. tokolosh was not an abundant <strong>fish</strong> and only 375 specimens were measured over the<br />
sampling period. <strong>The</strong> length frequency distributions are presented in Figure G13-1. Despite<br />
the low sample size, a reasonably good growth estimation was obtained with L J =244 mm,<br />
K=0.62. <strong>The</strong> calculated date <strong>of</strong> birth, January corresponded to the middle <strong>of</strong> the observed<br />
breeding season.<br />
Assuming a mean environmental temperature <strong>of</strong> 23.5°C corresponding to the depth<br />
distribution <strong>of</strong> P. tokolosh (75 to 125 m) and considering the June, July, October, January and<br />
February distributions, the mortality estimates were: Z=2.06, M=1.28 and F=0.78 for the age<br />
range showed in Figure G13-2. <strong>The</strong> mean size at first capture by the 35 mm cod end trawl net<br />
for this species was 106 mm, which appeared overestimated though it translated the length<br />
distributions.<br />
176
Jun Jul Aug Sep Oct Nov Dec Jan Feb Mar Apr May<br />
1998 1999<br />
Figure G14-1.Lengthfrequencyplotsfor L.argenteus intheSWA<strong>of</strong><strong>Lake</strong><strong>Malawi</strong>.<br />
Relativeage(years-t0)<br />
Relativeage(years-t0)<br />
FigureG15-2.Lengthconvertedcatchcurvefor L.'dwaltus' .<br />
Jun Jul Aug Sep Oct Nov Dec Jan Feb Mar Apr May<br />
1998 1999<br />
FigureG15-1.Lengthfrequencyplotsfor L.'dwaltus'<br />
intheSWA<strong>of</strong><strong>Lake</strong><strong>Malawi</strong>.
Lethrinops spp.<br />
Lethrinops argenteus<br />
<strong>The</strong> length frequency distributions, based on 9225 <strong>fish</strong> are presented in Figure G14-1.<br />
Two year classes were identified by the s<strong>of</strong>tware with L J =182 mm, K=0.94. <strong>The</strong> calculated<br />
date <strong>of</strong> birth, August corresponded to a major peak <strong>of</strong> breeding activity.<br />
Assuming a mean environmental temperature <strong>of</strong> 25°C corresponding to the depth distribution<br />
<strong>of</strong> L. argenteus (10 to 50 m) and considering only the December and January distributions, the<br />
mortality estimates were: Z=4.38, M=1.87 and F=2.51 for the age range showed in Figure<br />
G14-2. <strong>The</strong> mean size at first capture by the 35 mm cod end trawl net for this species was 55<br />
mm.<br />
Lethrinops 'deep water altus'<br />
<strong>The</strong> length frequency distributions, based on 1510 <strong>fish</strong> are presented in Figure G15-1.<br />
Despite the relative homogeneity <strong>of</strong> length distribution among successive months, it was<br />
possible to fit a VBGC, which gave reasonable estimates with L J =142 mm, K=0.62. <strong>The</strong><br />
calculated date <strong>of</strong> birth, March corresponded to the main peak <strong>of</strong> sexual activity.<br />
Assuming a mean environmental temperature <strong>of</strong> 23.5°C corresponding to the depth<br />
distribution <strong>of</strong> L. 'deep water altus' (75 to 125 m) and considering only the December and<br />
January distributions, the mortality estimates were: Z=2.94, M=1.48 and F=1.46 for the age<br />
range showed in Figure G15-2. As the deep zone in this part <strong>of</strong> the lake is almost not<br />
exploited, it is very likely that mortality were overestimated owing to the under-representation<br />
<strong>of</strong> juveniles in the length distributions. <strong>The</strong> mean size at first capture by the 35 mm cod end<br />
trawl net for this species was 58 mm.<br />
Lethrinops gossei<br />
<strong>The</strong> length frequency distributions, based on 8072 <strong>fish</strong> are presented in Figure G16-1.<br />
<strong>The</strong> best combination was obtained with L J =185 mm, K=0.78. <strong>The</strong> calculated date <strong>of</strong> birth,<br />
March corresponded to the peak <strong>of</strong> breeding activity.<br />
Assuming a mean environmental temperature <strong>of</strong> 23.5°C corresponding to the depth<br />
distribution <strong>of</strong> L. gossei (75 to 125 m) and considering all the distributions, the mortality<br />
estimates were: Z=3.48, M=1.60 and F=1.88 for the age range showed in Figure G16-2. <strong>The</strong><br />
mean size at first capture by the 35 mm cod end trawl net for this species was 99 mm. Again,<br />
as the deep zone in this part <strong>of</strong> the lake is hardly exploited, it is very likely that mortality was<br />
overestimated owing to the inadequate length distributions.<br />
177
Jun Jul Aug Sep Oct Nov Dec Jan Feb Mar Apr May<br />
1998 1999<br />
FigureG16-1.Lengthfrequencyplotsfor L.gossei intheSWA<strong>of</strong><strong>Lake</strong><strong>Malawi</strong>.<br />
Relativeage(years-t0)<br />
Relativeage(years-t0)<br />
FigureG17-2.Lengthconvertedcatchcurvefor L.longimanus.<br />
Jun Jul Aug Sep Oct Nov Dec Jan Feb Mar Apr May<br />
1998 1999<br />
FigureG17-1.Lengthfrequencyplotsfor L.longimanus<br />
intheSWA<strong>of</strong><strong>Lake</strong><strong>Malawi</strong>.
Lethrinops longimanus<br />
L. longimanus was not an abundant <strong>fish</strong> and only 553 specimens were measured over<br />
the sampling period. <strong>The</strong> length frequency distributions are presented in Figure G17-1.<br />
Despite the low sample size and the lack <strong>of</strong> clear progression in length modes, a reasonable<br />
growth estimation was obtained with L J =160 mm, K=0.75. As it was impossible to determine<br />
the precise breeding season for this species, it was difficult to assess the quality <strong>of</strong> the<br />
calculated date <strong>of</strong> birth, August. However, it occurred at the period when most breeding<br />
activity was observed.<br />
Assuming a mean environmental temperature <strong>of</strong> 25°C corresponding to the depth distribution<br />
<strong>of</strong> L. longimanus (30 to 125 m) and considering all the distributions, the mortality estimates<br />
were: Z=3.00, M=1.67 and F=1.33 for the age range showed in Figure G17-2. <strong>The</strong> mean size<br />
at first capture by the 35 mm cod end trawl net for this species was 82 mm.<br />
Despite the poor appropriateness <strong>of</strong> the data set to this kind <strong>of</strong> study, the estimates were in<br />
agreement with the values obtained for other Lethrinops species <strong>of</strong> comparable size.<br />
Lethrinops 'oliveri'<br />
<strong>The</strong> length frequency distributions, based on 9020 <strong>fish</strong> are presented in Figure G18-1.<br />
As for the other small species a relative homogeneity <strong>of</strong> length distribution among successive<br />
months was observed. However, it was possible to fit a VBGC, which gave reasonable<br />
estimates with L J =110 mm, K=0.88. <strong>The</strong> calculated date <strong>of</strong> birth, June corresponded to the<br />
middle <strong>of</strong> the main breeding season.<br />
Assuming a mean environmental temperature <strong>of</strong> 23.5°C corresponding to the depth<br />
distribution <strong>of</strong> L. 'oliveri' (75 to 125 m) and considering all the distributions, the mortality<br />
estimates were: Z=4.31, M=2.0 and F=2.31 for the age range showed in Figure G18-2. <strong>The</strong><br />
mean size at first capture by the 35 mm cod end trawl net for this species was 60 mm. Again,<br />
as the deep zone in this part <strong>of</strong> the lake is lightly exploited, it is very likely that mortality was<br />
overestimated owing to the non adequate length distributions.<br />
Lethrinops polli<br />
<strong>The</strong> length frequency distributions, based on 1681 <strong>fish</strong> are presented in Figure G19-1.<br />
<strong>The</strong> best estimation was obtained with L J =134 mm, K=0.78. <strong>The</strong> calculated date <strong>of</strong> birth,<br />
August-September corresponded to the end <strong>of</strong> the main observed breeding season.<br />
Assuming a mean environmental temperature <strong>of</strong> 24°C corresponding to the depth distribution<br />
<strong>of</strong> L. polli (75 to 125 m) and considering only the July, August and May distributions, the<br />
mortality estimates were: Z=3.43, M=1.77 and F=1.66 for the age range showed in Figure<br />
G19-2. <strong>The</strong> mean size at first capture by the 35 mm cod end trawl net for this species was 71<br />
mm. Again, as the deep zone in this part <strong>of</strong> the lake is almost not exploited, it is very likely<br />
that mortality was overestimated owing to the non adequate length distributions.<br />
178
Jun Jul Aug Sep Oct Nov Dec Jan Feb Mar Apr May<br />
1998 1999<br />
FigureG18-1.Lengthfrequencyplotsfor L.'oliveri' intheSWA<strong>of</strong><strong>Lake</strong><strong>Malawi</strong>.<br />
Relativeage(years-t0)<br />
Relativeage(years-t0)<br />
Figure G19-2.Lengthconvertedcatchcurvefor L.polli.<br />
Jun Jul Aug Sep Oct Nov Dec Jan Feb Mar Apr May<br />
1998 1999<br />
FigureG19-1.Lengthfrequencyplotsfor L.polli<br />
intheSWA<strong>of</strong><strong>Lake</strong><strong>Malawi</strong>.
Jun Jul Aug Sep Oct Nov Dec Jan Feb Mar Apr May<br />
1998 1999<br />
FigureG20-1.Lengthfrequencyplotsfor<br />
M.anaphyrmus intheSWA<strong>of</strong><strong>Lake</strong><strong>Malawi</strong>.<br />
Relativeage(years-t0)<br />
Relativeage(years-t0)<br />
FigureG21-2.Lengthconvertedcatchcurvefor<br />
N.'argyrosoma'.<br />
Jun Jul Aug Sep Oct Nov Dec Jan Feb Mar Apr May<br />
1998 1999<br />
FigureG21-1.Lengthfrequencyplotsfor N.'argyrosoma'<br />
intheSWA<strong>of</strong><strong>Lake</strong><strong>Malawi</strong>.
Mylochromis spp.<br />
Mylochromis anaphyrmus<br />
<strong>The</strong> length frequency distributions, based on 3007 <strong>fish</strong> are presented in Figure G20-1.<br />
Three year classes were identified by the s<strong>of</strong>tware (solid line), with L J =180 mm, K=0.62. <strong>The</strong><br />
calculated date <strong>of</strong> birth, May corresponded to the main peak <strong>of</strong> breeding activity.<br />
More than one cohort per year class was present. <strong>The</strong> peaks <strong>of</strong> small sizes in March, April and<br />
May appeared to be from the same year class that the upper peaks fitted by the solid lined<br />
model in April and May. <strong>The</strong> best estimation fitting that cohort (dashed line) was obtained<br />
with L J =179 mm, K=0.52. <strong>The</strong> calculated date <strong>of</strong> birth, September corresponded to the last<br />
two months <strong>of</strong> the breeding season.<br />
However, the estimation taking into account the cohort born in the middle <strong>of</strong> the breeding<br />
season (solid line) fitted the distributions best and was selected for the calculations <strong>of</strong><br />
mortality. Assuming a mean environmental temperature <strong>of</strong> 26°C corresponding to the depth<br />
distribution <strong>of</strong> M. anaphyrmus (10 to 50 m) and considering all the distributions, the mortality<br />
estimates were: Z=2.22, M=1.46 and F=0.76 for the age range showed in Figure G20-2. <strong>The</strong><br />
mean size at first capture by the 35 mm cod end trawl net for this species was 72 mm.<br />
Nyassachromis spp.<br />
Nyassachromis 'argyrosoma'<br />
<strong>The</strong> length frequency distributions, based on 34235 <strong>fish</strong> are presented in Figure G21-1.<br />
As for the other small species a relative homogeneity <strong>of</strong> length distribution among successive<br />
months was observed. However, it was possible to fit a VBGC, which gave reasonable<br />
estimates with L J =100 mm, K=1. <strong>The</strong> calculated date <strong>of</strong> birth, December corresponded to the<br />
major peak <strong>of</strong> breeding activity.<br />
Assuming a mean environmental temperature <strong>of</strong> 26°C corresponding to the depth distribution<br />
<strong>of</strong> N. 'argyrosoma' (10 to 30 m) and considering all the distributions, the mortality estimates<br />
were: Z=4.38, M=2.34 and F=2.04 for the age range showed in Figure G21-2. <strong>The</strong> mean size<br />
at first capture by the 35 mm cod end trawl net for this species was 59 mm. Again, it is very<br />
likely that mortality was overestimated owing to the inadequate length distributions.<br />
179
Jun Jul Aug Sep Oct Nov Dec Jan Feb Mar Apr May<br />
1998 1999<br />
FigureG22-1.Lengthfrequencyplotsfor Pl.'platyrhynchos' intheSWA<strong>of</strong><strong>Lake</strong><strong>Malawi</strong>.<br />
Relativeage(years-t0)<br />
Relativeage(years-t0)<br />
FigureG23-2.Lengthconvertedcatchcurvefor<br />
T.brevirostris.<br />
Jun Jul Aug Sep Oct Nov Dec Jan Feb Mar Apr May<br />
1998 1999<br />
FigureG23-1.Lengthfrequencyplotsfor<br />
T.brevirostris intheSWA<strong>of</strong><strong>Lake</strong><strong>Malawi</strong>.
Placidochromis spp.<br />
Placidochromis 'platyrhynchos'<br />
<strong>The</strong> length frequency distributions, based on 1053 <strong>fish</strong> are presented in Figure G22-1.<br />
<strong>The</strong> best estimation, fitting two year classes, was obtained with L J =132 mm, K=0.9. <strong>The</strong><br />
calculated date <strong>of</strong> birth, April corresponded to the middle <strong>of</strong> the main observed breeding<br />
season.<br />
Assuming a mean environmental temperature <strong>of</strong> 23.5°C corresponding to the depth<br />
distribution <strong>of</strong> P. 'platyrhynchos' (75 to 125 m) and considering only the March distribution,<br />
the mortality estimates were: Z=2.43, M=1.93 and F=0.5 for the age range showed in Figure<br />
G22-2. <strong>The</strong> mean size at first capture by the 35 mm cod end trawl net for this species was 64<br />
mm.<br />
Trematocranus spp.<br />
Trematocranus brevirostris<br />
<strong>The</strong> length frequency distributions, based on 3371 <strong>fish</strong> are presented in Figure G23-1.<br />
As for the other small species a relative homogeneity <strong>of</strong> length distribution among successive<br />
months was observed. However, it was possible to fit a VBGC, which gave reasonable<br />
estimates with L J =100 mm, K=0.79. <strong>The</strong> calculated date <strong>of</strong> birth, September seemed to<br />
correspond with a period <strong>of</strong> breeding activity.<br />
Assuming a mean environmental temperature <strong>of</strong> 25°C corresponding to the depth distribution<br />
<strong>of</strong> T. brevirostris (around 50 m) and considering all the distributions, the mortality estimates<br />
were: Z=2.99, M=1.97 and F=1.02 for the age range showed in Figure G23-2. <strong>The</strong> mean size<br />
at first capture by the 35 mm cod end trawl net for this species was 55 mm.<br />
180
Table G2. Growth parameters for 23 cichlid species from the SWA <strong>of</strong> <strong>Lake</strong> <strong>Malawi</strong>. L J and K are the parameters<br />
<strong>of</strong> the Von Bertalanffy growth curve equation (VBGC). <strong>The</strong> TMM (mean maximum observed length) is the<br />
average length <strong>of</strong> the ten largest <strong>fish</strong> caught (de Merona 1983, Moreau & Nyakageni 1992). K' and L J ' are rapid<br />
growth estimates calculated as follows: L J ' = 1,248 TMM, K' = 153 / L J ' (de Merona 1983). ∆G: growth<br />
difference at 2 years old obtained by fitting the VBCG with both sets <strong>of</strong> estimates (L J ', K' and L J , K). Values<br />
indicate the magnitude <strong>of</strong> growth overestimation by the rapid growth estimation model.<br />
L J (mm) K (year -1 ) TMM (mm) L J ' (mm) K' (year -1 ) D G (mm)<br />
A. 'ge<strong>of</strong>freyi' 181 0,6 158,2 197 0,77 29<br />
A. macrocleithrum 166 0,6 138,1 172 0,89 27<br />
A. mentale 266 0,7 229 286 0,54 -13<br />
A. pectinatum 160 0,58 134,5 168 0,91 31<br />
Au. 'blue orange' 80 1,21 72,6 91 1,69 15<br />
Au. 'minutus' 75 1,44 67,4 84 1,82 11<br />
C. quadrimaculatus 160 0,58 147,5 184 0,83 39<br />
C. virginalis 130 0,84 120,4 150 1,02 25<br />
D. apogon 140 0,56 123,1 154 1,00 38<br />
D. argenteus 220 0,62 197 246 0,62 19<br />
D. limnothrissa 188 0,62 167,9 210 0,73 27<br />
D. macrops 143 0,7 131,2 164 0,93 31<br />
P. tokolosh 244 0,62 205,6 257 0,60 5<br />
L. argenteus 182 0,94 156,5 195 0,78 0<br />
L. 'deep water altus' 142 0,62 115 144 1,07 26<br />
L. gossei 185 0,78 164,4 205 0,75 13<br />
L. longimanus 160 0,75 136,5 170 0,90 18<br />
L. 'oliveri' 110 0,88 96,3 120 1,27 20<br />
L. polli 134 0,78 110,5 138 1,11 17<br />
M. anaphyrmus 180 0,62 159 198 0,77 28<br />
N. 'argyrosoma' 100 1 93,7 117 1,31 22<br />
Pl. 'platyrhynchos' 132 0,9 114 142 1,08 16<br />
Tr. Brevirostris 100 0,79 80,9 101 1,52 17<br />
50<br />
40<br />
y = -0,0038x 2 + 1,0062x - 40,253<br />
R 2 = 0,5414<br />
30<br />
G (mm)<br />
20<br />
10<br />
0<br />
-10<br />
-20<br />
50 100 150 200 250<br />
TMM (mm)<br />
Figure G27. Distribution <strong>of</strong> G in relation with mean maximum observed length (TMM).<br />
181
Discussion<br />
As expected from the extended breeding seasons displayed by the studied species,<br />
more than one cohort per year class was usually present in the length frequency distributions.<br />
Knowledge about the species biology significantly helped us choosing among the various sets<br />
<strong>of</strong> growth parameters that correctly fitted the distributions. In particular, for a similar "quality<br />
<strong>of</strong> distribution's fitting", we always selected the set <strong>of</strong> parameters that gave a birth date<br />
consistent with the breeding season observed for the species (see previous Chapter). For this,<br />
we considered that the potential bias associated with the assumption that growth curve<br />
parameters applied right to zero, and not merely to the smallest sampled sizes (between 45<br />
and 60 mm depending on species) was negligible. Although the breeding seasonality <strong>of</strong><br />
species was studied over a single annual cycle, previous investigations over more than one<br />
annual cycle have suggested little or no inter annual variability <strong>of</strong> breeding patterns (Iles<br />
1971, Tweddle & Turner 1977). Also, we decided to keep the asymptotic length (LJ) within a<br />
controlled ranged. <strong>The</strong> trawl, with its 35 mm cod end mesh size is a non species-selective<br />
gear, catching <strong>fish</strong> from about 50 mm (see the estimated length at first capture for the studied<br />
species) to more than 300 mm (ex. Buccochromis spp.). Large and fast predatory species such<br />
as Rhamphochromis spp. were also caught, sometimes to sizes up to 500 mm. As a<br />
consequence and given the large numbers <strong>of</strong> specimens caught for most <strong>of</strong> the species, we<br />
considered that the maximum observed lengths were likely to be close to the asymptotic<br />
lengths, for the sampled area. <strong>The</strong>refore, LJ was intentionally kept within a range <strong>of</strong> 1 to 2<br />
cm above the maximum observed length for the medium and large species, and within a few<br />
millimetres above for the smallest species (Au. 'bue orange', Au. 'minutus', N. 'argyrosoma',<br />
T. brevirostris).<br />
Growth factor (K) values ranged from 0.56 to 1.44, averaging 0.77 (Table G2). As<br />
expected given the inverse relationship between LJ and K (de Merona et al. 1988), the<br />
smallest species (L J < 100 mm) had the highest K, ranging from 0.79 to 1.44 with an average<br />
value <strong>of</strong> 1.11. However, the largest species (A. mentale, P. tokolosh and D. argenteus) did not<br />
have the lowest K. Medium sized species did have them. For comparative purposes, growth<br />
estimates <strong>of</strong> individual species were fitted by the VBGC equation and grouped per genera or<br />
size classes (Figure G24). <strong>The</strong> VBGC have been fitted up to the maximum observed length<br />
(MOL) <strong>of</strong> species. Within a single genus, species with comparable lengths had slight growth<br />
differences, though usually not higher than 1 cm at 2 years old as illustrated by A.<br />
macrocleithrum and A. pectinatum (Figure G24a), D. apogon and D. macrops (Figure G24b),<br />
L. argenteus and L. gossei (Figure G24c) or Au. 'blue orange' and Au. 'minutus' (Figure<br />
G24d). Growth performances <strong>of</strong> species within genera, as expressed by length at age, were<br />
proportional to their maximum length for Alticorpus, Diplotaxodon and Lethrinops spp., with<br />
the exception <strong>of</strong> L. 'deep water altus' having a slower growth than the smaller L. polli.<br />
Between genera comparison for species <strong>of</strong> similar lengths showed that Lethrinops spp. had<br />
better growth than Alticorpus and Diplotaxodon spp. (see L. argenteus and gossei versus A.<br />
'ge<strong>of</strong>freyi' and D. limnothrissa). Lethrinops versus Copadichromis spp. comparisons were less<br />
clear as the similarly sized C. virginalis and L. polli had equivalent growths whereas C.<br />
quadrimaculatus had a slower growth than L. longimanus. A. pectinatum and C.<br />
quadrimaculatus had the same growth estimates and logically presented exactly the same<br />
growth curves, as did A. 'ge<strong>of</strong>freyi' and M. anaphyrmus (Figure G24a). Apart from L. 'deep<br />
water altus', which growth was intermediate to those <strong>of</strong> D. macrops and D. apogon,<br />
Lethrinops species tended to have better growths than species <strong>of</strong> others genera with similar<br />
sizes.<br />
182
a<br />
300<br />
250<br />
A. 'ge<strong>of</strong>freyi'<br />
Length at age (mm)<br />
200<br />
150<br />
100<br />
A. macrocleithrum<br />
A. mentale<br />
A. pectinatum<br />
C. quadrimaculatus<br />
50<br />
C. virginalis<br />
M. anaphyrmus<br />
0<br />
0 1 2 3 4 5<br />
Age (year)<br />
b<br />
250<br />
200<br />
D. apogon<br />
Length at age (mm)<br />
150<br />
100<br />
D. argenteus<br />
D. limnothrissa<br />
50<br />
D. macrops<br />
P. tokolosh<br />
0<br />
0 1 2 3 4 5<br />
Age (year)<br />
Figure G24. Von Bertalanffy growth curves for cichlid species caught by trawling in the SWA<br />
<strong>of</strong> <strong>Lake</strong> <strong>Malawi</strong> between June 1998 and May 1999. a: Alticorpus, Copadichromis &<br />
Mylochromis spp., b: Diplotaxodon & Pallidochromis spp..<br />
183
c<br />
180<br />
160<br />
140<br />
L. argenteus<br />
Length at age (mm)<br />
120<br />
100<br />
80<br />
60<br />
L. 'dw altus'<br />
L. gossei<br />
L. longimanus<br />
40<br />
L. 'oliveri'<br />
20<br />
L. polli<br />
0<br />
0 1 2 3 4 5<br />
Age (year)<br />
d<br />
140<br />
120<br />
Au. 'blue orange'<br />
Length at age (mm)<br />
100<br />
80<br />
60<br />
Au. 'minutus'<br />
N. 'argyrosoma'<br />
40<br />
Pl. 'platyrhynchos'<br />
20<br />
Tr. brevirostris<br />
0<br />
0 1 2 3 4 5<br />
Age (year)<br />
Figure G24. Von Bertalanffy growth curves for cichlid species caught by trawling in the SWA<br />
<strong>of</strong> <strong>Lake</strong> <strong>Malawi</strong> between June 1998 and May 1999. c: Lethrinops spp., d: miscellaneous<br />
small species.<br />
184
For a same population, values <strong>of</strong> LJ and K can significantly vary from one cohort to<br />
another (Craig 1978). Examples <strong>of</strong> multiple cohorts within a same year class were given by A.<br />
mentale, D. limnothrissa and M. anaphyrmus, though they appeared for most <strong>of</strong> the medium<br />
and large species. For these three species, growth estimates <strong>of</strong> the two cohorts resulted in<br />
different growth performances (Figure G25).<br />
300<br />
250<br />
Length at age (mm)<br />
200<br />
150<br />
100<br />
A. mentale A. mentale 2<br />
50<br />
D. limnothrissa D. limnothrissa 2<br />
M. anaphyrmus M. anaphyrmus 2<br />
0<br />
0 1 2 3 4 5<br />
Age (years)<br />
Figure G25. Von Bertalanffy growth curves illustrating differences among cohorts for three<br />
species caught by trawling in the SWA <strong>of</strong> <strong>Lake</strong> <strong>Malawi</strong> between June 1998 and May 1999.<br />
Alticorpus mentale = cohort born in April (L J = 266, K = 0.7), A. mentale 2 = cohort born<br />
in October-November (L J = 256, K = 0.68). Diplotaxodon limnothrissa = cohort born in<br />
May (L J = 188, K = 0.62), D. limnothrissa 2 = cohort born in July-August (L J = 192, K =<br />
0.64). Mylochromis anaphyrmus = cohort born in May (L J = 180, K = 0.62), M.<br />
anaphyrmus 2 = cohort born in September (L J = 179, K = 0.52).<br />
For A. mentale, the cohort born in April had a length <strong>of</strong> 200 mm at 2 years old against 190<br />
mm for the cohort born in October-November (5.5 % difference). For D. limnothrissa the<br />
respective lengths at 2 years old were 134 mm for the cohort born in May and 139 mm for the<br />
cohort born in July-August (4% difference). <strong>The</strong> largest length difference at 2 years old<br />
(10.4%) was observed for M. anaphyrmus: 128 mm and 116 mm for the cohorts born in May<br />
and September, respectively. <strong>The</strong>se growth differences appeared after only a few months and<br />
were already marked at one year old. This means that for <strong>fish</strong> <strong>of</strong> a same population, growth<br />
depends upon the period <strong>of</strong> birth, thus <strong>of</strong> the prevailing environmental conditions. <strong>The</strong> most<br />
important environmental parameters influencing growth are temperature, oxygen and food<br />
availability (Pauly 1980, Caulton 1982, Pitcher & Hart 1982, Wootton 1990). For the deep<br />
water species (A. mentale, D. limnothrissa) temperature variations over the year (less than two<br />
degrees, Figure G26a) were unlikely to influence growth. In the depth distribution <strong>of</strong> M.<br />
anaphyrmus, temperature variations were more important (between 4 and 5°C). However,<br />
during the period separating the two cohorts (May with best growth and September)<br />
temperature were at their minimum and increased from August until the next cold season<br />
(May to August). Temperature is therefore unlikely to account for the observed growth<br />
185
differences. <strong>The</strong> opposite pattern is observed for oxygen (Figure G26b) with higher seasonal<br />
fluctuations in the deep waters (about 5 mg.l -1 ) than in the shallows (less than 2 mg.l -1 ). In the<br />
deep zone, oxygen concentration increased from February to August and then decreased from<br />
September to January. For A. mentale (which presented the highest growth difference in the<br />
deep zone), the cohort with the slowest growth (born in October-November) faced a two fold<br />
decrease in oxygen concentration during its first three months. In December and January D.O.<br />
got down to 1.5 mg.l -1 , which represented about 17% saturation at 23°C and 100 m depth. It<br />
has been shown that growth <strong>of</strong> tilapia, which are well known to tolerate very low D.O., is<br />
reduced below 25% saturation (review by Chervinski 1982). Exposition to such low D.O.<br />
during at least two months might partly account for the observed growth difference between<br />
the cohorts. However both cohorts encountered periods <strong>of</strong> low oxygen concentration during<br />
their first six months and growth differences between cohorts were also observed for species<br />
which did not face low D.O. (M. anaphyrmus). Variations in food availability appears a more<br />
plausible explanation though little is known about seasonal variations <strong>of</strong> food availability for<br />
these three species with marked different feeding regimes: piscivorous, zooplanktivorous and<br />
malacophageous for A. mentale, D. limnothrissa and M. anaphyrmus, respectively (see<br />
chapter "Diet"). Nevertheless, whatever caused these growth differences among cohorts, it is<br />
striking that differences remained over time. Indeed, compensatory growth is well<br />
documented in <strong>fish</strong> and cichlids (review in Weatherley & Gill 1987, Melard et al. 1997). In<br />
<strong>Malawi</strong> cichlids for which fasting periods imposed by mouthbrooding are frequent, genuine<br />
capacities to buffer these periods are expected and probably exist (see Chapter 6).<br />
Temperature (°C)<br />
D.O. (mg/l)<br />
22 23 24 25 26 27 28 29<br />
0 1 2 3 4 5 6 7 8 9 10<br />
-10<br />
-10<br />
-30<br />
-30<br />
Depth (m)<br />
-50<br />
-70<br />
June-98<br />
July-98<br />
August-98<br />
October-98<br />
Depth (m)<br />
-50<br />
-70<br />
November-98<br />
December-98<br />
-90<br />
January-99<br />
March-99<br />
-90<br />
April-99<br />
-110<br />
May-99<br />
-110<br />
a<br />
b<br />
Figure G26. Seasonal variations <strong>of</strong> thermocline (a) and oxycline (b) at our 100 m transect in<br />
the SWA, <strong>Lake</strong> <strong>Malawi</strong>.<br />
186
Equations allowing rapid estimation <strong>of</strong> Von Bertalanffy growth parameters were<br />
proposed for <strong>Africa</strong>n freshwater <strong>fish</strong>es (de Merona 1983). <strong>The</strong>se equations, based on 111<br />
species, were:<br />
L J ' = 1.248 TMM and K' = 153 / LJ'<br />
TMM being the mean maximum length, usually calculated as the mean length <strong>of</strong> the ten<br />
largest specimen caught (Moreau & Nyakageni 1992). K' and L J ' were calculated for our<br />
species and compared with K and LJ obtained from length progression analysis (Table G2).<br />
Rapid estimates <strong>of</strong> asymptotic length (L J ') were always higher than the corresponding LJ,<br />
except for L. 'deep water altus', L. polli and Tr. brevirostris for which values were close. <strong>The</strong><br />
same trend was observed with rapid estimates <strong>of</strong> the growth factor (K'), generally much<br />
higher than the K obtained from length frequencies. However, for the five largest and fastest<br />
growing species (A. mentale, D. argenteus, P. tokolosh, L. argenteus and L. gossei), rapid<br />
estimates were equal or lower than the observed K. <strong>The</strong> lack <strong>of</strong> fitting between the rapid<br />
growth estimates model and the estimates resulting from length progression analysis may lie<br />
in the fact that only half <strong>of</strong> the 111 species on which the model is based were cichlids, and<br />
most <strong>of</strong> them were tilapiine cichlids (de Merona 1983, de Merona et al. 1988). Only 9 species<br />
out <strong>of</strong> 111 were haplochromine cichlids. Next, the aim to this rapid growth estimates model<br />
was to provide a quick and reasonably reliable way to assess growth in absence <strong>of</strong> suitable<br />
data for other methods, not to replace them. <strong>The</strong> rapid growth estimation model does not seem<br />
well adapted to haplochromine cichlids, for which it tends to overestimate growth by an<br />
average value <strong>of</strong> 20 mm (∆G) at 2 years old. However, the overestimation tended to be lower<br />
for small and large species than for medium sized ones (Figure G27).<br />
1,6<br />
1,4<br />
1,2<br />
K (year -1 )<br />
1<br />
0,8<br />
0,6<br />
0,4<br />
0,2<br />
0<br />
y = 57,362x -0,8845<br />
R 2 = 0,5756<br />
0 50 100 150 200 250 300 350 400 450<br />
Asymptotic length (mm)<br />
Figure G28. Relationship between K and L J for 87 species <strong>of</strong> <strong>Africa</strong>n cichlids. Grey spots =<br />
data from de Merona 1983, de Merona et al. (1988). Black spots = data from Iles (1971)<br />
and Tweddle & Turner (1977) for <strong>Malawi</strong> haplochromine cichlids, adjusted in SL by de<br />
Merona et al. (1988). Black triangles = data from Iles (1971) and Tweddle & Turner<br />
(1977) for <strong>Malawi</strong> haplochromine cichlids recalculated using ELEFAN by Moreau et al.<br />
(1995) and adjusted in SL using equation (1) (see Material and Methods). White square =<br />
Diplotaxodon limnothrissa from Thompson et al. (1995) adjusted in SL using equation (1).<br />
White triangles = data from this study.<br />
187
Growth data available for 86 <strong>Africa</strong>n cichlid species from Iles (1971), Tweddle &<br />
Turner (1977), de Merona (1983), de Merona et al. (1988), Moreau et al. (1995), and this<br />
study, were used to produce a general relationship between K and LJ and to check how our<br />
estimates were fitting in it (Figure G28). Our estimates were within the range <strong>of</strong> <strong>report</strong>ed<br />
values for other <strong>Africa</strong>n cichlids and <strong>Malawi</strong>an haplochromines and set new references for<br />
small species with asymptotic length below 100 mm. Out <strong>of</strong> the 23 species we studied, four<br />
had already been studied for growth parameters: Copadichromis quadrimaculatus, C.<br />
virginalis (Iles 1971, recalculated by Moreau et al. 1995), Diplotaxodon limnothrissa<br />
(Thompson et al. 1995) and Mylochromis anaphyrmus (Tweddle & Turner 1997, recalculated<br />
by Moreau et al. 1995). As growth estimates can vary from one cohort to another within a<br />
same population (Craig 1978, de Merona 1983 for review, this study), comparing our results<br />
with growth estimates obtained 20 to 30 years ago (Iles 1971, Tweddle & Turner 1977) in<br />
different geographic areas may appear useless. However, despite the time and distance<br />
separating the estimations, growth differences for a same species at 2 years old (calculated<br />
using equation 2) were within the range <strong>of</strong> the differences we found among cohorts <strong>of</strong> a same<br />
species, though growth performances were always better with our estimates. More striking<br />
were the differences <strong>of</strong> longevity we found compared to Iles's (1971) and Tweddle & Turner's<br />
(1977), who <strong>report</strong>ed 5 to 6 years life span. As illustrated on Figure G24, the species were not<br />
growing older than 4.5 to 5 years, and most <strong>of</strong> them no older than 4 years. Similar life span<br />
were found by Moreau et al. (1995) from Iles's (1971) and Tweddle &Turner's (1977) data<br />
reanalysed using FiSAT package. Haplochromines and non tilapiine cichlids from other lakes<br />
also lived between 2 and 4.5 years (Moreau et al. 1995), which tends to confirm shorter life<br />
span than previously thought for non tilapiine cichlids. Attempts to determine accurately<br />
mortality rates were <strong>of</strong>ten not successful. Indeed, though within the range <strong>of</strong> mortality values<br />
<strong>report</strong>ed for <strong>Malawi</strong> cichlids (Tweddle & Turner 1977, Moreau et al. 1995), mortality rates<br />
<strong>of</strong>ten appeared overestimated. Given the low <strong>fish</strong>ing exploitation in the sampled area,<br />
reasonable estimates <strong>of</strong> instantaneous mortality rate (Z), particularly for the deep water<br />
species, should have been close to natural mortality estimates (M), which usually seemed<br />
reasonable. This was seldom the case. <strong>The</strong> reason mainly lie in the fact that length<br />
distributions were biased by lack or under-representation <strong>of</strong> smaller individuals. However,<br />
this is a common problem in <strong>Lake</strong> <strong>Malawi</strong> and even though juveniles were caught by <strong>fish</strong>ing<br />
gears, it would be <strong>of</strong> little help considering the identification problems that would result.<br />
Consequently, though mortality rates were probably overestimated, they remain a useful basis<br />
for <strong>fish</strong>eries and trophic modelling.<br />
188
Chapter 4:<br />
Temporal diet patterns <strong>of</strong> some <strong>Lake</strong><br />
<strong>Malawi</strong> demersal <strong>fish</strong> species as<br />
revealed by stomach contents and<br />
stable isotope analysis
Chapter 4: Temporal diet patterns <strong>of</strong> some <strong>Lake</strong> <strong>Malawi</strong> demersal<br />
<strong>fish</strong> species as revealed by stomach contents and stable isotope<br />
analysis<br />
F. Duponchelle, H. Bootsma, A.J. Ribbink, C. Davis, A. Msukwa, J. Mafuka & D. Mandere<br />
Introduction<br />
<strong>Cichlid</strong>s have evolved an astonishing diversity <strong>of</strong> feeding adaptations and behaviours<br />
that enable them to utilise virtually any kind <strong>of</strong> food, from phytoplankton, epilithic and<br />
epiphytic algae, plants, detritus, zooplankton, molluscs, insects, benthic invertebrates, <strong>fish</strong><br />
eggs, larvae, eyes, and scales, to whole <strong>fish</strong> (reviews in Fryer & Iles 1972, Ribbink 1990,<br />
Yamaoka 1991). <strong>The</strong> role <strong>of</strong> the feeding apparatus and trophic specialisations in the adaptive<br />
radiation <strong>of</strong> <strong>Africa</strong>n cichlids has <strong>of</strong>ten been discussed (Fryer & Iles 1972, Liem 1980, 1991,<br />
McKaye & Marsh 1983, Ribbink et al. 1983, Reinthal 1990, Ribbink 1990, Yamaoka 1991).<br />
<strong>The</strong> understanding <strong>of</strong> how such rich and diverse <strong>fish</strong> communities with apparently similar<br />
food requirements can coexist still challenges ecologists. In <strong>Lake</strong> <strong>Malawi</strong>, since Fryer's<br />
(1959) suggestion that the mbuna community was violating the Gaussian principle <strong>of</strong><br />
competitive exclusion, several studies have provided evidences that food partitioning may<br />
reduce interspecific competition and allow coexistence among rock-dwelling cichlids <strong>fish</strong>es<br />
(McKaye & Marsh 1983, Marsh & Ribbink 1985, Reinthal 1990, Bootsma et al. 1996, Genner<br />
et al. 1999a, 1999b, 1999c). Similar conclusions have resulted from research in <strong>Lake</strong><br />
Tanganyika (Sturmbauer et al. 1992) and Victoria (Bouton et al. 1997). However, while diet,<br />
feeding behaviour and trophic specialisations have been, and still are, intensely studied in<br />
<strong>Malawi</strong>an rock-dwelling species, very little is known <strong>of</strong> the divers <strong>of</strong>fshore (sensu Turner<br />
1996) cichlid communities. Apart from the zooplanktivorous utaka group (Copadichromis<br />
spp.) (Fryer & Iles 1972), the chambo (Oreochromis spp., Turner et al. 1991b) and the pelagic<br />
species, whose feeding <strong>ecology</strong> was recently thoroughly studied (Allison et al. 1996,<br />
Ngatunga & Allison 1996), the only information available on the diet <strong>of</strong> <strong>of</strong>fshore <strong>fish</strong>es comes<br />
from Eccles & Trewavas (1989) and Turner (1996). <strong>The</strong>se studies resulted in useful now<br />
insights into <strong>fish</strong> feeding habits, but they were limited by the relatively small numbers <strong>of</strong><br />
observations and the limited time span over which <strong>fish</strong> stomach contents were monitored. <strong>The</strong><br />
currently running European Union Project: "<strong>The</strong> trophic <strong>ecology</strong> <strong>of</strong> the demersal <strong>fish</strong><br />
community <strong>of</strong> lake <strong>Malawi</strong>/Niassa", partly aimed at filling this gap, will improve our<br />
knowledge. However, the seasonal variability <strong>of</strong> <strong>fish</strong> diet is not a priority <strong>of</strong> the EU Project.<br />
<strong>The</strong> temporal aspect <strong>of</strong> demersal <strong>fish</strong> diets was investigated in the context <strong>of</strong> a general<br />
program designed to assess the seasonal progression <strong>of</strong> distribution, abundance and diversity<br />
<strong>of</strong> the <strong>fish</strong> species exploited by demersal trawling and to determine their main life history<br />
characteristics. Such a study had been considered when the new "Ecology program" had<br />
started in June 1998, but had been cancelled because the research actions already undergone<br />
were too time and people-consuming to allow the addition <strong>of</strong> another program. However,<br />
when a new staff member detached from the World University Service <strong>of</strong> Canada (WUSC)<br />
joined the <strong>ecology</strong> team <strong>of</strong> the project in October 1998, the study was reconsidered and<br />
initiated in November 1998. However, since the program ended in June 1999, an entire annual<br />
189
cycle could not be studied. We decided to determine the diet and its potential seasonal<br />
variability for the nine target species retained for the life history study (Lethrinops gossei,<br />
Lethrinops argenteus = L. longipinnis 'orange head', Diplotaxodon limnothrissa,<br />
Diplotaxodon macrops, Copadichromis virginalis, Mylochromis anaphyrmus, Alticorpus<br />
mentale, Alticorpus macrocleithrum and Taeniolethrinops praeorbitalis) with both monthly<br />
stomach content and stable isotope analysis. Whereas stomach content analysis provides<br />
insight into the ingested food items over a short time period, stable isotope signatures<br />
represent a spatio-temporal integration <strong>of</strong> the assimilated food over long time periods varying<br />
from months to years depending on <strong>fish</strong> growth rates (Peterson & Fry 1987, Hesslein et al.<br />
1991, 1993, Bootsma et al. 1996, Gannes et al. 1997, Gorokhova & Hansson 1999, Fry et al.<br />
1999). Stable isotope analysis is particularly useful for deep-water species that <strong>of</strong>ten have<br />
inverted stomachs when retrieved from trawls.<br />
Material and methods<br />
Stomach content analysis<br />
Seasonal variability <strong>of</strong> diet was estimated over 8 months for the nine target species.<br />
Fish were collected from the monthly trawl survey in the north <strong>of</strong> the South West Arm<br />
(SWA). Every month from November 1998 to May 1999, 20 specimens <strong>of</strong> each species were<br />
sampled from the main catch as soon as the total catch weight was estimated. 15% formalin<br />
was injected in the abdominal cavity <strong>of</strong> each <strong>fish</strong> to ensure the preservation <strong>of</strong> food items and<br />
the <strong>fish</strong> were fixed in 10% formalin for later examination. A frequently encountered problem<br />
when trawling below 50m depth is that the stomachs are <strong>of</strong>ten burst out <strong>of</strong> the <strong>fish</strong> mouths<br />
during hauling. For Alticorpus mentale, whose stomachs were almost systematically empty,<br />
every specimen from the whole catch was checked for intact stomachs. Even apparently intact<br />
stomachs <strong>of</strong>ten contained only very little amounts <strong>of</strong> remaining food items.<br />
When enough intact stomachs were available, 5 specimens <strong>of</strong> each species were<br />
analysed each month for diet composition. For the sake <strong>of</strong> data compatibility, the method used<br />
was the modified version <strong>of</strong> the "point method" (Hynes 1950) selected by the ongoing EU<br />
Project: "<strong>The</strong> trophic <strong>ecology</strong> <strong>of</strong> the demersal <strong>fish</strong> community <strong>of</strong> lake <strong>Malawi</strong>/Niassa"<br />
(Darwall, 1999). <strong>The</strong> weight <strong>of</strong> the stomach plus content and the stomach minus content were<br />
determined to the nearest 0.001g. Total weight <strong>of</strong> stomach contents was calculated as the<br />
difference between the two weights. <strong>The</strong> stomach content was then examined under binocular<br />
microscope (10X to 40X magnification). All identifiable items were grouped into separate<br />
piles and allocated one <strong>of</strong> the following value: 16, 8, 4, 2, 1, or P (if present but in negligible<br />
amounts). <strong>The</strong> most abundant items were allocated a 16 and the others items were allocated a<br />
16, 8, 4, 2, 1 or P depending upon their abundance relative to the most abundant item. All the<br />
small items unidentifiable under the binocular were pooled under a pile <strong>of</strong> "Small<br />
Unidentified" and allocated a value according to their relative proportion <strong>of</strong> the total stomach<br />
content. <strong>The</strong> pile <strong>of</strong> small unidentified items was then mixed with a small quantity <strong>of</strong> water<br />
(approximately 4× volume <strong>of</strong> the pile) and agitated thoroughly to break up any compacted<br />
lump. <strong>The</strong> sample was then left to settle out and the excess water removed. <strong>The</strong> remaining<br />
solution was homogeneously mixed and a small quantity (approx. 0.1 ml) was poured onto a<br />
slide under a slip cover. <strong>The</strong> slide was marked into quarters to define 4 sub-samples. <strong>The</strong><br />
whole slide was then analysed under 40X to 400X magnification to identify the full range <strong>of</strong><br />
food items. Each sub-sample was analysed under 40X magnification and each item was<br />
allocated a number <strong>of</strong> points as described above. When the four sub-samples were quite<br />
variable, the process was repeated with a second slide to get a total <strong>of</strong> eight estimates. <strong>The</strong><br />
190
composition <strong>of</strong> the small unidentified pile was then converted in percentage composition <strong>of</strong><br />
each <strong>of</strong> its constituents and expressed as a percentage <strong>of</strong> the total stomach content. <strong>The</strong><br />
percentage composition was calculated for each item as its own points value divided by the<br />
combined total <strong>of</strong> points for all items combined, multiplied by 100. In order to avoid giving<br />
too much weight to stomachs with only very little content, for every month each diet item<br />
value was weighted by the total weight <strong>of</strong> the stomachs analysed for that given month (W.<br />
Darwall, pers. com.).<br />
Items which made up less than 2% <strong>of</strong> the diet each were lumped together and referred to as<br />
"others". Non identifiable materials were recorded as "No ID".<br />
Stable isotope analysis<br />
Fish samples for stable isotope analysis were collected by trawling during the January<br />
1999 cruise. About six specimens <strong>of</strong> each <strong>of</strong> the nine target species, three small and three<br />
large whenever possible, were collected. Only dorsal muscle tissue was analysed. <strong>The</strong><br />
potential food sources were collected during the April 1999 cruise. Benthic invertebrates and<br />
gastropods were sorted out from grab samples at 10, 30, 50, 75, 100 and 125 m depth.<br />
Sediment samples were taken from the upper layer <strong>of</strong> grab samples at every depth.<br />
Zooplankton and mayfly larvae were collected by 125 m vertical tows with a 50 µm mesh<br />
zooplankton net.<br />
Stable isotope analyses were carried out at the Environmental Isotope Laboratory at<br />
the University <strong>of</strong> Waterloo, Canada. Samples were run for Nitrogen and Carbon analysis on<br />
an Isochrome Continuous Flow Stable Isotope Mass Spectrometer (Micromass) coupled to a<br />
Carlo Erba Elemental Analyzer (CHNS-O EA1108). Results were corrected to Nitrogen<br />
standards IAEA-N1 and IAEA-N2 (both Ammonium Sulphate) and Carbon standards IAEA-<br />
CH6 (sugar), EIL-72 (cellulose) and EIL-32 (graphite). EIL-70b, a lipid extracted/ball-milled<br />
<strong>fish</strong> material, is <strong>of</strong>ten used as a monitoring standard – (‘EIL’ denotes Internal Standards with<br />
values calculated using International Standards). <strong>The</strong> error for clean ball-milled standard<br />
material is +/- 0.2‰ for Carbon and +/- 0.3‰ for Nitrogen. This error can be expected to<br />
increase depending on the homogeneity, type and amount <strong>of</strong> sample used in analysis. A truer<br />
representation <strong>of</strong> sample reproducibility can be gained through sample repeats. Standards are<br />
placed throughout each run at a range <strong>of</strong> weights to allow for an additional linearity<br />
correction, when necessary, due to machine fluctuations or samples <strong>of</strong> varying signal peak<br />
areas. Nitrogen and Carbon concentrations are calculated based on Carlo Erba Elemental<br />
Standards B2005, B2035 and B2036 with an error <strong>of</strong> +/- 1%.<br />
191
N=22<br />
Overall<br />
Chironomid larvae<br />
Chaoborus larvae<br />
Insect larvae<br />
Sand<br />
No ID<br />
Detritus<br />
Diatoms<br />
Others<br />
November-1998<br />
January-1999<br />
N=5<br />
N=2<br />
February-1999<br />
March-1999<br />
N=1<br />
N=3<br />
April-1999<br />
May-1999<br />
N=7<br />
N=4<br />
Figure D1. Overall and monthly diet composition (% wet weight) <strong>of</strong> Alticorpus macrocleithrum .<br />
See text for details on "Others" items.
Results and Discussion<br />
Stomach content analysis<br />
Alticorpus macrocleithrum<br />
A. macrocleithrum is a deep water species found between 75 and 125 m. As for most<br />
<strong>of</strong> the deep water species, stomachs were very <strong>of</strong>ten inverted during trawl hauling. Only 22<br />
specimens with remaining items in their stomachs were caught between November 1998 and<br />
May 1999. Weight <strong>of</strong> stomach contents averaged 31.2 mg and ranged from 6.4 to 96.8 mg for<br />
<strong>fish</strong>es <strong>of</strong> 103 to 137 mm SL (31-67 g). Diet composition (as percentage <strong>of</strong> the wet weight) at<br />
each sampled month and all months pooled are presented in Figure D1.<br />
As inferred from its anatomy by Stauffer & McKaye (1985), A. macrocleithrum appears to be<br />
a benthic invertebrate feeder. About 51% <strong>of</strong> the diet was not identifiable though, recorded<br />
either as detritus or "no id". <strong>The</strong> other 49% were constituted <strong>of</strong> chironomid larvae, Chaoborus<br />
larvae, insect larvae, diatoms, sand and other items (<strong>fish</strong> scales, adult insects, cladocerans,<br />
copepods, gastropods, oligochetes, macrophytes and other algae). <strong>The</strong> most important food<br />
items were chironomid larvae, present at every sampled date and lake fly (Chaoborus) larvae,<br />
though they were found only in March and May. Owing to its short gut and deep water<br />
existence, Stauffer & McKaye suggested A. macrocleithrum was not feeding on algae or<br />
phytoplankton. However, at every month except in February (0.3%), diatoms constituted<br />
between 1.4 and 10.5% <strong>of</strong> the diet. Diatoms might be ingested incidentally with sediment and<br />
sand while digging to catch the invertebrates. However, diatoms accounted for 10.5 <strong>of</strong> the diet<br />
in November, when only a small quantity <strong>of</strong> sand had been ingested (compared to February<br />
and April) and for 4.1% in March where almost no sand was ingested. Next the proportion <strong>of</strong><br />
diatoms ingested appeared too high to be incidental.<br />
Although the high proportion <strong>of</strong> detritus and unidentified materials at every month tended to<br />
screen the potential seasonal patterns, some food items occurred in the diet only at some<br />
months (ex. Chaoborus and insect larvae) suggesting A. macrocleithrum feeds<br />
opportunistically upon these items when available, either because they were the most<br />
abundant items at the moment or because they are preferred items.<br />
Alticorpus mentale<br />
A. mentale is also a deep water species mostly abundant between 75 and 125 m. As<br />
stomachs were almost always empty, every specimen from the whole catch was checked for<br />
intact stomach. Despite this effort, only 14 specimens had remaining items in their stomachs<br />
during the period from November 1998 to May 1999. Weight <strong>of</strong> stomachs contents averaged<br />
1374.8 mg and ranged from 10.2 to 6549.2 mg for <strong>fish</strong>es <strong>of</strong> 110 to 245 mm SL (25-279 g).<br />
Diet composition (as percentage <strong>of</strong> the wet weight) at each sampled month and all months<br />
pooled are presented in Figure D2.<br />
As expected from its morphology, A. mentale is a piscivore. At any sampled date except<br />
December when 47% <strong>of</strong> the stomach content was unidentifiable, more than 75% <strong>of</strong> its diet<br />
consisted <strong>of</strong> adult cichlid <strong>fish</strong>es, <strong>of</strong>ten Aulonocara minutus. Other items were cichlid fry,<br />
scales, eggs, chironomid larvae, Chaoborus larvae, insect pupae, crustacean zooplankton,<br />
nematodes, sand, macrophytes and other algae. A significant amount <strong>of</strong> diatoms was recorded<br />
only once from a single large specimen (245 mm SL) in December, in which they made up to<br />
19.7% <strong>of</strong> the stomach contents. No seasonal pattern was observed during the sampling period.<br />
An interesting observation, not apparent on the figures, was that <strong>of</strong> five relatively small<br />
192
Overall<br />
<strong>Cichlid</strong> adults<br />
N=14<br />
No ID<br />
Diatoms<br />
Others<br />
November-1998<br />
December-1998<br />
N=5<br />
N=1<br />
February-1999<br />
March-1999<br />
N=5<br />
N=2<br />
April-1999<br />
N=1<br />
Figure D2. Overall and monthly diet composition (% wet weight) <strong>of</strong> Alticorpus mentale .<br />
See text for details on "Others" items.
individuals measuring between 110 and 117 mm, four fed principally (61 to 84% <strong>of</strong> the diet)<br />
on zooplankton (mostly copepods), and the fifth one fed on <strong>fish</strong> (94%). This pattern was not<br />
represented in the figures because the stomach content <strong>of</strong> these four small specimens were too<br />
light to account for a significant part <strong>of</strong> the weighted monthly mean diet.<br />
Copadichromis virginalis<br />
C. virginalis mainly occurs at depths between 30 and 50 m in the north <strong>of</strong> the SWA.<br />
Inverted stomachs were not a problem and 30 specimens were analysed between November<br />
1998 and May 1999. Weight <strong>of</strong> stomachs contents averaged 68.7 mg and ranged from 18 to<br />
190 mg for <strong>fish</strong>es <strong>of</strong> 70 to 115 mm SL (8-37 g). Diet composition (as percentage <strong>of</strong> the wet<br />
weight) at each sampled month and all months pooled are presented in Figure D3.<br />
C. virginalis is known as a member <strong>of</strong> the zooplanktivorous utaka group (Iles 1971, Fryer &<br />
Iles 1972, Turner 1996). Indeed, more than 95% <strong>of</strong> the diet was made <strong>of</strong> zooplankton, mainly<br />
copepods. It was only in this species that significant amount <strong>of</strong> cladocerans were found. No<br />
seasonal pattern was observed, crustacean zooplankton constituting more than 95% <strong>of</strong> the diet<br />
at any sampled date except December 1998, when the "others" components <strong>of</strong> the diet<br />
accounted for 17%. Other items were <strong>fish</strong> scales, chironomid larvae, Chaoborus adults and<br />
larvae, insects adults and larvae, nematodes, macrophytes, other algae and detritus. No<br />
particular trend relative to size was observed.<br />
Diplotaxodon limnothrissa<br />
D. limnothrissa was found at depths from 50 to 125 m, but was mostly abundant<br />
between 75 and 100 m. Despite their deep water existence, stomachs were not always inverted<br />
after hauling and 31 specimens were analysed. Weight <strong>of</strong> stomachs contents averaged 66 mg<br />
and ranged from 8 to 272mg for <strong>fish</strong>es <strong>of</strong> 101 to 145 mm SL (20-48 g). Diet composition (as<br />
percentage <strong>of</strong> the wet weight) at each sampled month and all months pooled are presented in<br />
Figure D4.<br />
Turner (1994) described D. limnothrissa as a zooplankton feeder, with specimens above 12<br />
mm SL feeding mainly on copepods and small specimens <strong>of</strong> 3 mm feeding on chaoborid<br />
larvae and copepods. Allison et al. (1996) <strong>report</strong>ed a mixed diet composed <strong>of</strong> crustacean<br />
zooplankton, Chaoborus larvae, Engraulicypris sardella (usipa) larvae and occasionally<br />
phytoplankton. Our observations support the statement <strong>of</strong> a mixed diet: 71% <strong>of</strong> the diet was<br />
made <strong>of</strong> copepods, Chaoborus larvae, adult insects and usipa larvae. <strong>The</strong> remaining part <strong>of</strong><br />
the diet was composed <strong>of</strong> unidentified material, detritus and "others" items (cichlid fry, scales,<br />
<strong>fish</strong> eggs, chironomid larvae, cladocerans, bivalves, sand, diatoms and other algae). Unlike for<br />
A. mentale and C. virginalis, diet composition strongly varied among months, being either<br />
dominated by copepods in November 1998, April and May 1999, by usipa larvae in January<br />
1999 or Chaoborus larvae in March 1999. As for A. macrocleithrum, Chaoborus larvae were<br />
almost exclusively present in the diet in March and May 1999 (also some in February). D.<br />
limnothrissa appears to feed opportunistically on a few preferred food items depending upon<br />
their availability. No particular trend relative to size was observed in the narrow size range<br />
studied.<br />
193
Overall<br />
Copepods<br />
N=30<br />
Cladocerans<br />
Others<br />
November-1998<br />
December-1998<br />
N=4<br />
N=5<br />
January-1999<br />
February-1999<br />
N=5<br />
N=5<br />
Avril-1999<br />
May-1999<br />
N=6<br />
N=5<br />
Figure D3. Overall and monthly diet composition (% wet weight) <strong>of</strong> Copadichromis virginalis .<br />
See text for details on "Others" items.
Overall<br />
Copepod<br />
Chaoborus larvae<br />
No ID<br />
N=31<br />
Usipa larvae<br />
Insect adults<br />
Detritus<br />
Others<br />
November-1998<br />
January-1999<br />
N=4<br />
N=4<br />
February-1999<br />
March-1999<br />
N=3<br />
N=5<br />
April-1999<br />
May-1999<br />
N=5<br />
N=10<br />
Figure D4. Overall and monthly diet composition (% wet weight) <strong>of</strong> Diplotaxodon limnothrissa .<br />
See text for details on "Others" items.
Overall<br />
Copepods<br />
Chaoborus larvae<br />
Sand<br />
N=20<br />
Chironomid larvae<br />
No ID<br />
Detritus<br />
Others<br />
November-1998<br />
N=1<br />
December-1998<br />
N=4<br />
January-1999<br />
N=2<br />
February-1999<br />
N=1<br />
March-1999<br />
N=1<br />
April-1999<br />
N=6<br />
May-1999<br />
N=5<br />
Figure D5. Overall and monthly diet composition (% wet weight) <strong>of</strong> Diplotaxodon macrops .<br />
See text for details on "Others" items.
Diplotaxodon macrops<br />
D. macrops is a deep water species found from 75 to 125 m. Stomachs with remaining<br />
items were not as frequent as for D. limnothrissa and only 20 specimens were analysed<br />
between November 1998 and May 1999. Weight <strong>of</strong> stomachs contents averaged 61.2 mg and<br />
ranged from 5.4 to 157.4 mg for <strong>fish</strong>es <strong>of</strong> 85 to 118 mm SL (17-42 g). Diet composition (as<br />
percentage <strong>of</strong> the wet weight) at each sampled month and all months pooled are presented in<br />
Figure D5.<br />
Turner (1996) stated D. macrops was zooplanktivorous. Our results tend to support this<br />
statement as 55% <strong>of</strong> the diet was made <strong>of</strong> copepods and Chaoborus larvae. <strong>The</strong> remaining<br />
part <strong>of</strong> the diet was constituted <strong>of</strong> chironomid larvae, sand, detritus non identified material<br />
and other items (scales, adult insects, cladocerans, macrophytes, diatoms and other algae). It<br />
is important to notice that at months when more than only one or two specimens were<br />
examined, zooplankton accounted for 84 to 99% <strong>of</strong> the diet (December 1998, April and May<br />
1999). Chironomid larvae constituted a significant part <strong>of</strong> the diet only once in November<br />
1998, with a single <strong>fish</strong> examined. Chaoborus larvae were dominant items in February and<br />
May 1999. Like for D. limnothrissa, diet composition strongly varied among months for D.<br />
macrops, which seemed to switch opportunistically on some preferred items according to their<br />
relative availability. No particular trend relative to size was observed over the size range<br />
examined.<br />
Diet composition <strong>of</strong> D. macrops was globally similar to that <strong>of</strong> D. limnothrissa, copepods and<br />
Chaoborus larvae accounting for most <strong>of</strong> their diet. However, their feeding strategy appeared<br />
slightly different as benthic invertebrates and important amount <strong>of</strong> sand were regularly found<br />
in D. macrops diet, suggesting a digging activity not observed in D. limnothrissa.<br />
Lethrinops argenteus<br />
L. argenteus (='longipinnis orange head') mainly occurs at depth between 10 and 30<br />
m. <strong>The</strong> stomachs <strong>of</strong> 34 specimens were examined during the period from November 1998 to<br />
May 1999. Weight <strong>of</strong> stomachs contents averaged 54.2 mg and ranged from 6 to 197 mg for<br />
<strong>fish</strong>es <strong>of</strong> 92 to 142 mm SL (37-87 g). Diet composition (as percentage <strong>of</strong> the wet weight) at<br />
each sampled month and all months pooled are presented in Figure D6.<br />
Diet composition <strong>of</strong> L. argenteus was almost identical from one month to another, being<br />
essentially constituted <strong>of</strong> chironomid larvae (49 to 82%), sand, detritus, non identified<br />
material and other items (scales, <strong>fish</strong> eggs, insects adults, larvae and pupae, crustacean<br />
zooplankton, nematods, gastropods, bivalvs, macrophytes, diatoms and other algae). Given<br />
the nature <strong>of</strong> the main food item and the presence <strong>of</strong> large amounts <strong>of</strong> sand at each month, this<br />
species seems to be a benthic invertebrate feeder specialised on chironomid larvae.<br />
194
Overall<br />
Chironomid larvae<br />
Sand<br />
N=34<br />
No ID<br />
Detritus<br />
Others<br />
November-1998<br />
N=4<br />
December-1998<br />
N=4<br />
January-1999<br />
N=5<br />
February-1999<br />
N=5<br />
March-1999<br />
N=5<br />
April-1999<br />
N=6<br />
May-1999<br />
N=5<br />
Figure D6. Overall and monthly diet composition (% wet weight) <strong>of</strong> Lethrinops argenteus .<br />
See text for details on "Others" items.
Lethrinops gossei<br />
L. gossei is a deep water species mainly caught from 75 to 125 m depth. Despite is<br />
deep water existence, stomachs not inverted were found though they were seldom full. <strong>The</strong><br />
stomachs <strong>of</strong> 21 specimens were examined between November 1998 and May 1999. Weight <strong>of</strong><br />
stomachs contents averaged 72.7 mg and ranged from 5 to 210 mg for <strong>fish</strong>es <strong>of</strong> 101 to 155<br />
mm SL (33-118 g). Diet composition (as percentage <strong>of</strong> the wet weight) at each sampled<br />
month and all months pooled are presented in Figure D7.<br />
Turner (1996) stated this species fed on benthic arthropods. Our results rather indicated a<br />
mixed diet constituted <strong>of</strong> benthic invertebrates and zooplankton. Over the sampling period,<br />
dominant food items were Chaoborus larvae, chironomid larvae, diatoms and copepods,<br />
making up to 76% all together. <strong>The</strong> remaining part <strong>of</strong> the diet was made <strong>of</strong> unidentified<br />
material, detritus and other items (scales, insects adults, larvae and pupae, nematodes,<br />
macrophytes and other algae). Diet composition was highly variable from one month to<br />
another, being dominated by diatoms in December 1998 and January 1999, by chironomid<br />
larvae in April 1999 and by Chaoborus larvae in March and May 1999. Diatoms might appear<br />
to be ingested incidentally, but as only a very small amount <strong>of</strong> sand was found in the<br />
stomachs and given the large amounts <strong>of</strong> diatoms found, the hypothesis <strong>of</strong> accidental<br />
ingestion is unlikely. No particular trend relative to size was observed. L. gossei appeared to<br />
switch opportunistically on a few preferred food items according to their availability.<br />
Mylochromis anaphyrmus<br />
M. anaphyrmus frequents the shallow waters between 10 and 50 m depth. <strong>The</strong><br />
stomachs <strong>of</strong> 36 specimens were examined between November 1998 and May 1999. Weight <strong>of</strong><br />
stomachs contents averaged 45.6 mg and ranged from 8 to 290 mg for <strong>fish</strong>es <strong>of</strong> 84 to 151 mm<br />
SL (16-125 g). Diet composition (as percentage <strong>of</strong> the wet weight) at each sampled month and<br />
all months pooled are presented in Figure D8.<br />
This species is known as a gastropod feeder (McKaye et al. 1986, Eccles & Trewavas 1989,<br />
Konings 1995, Turner 1996, Msukwa & Ribbink 1997), although copepods, chironomids,<br />
algal remains and arthropod material are sometimes found (Turner 1996). Most <strong>of</strong> the<br />
specimens we examined had lots <strong>of</strong> snail remains in their guts. However, what is presented<br />
here is only the stomach content analysis. Gastropods made up to an averaged 16% (4-44%)<br />
<strong>of</strong> the stomach content only. Chironomid larvae accounted for 41%, adult insects for 10% and<br />
crustacean zooplankton for 5%. <strong>The</strong> remaining part <strong>of</strong> stomach content was made <strong>of</strong> sand,<br />
non identified material and other items (scales, chironomid pupae, Chaoborus larvae, insect<br />
pupae and larvae, nematodes, bivalves, macrophytes, diatoms and other algae). Dominant<br />
components <strong>of</strong> stomach contents were the same from one month to another, but the relative<br />
proportion <strong>of</strong> these items slightly varied among months. No particular trend relative to size<br />
was observed except that individuals below 100 mm SL tended to have higher proportions <strong>of</strong><br />
chironomid larvae in their stomachs; more than 99% for the two smallest specimens (80 and<br />
84 mm).<br />
195
Overall<br />
Chironomid larvae<br />
Chaoborus larvae<br />
Copepods<br />
N=21<br />
Non ID<br />
Detritus<br />
Diatoms<br />
Others<br />
December-1998<br />
January-1999<br />
N=5<br />
N=5<br />
March-1999<br />
April-1999<br />
N=5<br />
N=2<br />
May-1999<br />
N=4<br />
Figure D7. Overall and monthly diet composition (% wet weight) <strong>of</strong> Lethrinops gossei .<br />
See text for details on "Others" items.
Overall<br />
Chironomid larvae<br />
Insect adults<br />
Zoopk<br />
N=36<br />
Gastropods<br />
November-1998<br />
N=5<br />
December-1998<br />
N=5<br />
Sand<br />
No ID<br />
Others<br />
January-1999<br />
N=5<br />
February-1999<br />
N=5<br />
March-1999<br />
N=5<br />
April-1999<br />
N=5<br />
May-1999<br />
N=5<br />
Figure D8. Overall and monthly diet composition (% wet weight) <strong>of</strong> Mylochromis anaphyrmus .<br />
See text for details on "Others" items.
Overall<br />
Chironomid larvae<br />
Copepod<br />
N=13<br />
Sand<br />
Detritus<br />
Non ID<br />
Others<br />
January-1999<br />
February-1999<br />
N=5<br />
N=5<br />
April-1999<br />
May-1999<br />
N=2<br />
N=1<br />
Figure D9. Overall and monthly diet composition (% wet weight) <strong>of</strong> Taeniolethrinops praeorbitalis<br />
See text for details on "Others" items.
Taeniolethrinops praeorbitalis<br />
T. praeorbitalis is a shallow water species encountered from 10 to 30 m depth. <strong>The</strong><br />
stomachs <strong>of</strong> 13 specimens were examined between November 1998 and May 1999. Weight <strong>of</strong><br />
stomachs contents averaged 49.3 mg and ranged from 5 to 142 mg for <strong>fish</strong>es <strong>of</strong> 97 to 193 mm<br />
SL (24-166 g). Diet composition (as percentage <strong>of</strong> the wet weight) at each sampled month and<br />
all months pooled are presented in Figure D9.<br />
This species is known to feed primarily on chironomid larvae (Fryer 1959, Eccles &<br />
Trewavas 1989, Turner 1996). However, specimens examined by Fryer (1959) were<br />
sometimes full <strong>of</strong> nematodes. Jackson (cited by Turner 1996) <strong>report</strong>ed T. praeorbitalis fed<br />
mostly on Chaoborus larvae. Konings (1995) stated its main food is insect larvae. Detritus,<br />
diatoms and sand were also <strong>report</strong>ed to occur in its diet (Turner 1996). <strong>The</strong> 13 specimens we<br />
examined fed largely on chironomid larvae, which averaged 46% <strong>of</strong> the diet. Copepods<br />
accounted for 13%, though they had been abundant in one specimen only in May 1999. <strong>The</strong><br />
remaining components <strong>of</strong> the diet were large amounts <strong>of</strong> sand, detritus, non identified<br />
materials and other items (scales, insect adults and pupae, nematodes, macrophytes,<br />
cladocerans, diatoms and other algae). Apart from the one specimen with lots <strong>of</strong> copepods in<br />
May, no temporal variability in diet composition was noticed, the only variation being the<br />
relative proportions <strong>of</strong> chironomids and sand between months. <strong>The</strong> small specimens (90-130<br />
mm SL) analysed tended to have a smaller proportion <strong>of</strong> chironomid larvae in their stomachs<br />
and larger proportions <strong>of</strong> copepods and plant material than large individuals (165-195 mm).<br />
With the exception <strong>of</strong> a few species, which actually feed upon <strong>fish</strong> (A. mentale, D.<br />
limnothrissa…), the presence <strong>of</strong> <strong>fish</strong> scales in almost every stomach analysed, regardless <strong>of</strong><br />
species, probably represents an artefact caused by the piling up <strong>of</strong> <strong>fish</strong>es during the trawl<br />
hauling. Indeed, at every haul, medium and large <strong>fish</strong>, including non piscivorous species, had<br />
small <strong>fish</strong> stuck in their mouths.<br />
Stable isotopes analysis<br />
As already emphasised by Bootsma et al. (1996), the use <strong>of</strong> both δ 13 C and δ 15 N<br />
signatures is very useful in separating <strong>fish</strong> with identical δ 13 C signals but different feeding<br />
habits. Without the δ 15 N signatures, it would have been impossible to distinguish between<br />
species such as C. virginalis, small D. limnothrissa, L. gossei and large A. mentale for<br />
example, which all have very different feeding regimes: zooplankton feeders, benthic<br />
invertebrate feeder and piscivore.<br />
Except for M. anaphyrmus, there was significant intra-specific variability <strong>of</strong> both δ 13 C and<br />
δ 15 N for all species (Figure D10). This was particularly striking for A. mentale, which covered<br />
a δ 13 C range <strong>of</strong> 4°/ oo and about 2.5°/ oo in δ 15 N. For most <strong>of</strong> the species, this variability was<br />
mainly explained by size differences among individuals, as illustrated by the circles and<br />
written sizes on Figure D10. In general, smaller specimens had a lower δ 15 N signature than<br />
larger ones, indicating they were on a lower trophic level. Intra-specific variations <strong>of</strong> δ 13 C<br />
also showed small specimens fed on different items than large ones. As a consequence, small<br />
and large specimens <strong>of</strong> the species A. mentale, C. virginalis, D. limnothrissa and T.<br />
praeorbitalis, were subsequently separated in the analysis.<br />
<strong>The</strong> average isotopic composition <strong>of</strong> the nine target species and their potential food<br />
sources are presented on Figure D11. Owing to low sample size for most <strong>of</strong> the food sources,<br />
samples were analysed for δ 13 C only and few δ 15 N signatures are available. Adult mayfly<br />
196
-17,00<br />
5,00 6,00 7,00 8,00 9,00 10,00<br />
-18,00<br />
90-132 mm<br />
-19,00<br />
162-188 mm<br />
Amen<br />
-20,00<br />
Cvir<br />
Delta 13 C<br />
-21,00<br />
-22,00<br />
-23,00<br />
-24,00<br />
-25,00<br />
70-80 mm<br />
73-75 mm<br />
100-128 mm<br />
113mm<br />
94-103 mm<br />
140 mm<br />
190-200 mm<br />
Dmac<br />
Larg<br />
Tpra<br />
Amac<br />
Mana<br />
Dlim<br />
Lgos<br />
-26,00<br />
-27,00<br />
142 mm<br />
Delta 15 N<br />
Figure D10. Individual isotopic composition <strong>of</strong> some demersal cichlid <strong>fish</strong> species in South<br />
West Arm <strong>of</strong> <strong>Lake</strong> <strong>Malawi</strong>. Amac = Alticorpus macrocleithrum, Amen = Alticorpus<br />
mentale, Cvir = Copadichromis virginalis, Dlim = Diplotaxodon limnothrissa, Dmac =<br />
Diplotaxodon macrops, Larg = Lethrinops argenteus, Lgos = Lethrinops gossei, Mana =<br />
Mylochromis anaphyrmus, Tpra = Taeniolethrinops praeorbitalis. Numbers represent the<br />
standard length or standard length ranges <strong>of</strong> specimens.<br />
197
isotopic composition is not displayed on this figure because they can not be a significant food<br />
sources for these <strong>fish</strong> owing to their high mean δ 15 N signatures: 7.82. <strong>The</strong> nine <strong>fish</strong> species<br />
displayed a δ 15 N range <strong>of</strong> just over 3°/ oo , which corresponds approximately to one trophic<br />
level (3 to 5°/ oo Peterson & Fry 1987, Hesslein et al. 1991, Bootsma et al. 1996). For most <strong>of</strong><br />
the nine <strong>fish</strong> species, stable isotope results were consistent with stomach content analysis.<br />
A. macrocleithrum had the second highest δ 15 N signature (8.49), just below that <strong>of</strong> the<br />
piscivorous A. mentale. It was found to have a mixed diet composed mainly <strong>of</strong> benthic<br />
invertebrates, chaoborid larvae and unidentified material. Zooplankton and oligochaetes were<br />
also regularly found in its stomachs. <strong>The</strong> isotopic composition <strong>of</strong> this <strong>fish</strong> was consistent with<br />
these observations as it was intermediate between the lightest δ 13 C signatures (zooplankton<br />
Diaphanosoma excisum, Tropodiaptomus cunningtoni and Oligochaetes at 100 m) and the<br />
heavier Chaoborus larvae, average zooplankton and sediment between 75 and 125 m (Figure<br />
D11).<br />
<strong>The</strong> large specimens (190-200 mm SL) <strong>of</strong> A. mentale had the highest δ 15 N signature,<br />
as expected from its almost strictly piscivorous habits (Figure D11). <strong>The</strong> smaller specimens<br />
(113-142 mm) had a lighter δ 15 N and lighter δ 13 C composition. Stomach contents <strong>of</strong> all the<br />
small specimens analysed contained over 60% zooplankton, except for one individual who<br />
had fed on <strong>fish</strong> (95%). Carbon isotopic composition <strong>of</strong> small A. mentale matched these<br />
observations, being intermediate between the different zooplankton species.<br />
C. virginalis had amongst the lowest δ 15 N in muscle. Stomach content analysis<br />
revealed this species feeds almost exclusively on zooplankton, which was supported by its<br />
isotopic composition, right in the range <strong>of</strong> the different zooplankton species (Figure D11).<br />
<strong>The</strong> δ 15 N difference observed between small and large specimen is likely due to a selective<br />
predation upon different zooplankton species. Large specimens <strong>of</strong> C. virginalis probably feed<br />
more upon larger predatory zooplankton species than small ones.<br />
Large D. limnothrissa specimens (100-128 mm SL) had a higher average δ 15 N<br />
signature (7.71) than the small specimens (70-80 mm) (6.56), indicating they relied on food<br />
sources <strong>of</strong> a slightly higher trophic level (Figure D11). Temporal trends <strong>of</strong> stomach content<br />
analysis revealed a mixed diet composed <strong>of</strong> zooplankton, Chaoborus larvae, usipa and adult<br />
insects. This is supported by its δ 13 C signature, which is slightly above those <strong>of</strong> zooplankton<br />
species, Chaoborid larvae, mixed adult insects and below the signature <strong>of</strong> some insect species<br />
such as Eatonica shoutedini (Ephemeroptera). It must be stressed that the Coleoptera can not<br />
account for an important part <strong>of</strong> D. limnothrissa diet because their mean δ 15 N signature is<br />
only about 1°/ oo lighter.<br />
D. macrops mean δ 15 N signature (8.49) places this species on top <strong>of</strong> the represented<br />
trophic level with A. mentale and A. macrocleithrum (Figure D11). As for D. limnothrissa,<br />
stomach content analysis revealed a mixed diet in which crustacean zooplankton and<br />
Chaoborus larvae accounted for more than 50%. Its mean δ 13 C isotopic signature supported<br />
these results. It was about 2°/ oo above the main zooplankton and chaoborid larvae signatures,<br />
indicating that this species relies also on heavier 13 C sources. Adults insects such as<br />
Coleoptera, which indeed have heavier 13 C signals, were <strong>of</strong>ten found in stomachs.<br />
L. argenteus and T. praeorbitalis had almost exactly the same isotopic composition (Figure<br />
D11) and the heaviest δ 13 C signature after the small specimens <strong>of</strong> T. praeorbitalis.<br />
Monthly stomach analysis for both species showed very similar diet composition mainly<br />
made <strong>of</strong> chironomid larvae, sand, detritus and other items. However, L. argenteus and T.<br />
praeorbitalis δ 13 C signatures were heavier than expected if they were relying only upon<br />
chironomid larvae at 10, 30 and 50m (which is the depth distribution <strong>of</strong> these species in the<br />
sampled area, except for T. praeorbitalis only found at 10 and 30 m). As these species are<br />
198
-17<br />
5,50 6,50 7,50 8,50 9,50<br />
POTENTIAL FOOD SOURCES<br />
-18<br />
Chironomid adult and pupae 100m<br />
Tpra S<br />
-19<br />
Delta 13 C<br />
-20<br />
-21<br />
-22<br />
-23<br />
-24<br />
Larg<br />
Mana Tpra L<br />
Dlim L<br />
Dlim S<br />
Cvir L<br />
Cvir S<br />
Amen S<br />
Lgos<br />
Amac<br />
Dmac<br />
Amen L<br />
Eatonica shoutedini (Ephemeroptera)<br />
Coleoptera 100m, Sediment 10-30m<br />
Sediment 50m<br />
Chironomid adult 100m<br />
Gastropod 30m<br />
Chironomid larvae 30m<br />
Adult insects<br />
Nematode 30m, Chironomid larvae 30m,<br />
Oligochaete 30m, sediment 75-125m<br />
Chironomid larvae 50m, Phytoplankton<br />
Zooplankton, Chironomid larvae<br />
Chaoborus larvae, Chironomid adult 10m<br />
Oligochaete 100m<br />
-25<br />
Delta 15 N<br />
Diaphanosoma excisum,<br />
Tropodiaptomus cunningtoni<br />
Figure D11. Mean isotopic composition (± standard deviation) <strong>of</strong> some demersal cichlid <strong>fish</strong><br />
species and their potential food sources in South West Arm <strong>of</strong> <strong>Lake</strong> <strong>Malawi</strong>. Amac =<br />
Alticorpus macrocleithrum, Amen = Alticorpus mentale, Cvir = Copadichromis virginalis,<br />
Dlim = Diplotaxodon limnothrissa, Dmac = Diplotaxodon macrops, Larg = Lethrinops<br />
argenteus, Lgos = Lethrinops gossei, Mana = Mylochromis anaphyrmus, Tpra =<br />
Taeniolethrinops praeorbitalis. S and L refer to small and large specimens <strong>of</strong> a given<br />
species, respectively. <strong>The</strong> numbers correspond to the depth at which the samples were<br />
collected. Adult insects refer to the averaged δ 13 C values <strong>of</strong> Hemiptera, Ephemeroptera and<br />
Corixidae. Zooplankton refers to the averaged δ 13 C values <strong>of</strong> various crustacean copepod<br />
species (Diaptomus vraepelini, D. dimixtus, Mesocyclops neglectus, M. leukarti).<br />
199
ottom feeders ingesting large amounts <strong>of</strong> sand, they probably also have other food sources<br />
with heavier carbon signals like periphyton (Bootsma et al. 1996) or other plant material,<br />
which were indeed regularly found in stomachs.<br />
As observed in stomach content analysis, small specimens (90-130 mm SL) <strong>of</strong> T.<br />
praeorbitalis tended to have a different diet composition than large individuals (160-195<br />
mm), which was reflected in their isotopic composition. Small individuals had heavier δ 13 C<br />
and lighter δ 15 N signals. Stomach analysis revealed that apart from chironomid larvae,<br />
zooplankton and plant material were important components <strong>of</strong> their diet. However, as the<br />
zooplankton has a lighter 13 C signal than chironomid larvae found in shallow water, it can not<br />
account for the heavier 13 C signature <strong>of</strong> small T. praeorbitalis compared to large ones.<br />
Oligochaetes, which are difficult to identify in stomachs when digested, have been found to<br />
account for more than 50% <strong>of</strong> T. praeorbitalis diet (W. Darwall, pers. com.) and might have<br />
constituted an important part <strong>of</strong> the unidentified material in our analysis. Unfortunately, we<br />
did not get enough oligochaetes at 10 m, where all the T. praeorbitalis analysed for isotopic<br />
composition were caught, to analyse them for isotopic composition. Nevertheless, given the<br />
large difference in δ 13 C signal between oligochaetes at 100 m and 30 m (Figure D11),<br />
oligochaetes are likely to have a heavier 13 C signature in the shallow waters, but probably not<br />
heavy enough to actually account for a large part <strong>of</strong> T. praeorbitalis isotopic composition.<br />
<strong>The</strong> sand-digging habits <strong>of</strong> this species suggests that it may rely on vegetal materials<br />
(periphyton debris) with heavier 13 C signals found in sediment. <strong>The</strong> higher δ 13 C and lower<br />
δ 15 N suggest that small T. praeorbitalis may rely even more than adults on benthic algae, and<br />
may occupy a shallower habitat.<br />
<strong>The</strong> deep water L. gossei had an average δ 15 N signature among the highest (8.12)<br />
(Figure D11). Its diet composition as revealed by stomach contents varied much from one<br />
month to another, the main food items being Chaoborus larvae, chironomid larvae, diatoms,<br />
crustacean zooplankton and other less important items. Its δ 13 C signature, about 1°/ oo above<br />
that <strong>of</strong> Chaoborus larvae and zooplankton, might indicate that this species mainly relies on<br />
these food sources. However, as we do not have carbon signals <strong>of</strong> chironomid larvae in deep<br />
waters nor <strong>of</strong> diatoms, their potential importance in L. gossei diet can not be excluded.<br />
M. anaphyrmus is commonly referred to as a gastropod-eater and most <strong>of</strong> the<br />
specimens examined had lots <strong>of</strong> snail remains in their guts. However, gastropods represented<br />
only a small fraction (16%) <strong>of</strong> the stomach contents in which chironomid larvae accounted for<br />
41%, adult insect 10% and zooplankton 5%. Despite the weak occurrence <strong>of</strong> gastropods in<br />
stomach contents, M. anaphyrmus 13 C average signature (–20.17) was consistent with a diet<br />
mostly based on gastropods, for which the average signature at 30 m (most common depth <strong>of</strong><br />
the species in the sampled area) was –22.02 (Figure D11). Usually a food source is on average<br />
1°/ oo heavier in 13 C than its consumer. <strong>The</strong> 2% found here might be explained by a preference<br />
for particular gastropod species with slightly lighter signatures or by feeding partly at<br />
shallower depths, where gastropods can be expected to have heavier signals (Bootsma et al.<br />
1996).<br />
Conclusions<br />
Despite the high variability <strong>of</strong> stomach fullness encountered during this study,<br />
particularly for the deep water species, a good correspondence between the results <strong>of</strong> stomach<br />
content and stable isotope analysis was observed for most <strong>of</strong> the nine <strong>fish</strong> species. Stable<br />
isotope results proved very useful in clarifying the observed patterns. Species with the<br />
narrower feeding regime such as A. mentale or C. virginalis had an isotopic composition<br />
exactly matching the stomach content observations. For M. anaphyrmus, despite the<br />
200
dominance <strong>of</strong> other food items in the stomachs at every sampled months, the isotopic<br />
composition confirmed the previously <strong>report</strong>ed snail diet <strong>of</strong> the species (McKaye et al. 1986,<br />
Eccles & Trewavas 1989, Konings 1995, Turner 1996, Msukwa & Ribbink 1997). Stomach<br />
content analysis indicated regular temporal trends <strong>of</strong> diet composition for both L. argenteus<br />
and T. praeorbitalis, mainly dominated by chironomid larvae. However, stable isotope<br />
analysis revealed that the apparently secondary vegetal food items were playing an important<br />
role in the diet <strong>of</strong> these species, particularly for the small specimens <strong>of</strong> T. praeorbitalis.<br />
Isotopic composition clearly illustrated the diet separation among these demersal <strong>fish</strong>: on one<br />
hand there is the pelagic phytoplankton food chain, centered on –23°/ oo with at least two<br />
trophic levels and intermediate feeding levels and on the other hand there is an ascending line<br />
towards heavier carbon source, which is most likely a periphyton-based food web represented<br />
by T. praeorbitalis. <strong>The</strong> ascending line to heavier carbon and lighter nitrogen likely represents<br />
mixed feeding on the periphyton-based source and the phytoplankton-based source, though<br />
there was no piscivore specialising on T. praeorbitalis in our collection. This is interesting in<br />
that it does indicate that benthic algal production is contributing to energy flow <strong>of</strong> the<br />
demersal <strong>fish</strong>es even well away from shore.<br />
Species with a complex feeding regime such as A. macrocleithrum, D. limnothrissa,<br />
D. macrops and L. gossei showed important temporal variations in diet composition. <strong>The</strong>se<br />
variations, which at first look appeared to be <strong>of</strong> opportunistic nature, are likely to be<br />
influenced by seasonal trends in food availability. Indeed, these four species fed upon<br />
Chaoborus larvae when available. For each <strong>of</strong> these species, Chaoborus larvae were dominant<br />
items in their stomachs at exactly the same months, March and May, and only at these<br />
months. This strongly suggests that the observed opportunistic feeding regimes were related<br />
to the seasonal and/or temporal fluctuations <strong>of</strong> their preferred food sources availability.<br />
<strong>The</strong>se results emphasise the complementary nature <strong>of</strong> stomach content and stable<br />
isotope approaches in the study <strong>of</strong> feeding habits and trophic patterns <strong>of</strong> complex <strong>fish</strong><br />
communities. <strong>The</strong>re appears to be a heavy reliance by most demersal <strong>fish</strong> on benthic<br />
organisms as a food source and little complete dietary overlap, supporting the belief that these<br />
<strong>fish</strong> must partition their resources in order to coexist (Bootsma et al. 1996, Turner 1996). If<br />
the habitat was to become more homogeneous (as a result <strong>of</strong> increased sedimentation, reduced<br />
water clarity, etc.), it can be expected that benthic organisms will be affected and that the<br />
potential for competitive exclusion will increase.<br />
201
Chapter 5:<br />
Morphometric, genetic and ecological<br />
comparison <strong>of</strong> two important<br />
demersal species along a gradient<br />
from the South West Arm to Nkhata<br />
Bay
Chapter 5: Morphometric, genetic and ecological comparison <strong>of</strong><br />
two important demersal species along a gradient from the South<br />
West Arm to Nkhata Bay<br />
F. Duponchelle, J. Snoeks, M. Hanssens, J-F. Agnèse, A.J. Ribbink, A. Msukwa, J. Mafuka &<br />
D. Mandere<br />
Introduction<br />
<strong>The</strong> state <strong>of</strong> the demersal trawling <strong>fish</strong>eries in <strong>Lake</strong> <strong>Malawi</strong> has been monitored since<br />
the development <strong>of</strong> this industry in 1968 (Tweddle & Magasa 1989). Various authors have<br />
<strong>report</strong>ed the consequences <strong>of</strong> trawling activities on <strong>fish</strong> communities, such as the pr<strong>of</strong>ound<br />
size structure modifications, the decreased occurrence <strong>of</strong> some species and the disappearance<br />
<strong>of</strong> some others in the SEA, and drew the attention to the associated dangers for biodiversity<br />
conservation (Turner 1977a, 1977b, Turner 1995, Turner et al. 1995). However, demersal<br />
trawling only occurs in a restricted area in the southern part <strong>of</strong> the lake, representing less than<br />
five percent <strong>of</strong> its total surface. A recent <strong>report</strong> from the Fisheries Department revealed that<br />
most <strong>of</strong> the exploited species in the SE and SW Arms also occur in the non exploited trawling<br />
grounds between Dormira Bay and Nkhata Bay (Banda & Tómasson 1996, Tómasson &<br />
Banda 1996). When considering both <strong>fish</strong>eries management and biodiversity conservation<br />
issues, a logical question arises: are the species that have disappeared from the catches in the<br />
SEA really endangered if they also occur in other areas <strong>of</strong> the <strong>Lake</strong>? Although some <strong>of</strong> these<br />
species are supposed to occur only in restricted parts <strong>of</strong> the lake (Turner 1996), their degree <strong>of</strong><br />
stenotopy is unknown and a decreasing stock might be repopulated from other geographical<br />
areas. However, a single species present in geographically distant parts <strong>of</strong> the lake might be<br />
composed <strong>of</strong> a single widespread population, or <strong>of</strong> different populations (or "stocks" in<br />
<strong>fish</strong>eries language). For the conservation <strong>of</strong> biodiversity as well as for the <strong>fish</strong>eries<br />
management, it appears crucial to know whether a species is represented by a single<br />
population distributed all over the lake, or by different populations with distinctive<br />
morphometric, genetic and life-history characteristics. If the threatened species <strong>of</strong> the<br />
southern arms were to be composed <strong>of</strong> a single widespread population, their disappearance<br />
from the exploited trawling areas would not represent an irreversible threat for the<br />
biodiversity. On the other hand, if they were distinct populations with different morphometric,<br />
genetic and life-history characteristics, their disappearance would lead to an irreversible loss<br />
<strong>of</strong> biodiversity. <strong>The</strong> starting hypothesis for this study is that shallow-water species have more<br />
chances to encounter physical barriers to their movements and therefore are more likely to be<br />
structured in distinct populations than deep-water species. A study was undertaken in<br />
collaboration with the taxonomists <strong>of</strong> the project, to compare the morphometrics, the genetics<br />
and some life-history traits <strong>of</strong> two species (a shallow-water and a deep-water species) from<br />
four different locations between the SWA and Nkhata Bay (Figure P1). This would allow us<br />
to assess whether they are part <strong>of</strong> a single widespread population or <strong>of</strong> distinct populations<br />
and consequently whether eventual differences are related to geographical distance and depth.<br />
202
Tanzania<br />
Chintheche<br />
<strong>Malawi</strong><br />
Mozambique<br />
Nkhotakota<br />
Kirambi Point<br />
Domira Bay<br />
Leopard Bay<br />
SWA<br />
SEA<br />
Figure P1. Map <strong>of</strong> <strong>Lake</strong> <strong>Malawi</strong> showing the sampling sites for Mylochromis anaphyrmus<br />
(white squares) and Lethrinops gossei (black squares) populations comparison.<br />
203
Material and Methods<br />
<strong>The</strong> shallow-water species, Mylochromis anaphyrmus, was sampled in the north <strong>of</strong> the<br />
SWA (where the monthly survey was done), Dormira Bay, Nkhotakota and Chinteche in<br />
February 1999. M. anaphyrmus was chosen for this study as a representative <strong>of</strong> the shallow<br />
water demersal community. It was one <strong>of</strong> the target species for the life-history studies within<br />
the project. Reasons for this choice are the fact that this species is relatively easily to identify,<br />
and common within its distribution range. Eccles & Trewavas (1989) <strong>report</strong>ed that M.<br />
anaphyrmus is very common over sandy substrates, in waters <strong>of</strong> 15 to 35 meters depth in the<br />
southern part <strong>of</strong> the lake. <strong>The</strong>y added that it was also <strong>report</strong>ed from Nkhotakota. Konings<br />
(1995) stated that M. anaphyrmus is endemic to the southern and western parts <strong>of</strong> the lake.<br />
Turner (1996) <strong>report</strong>ed that this species was present in 42 out <strong>of</strong> 57 experimental trawl<br />
catches between 18 and 72 m depth in the South-East Arm where it is <strong>of</strong>ten one <strong>of</strong> the most<br />
abundant species. Banda & Tómasson (1996) <strong>report</strong>ed it in the SW and SE Arms as well as<br />
from Domira Bay to Nkhata Bay.<br />
<strong>The</strong> deep-water species, Lethrinops gossei was chosen for the same reasons. It is an abundant<br />
species in deep water and was one <strong>of</strong> the target species for life-history studies within the<br />
project.. Eccles & Trewavas (1989) <strong>report</strong>ed that it dominates the benthic community at<br />
depths <strong>of</strong> 92-130 m in the SEA. Turner (1996) stated it was one <strong>of</strong> the dominant species at<br />
depths <strong>of</strong> 90 m or more in the SEA. He also <strong>report</strong>ed what appeared to be a female L. gossei<br />
caught <strong>of</strong>f Karonga, in the far north <strong>of</strong> the lake. Banda & Tómasson (1996) <strong>report</strong>ed it in the<br />
SW and SE Arms as well as from Domira Bay to Nkhata Bay. It was sampled during the same<br />
February 1999 cruise in the north <strong>of</strong> the SWA, where the monthly survey was done, <strong>of</strong>f<br />
Leopard Bay, <strong>of</strong>f Kiramby Point, in Nkhotakota and Chinteche (Figure P1).<br />
It was planned that at each location, 30 specimens <strong>of</strong> each species were to be collected for<br />
morphometric analyses, 75 to 100 specimens for genetics and 100 to 200 specimens for life<br />
history traits analysis. L. gossei proved to be rare in Chinteche area between Bandawe Point<br />
and Sanga Point so that only 35 specimens were caught as a whole.<br />
Morphometric analysis<br />
At the time we were writing this <strong>report</strong>, the morphometric analysis <strong>of</strong> L. gossei was<br />
not yet finished so that only the analysis for M. anaphyrmus will be presented here.<br />
Ideally, for each locality 15 specimens <strong>of</strong> each sex, all <strong>of</strong> similar size, should have been<br />
preserved. For some localities this could not be done. Hence, the results and analyses are<br />
based on a lower number <strong>of</strong> specimens. No female specimens were preserved from<br />
Nkhotakota. On all specimens 23 measurements and 17 counts were taken following Snoeks<br />
(1994). Two techniques were used to explore and analyse the metric data: Principal<br />
Component Analysis (PCA) on the log-transformed measurements and Mann-Whitney U-<br />
Tests on the relative measurements (percentages).<br />
List <strong>of</strong> abbreviations used:<br />
LacD : lachrymal depth ; SnL : snout length ; LJL : lower jaw length ; ChD : cheek depth ;<br />
EyeD : eye diameter ; IOW : interorbital width ; HW : head width ; HL : head length ; SL :<br />
standard length ; BD : body depth ; DFB : dorsal fin base ; AFB : anal fin base ; PrD :<br />
predorsal distance ; PrP : prepectoral distance ; PrV : preventral distance ; PrA : preanal<br />
distance ; CPL caudal peduncle length ; CPD caudal peduncle depth ; PhJL : pharyngeal jaw<br />
length ; PhJW : pharyngeal jaw width ; DeArL ; dentigerous area length (pharyngeal jaw) ;<br />
DeArW : dentigerous area width ; UJT : number <strong>of</strong> outer teeth in the upper oral jaw ; LJT :<br />
number <strong>of</strong> outer teeth in the lower oral jaw.<br />
204
Genetic analysis<br />
Microsatellites variability for the two species has been investigated using primers already<br />
defined by Rico et al. (1993,1996) and Zardoya et al. (1996). <strong>The</strong>se primers have been<br />
already tested across a panel <strong>of</strong> very diverse <strong>fish</strong> species and successfully amplified in nonsource<br />
species due to a high level <strong>of</strong> conservation <strong>of</strong> the flanking regions <strong>of</strong> these<br />
microsatellites. Eight different loci have been tried (Table P1). Numerous amplification<br />
conditions were used for each pair <strong>of</strong> primers with variations in the concentration <strong>of</strong> MgCl2<br />
and <strong>of</strong> the annealing temperature.<br />
For locus GMO 2 we always observed two bands <strong>of</strong> respectively 250 and 290 bp in both<br />
species. Locus GMO 132 gave also two bands <strong>of</strong> 50 and 300 bp. At loci GMO 145 and CIER<br />
51, we did not obtain any band. A 310 bp band was observed for M. anaphyrmus at locus<br />
CIER 62 and a 250 bp band for both species at locus TMO M25.<br />
Only locus TMO M5 and TMO M 27 gave, for both species, bands varying in size<br />
from 300 to 400 bp for TMO M5 and from 230 to 250 bp for TMO M27.<br />
PCR conditions were as follows: DNA was amplified (94°C 60 s, 48°C 60s, 72°C 60s) for 35<br />
cycles in 20 µl volumes (1 x polymerase buffer, 1.5 mM MgCl2, 0.4 mM <strong>of</strong> each dNTP, 75<br />
ng <strong>of</strong> each primer, and 1 unit <strong>of</strong> Taq Promega).<br />
<strong>The</strong> genetic population structure has been statistically described using Wright (1969) “F<br />
statistics” indices with Weir & Cokerham (1984) formulas. Fis measure the deficit <strong>of</strong><br />
heterozygous due to non-random mating in a (sub)population while Fst measure the loss <strong>of</strong><br />
heterozygosity due to the subdivision <strong>of</strong> the sample in two or more populations.<br />
Isolation by distance was tested using Mantel's test (Mantel 1967). Mantel's test consists <strong>of</strong> a<br />
comparison <strong>of</strong> two matrices (here Fst versus geographical distances). This test determines if<br />
there is a correlation between the two matrices. <strong>The</strong> Mantel coefficient Z is calculated from<br />
the real data and then the data are permuted to obtain pseudo matrices and the corresponding<br />
pseudo Z’ values. <strong>The</strong> various Z’ values obtained are compared to the Z values. If Z is<br />
statistically different <strong>of</strong> all Z’, then the two matrices are correlated.<br />
All coefficient and statistical analysis have been done using GENETIX programme (Belkir et<br />
al. 1996)<br />
Life history traits analysis<br />
For both species, length-weight relationships, percentage <strong>of</strong> ripe females, and fecundity<br />
were compared between populations. As it needs to be estimated during the peak <strong>of</strong> the<br />
breeding season, which may vary at each site, size at maturity was not compared between<br />
populations. Determination <strong>of</strong> life history traits was done as described in Chapter 2.<br />
Comparison <strong>of</strong> the percentage <strong>of</strong> ripe females between populations was carried out using a<br />
Kruskal-Wallis one way ANOVA on ranks (Sherrer 1984).<br />
As for most <strong>of</strong> the <strong>fish</strong> species, length-weight relationship among populations <strong>of</strong> the two<br />
species were characterised by the following equation: W = a.L b . Direct comparison <strong>of</strong><br />
populations using the maximum likelihood method (Tomassone et al. 1993) was not possible<br />
because regression residuals increased with length. Length and weights were then<br />
logarithmically transformed (ln), which lead to a linear relationship between length and<br />
weight. <strong>The</strong>refore, estimation <strong>of</strong> differences between populations was investigated by<br />
comparing regression lines between length and weight. <strong>The</strong> regressions were compared by an<br />
analysis <strong>of</strong> covariance (Scherrer 1984) followed by a 2 × 2 comparison method. First, slopes<br />
were compared, and populations whose slopes were not significantly different were then<br />
205
compared for intercepts. As the type I error increases when more than two populations are<br />
compared pairwise (Scherrer 1984), a probability α' was calculated so that the overall α (α =<br />
0.05 in our case) was maintained over the k(k-1)/2 comparisons. <strong>The</strong> new α' was calculated<br />
by the following formula: α' = 1-(1-α) 2/(k(k-1)) .<br />
Rather than comparing regressions between fecundity and body weight over a narrow weight<br />
range, we compared relative fecundity (fecundity per kg <strong>of</strong> body weight). Over the weight<br />
ranges studied, no correlation was found between relative fecundity and body weight, as it<br />
may happen in cichlids (Legendre 1992). Relative fecundity was compared using one way<br />
ANOVA followed by Tukey's all pairwise multiple comparison test (Scherrer 1984).<br />
Table P1. Microsatellites loci and primers tested.<br />
Locus Primers references<br />
GMO 2 F ccctcagattcaaatgaagga Rico et al., 1993<br />
R gtgtgagatgactgtgtcg Rico et al., 1996<br />
GMO 132<br />
F ggaacccattggattcaggc<br />
R cgaaaggacgagccaataac<br />
GMO 145<br />
F gcattgtaggaacaacaattaac<br />
R gtgcatgtgctcattatagc<br />
CIER 51<br />
F gccaaaacactgacgaggtga<br />
R tttgcgcaagcttcaggatga<br />
CIER 62<br />
F ggtgctgtcacttttggccac<br />
R aactctgctggtcgccactcc<br />
TMO M5 F gctcaatattctcagctgacgca Zardoya et al., 1996<br />
R aga aca gcg ctg gct atg aaa agg t<br />
TMO M25<br />
F ctgcagtggcacatcaagaatgagcagcggt<br />
R caagaacctttcaagtcattttg<br />
TMO M27<br />
F aggcaggcaattaccttgatgtt<br />
R tactaactctgaaagaacctgtgat<br />
206
Results and Discussion<br />
Morphometric analysis<br />
Principal Component Analysis.<br />
PCA log measurements<br />
2<br />
1<br />
PC 3 : EyeD, ChD, BD<br />
0<br />
-1<br />
-2<br />
-2,5 -1,5 -0,5 0,5 1,5 2,5<br />
PC 2 : CPD, DFB, DeArL, PhJL, AFB, PhJW<br />
m SWA<br />
f SWA<br />
m CHIN<br />
f CHIN<br />
m DOMB<br />
f DOMB<br />
m KOTA<br />
Figure P2. PCA <strong>of</strong> the log-transformed measurements, all specimens included (n=60).<br />
A first PCA (Figure P2) on all specimens showed that morphological differences<br />
between males and females are generally larger than the differences observed between the<br />
populations. Male and female specimens are partly separated on PC2; female specimens are<br />
shifted towards the positive, male specimens towards the negative side <strong>of</strong> PC2. Polygons are<br />
drawn for the males only. All further analyses were therefore based on either males or females<br />
alone.<br />
In this plot SWA and CHIN males are relatively well separated on PC3 from the KOTA<br />
males. <strong>The</strong> DOMB males overlap with all other populations on PC3. This result is surprising<br />
since the South West Arm and Chinteche are the most distant localities sampled and we<br />
would have expected differences to be most prominent between these two populations. <strong>The</strong><br />
third component is mainly defined by eye diameter and cheek depth (both measurements are<br />
obviously strongly correlated). This surprising result is probably due to the fact that all<br />
specimens were included in this analysis. <strong>The</strong> larger morphological differences that are found<br />
between sexes are mixed and analysed together with the inter population morphological<br />
differences and may therefore ‘blur’ the latter ones. <strong>The</strong>refore another PCA was done,<br />
207
including only male specimens (Figure P3). <strong>The</strong> plot <strong>of</strong> the specimens on the second and third<br />
principal component shows a large overlap between almost all populations. Some distinction<br />
appears between the SWA and KOTA males on PC2. <strong>The</strong> SWA males are mainly on the<br />
positive part <strong>of</strong> PC2, the KOTA males are shifted towards the negative part <strong>of</strong> PC2.<br />
2<br />
PCA log measurements ; males<br />
1<br />
PC 3 : CPL, CPD<br />
0<br />
-1<br />
-2<br />
-3<br />
-2,0 -1,5 -1,0 -0,5 0,0 0,5 1,0 1,5 2,0 2,5<br />
SWA<br />
CHIN<br />
DOMB<br />
KOTA<br />
PC 2 : AFB, PrA, ChD<br />
Figure P3. PCA <strong>of</strong> the log-transformed measurements, male specimens (n=37).<br />
<strong>The</strong> factor loadings from this analysis indicated that the third component was almost entirely<br />
defined by a single character, the caudal peduncle length. After verification <strong>of</strong> the<br />
measurements, it appeared that one <strong>of</strong> the males collected in Chinteche was aberrant for this<br />
character. However, the measurement was checked and found to be correct. Consequently, the<br />
third principal component is unreliable to distinguish the populations (Figure P3).<br />
We therefore added another plot using the second and fourth principal component<br />
(Figure P4). On PC4, the CHIN males are relatively well separated from the males <strong>of</strong> the<br />
other populations. One CHIN specimen was aberrant and scored high on PC4 (Figure P4:<br />
specimen marked with arrow). This was again the same aberrant male with the high CPL<br />
value.<br />
208
2<br />
PCA log measurements ; males<br />
1<br />
PC 4 : ChD, CPD, DeArL<br />
0<br />
-1<br />
-2<br />
-3<br />
-2,0 -1,5 -1,0 -0,5 0,0 0,5 1,0 1,5 2,0 2,5<br />
PC 2 : AFB, PrA, ChD<br />
SWA<br />
CHIN<br />
DOMB<br />
KOTA<br />
Figure P4. PCA <strong>of</strong> the log-transformed measurements, male specimens (n=37).<br />
2,5<br />
PCA log measurements ; females<br />
2,0<br />
PC 3 : EyeD, BD, ChD, DeArL, PhJL<br />
1,5<br />
1,0<br />
0,5<br />
0,0<br />
-0,5<br />
-1,0<br />
-1,5<br />
-2,0<br />
-2,5 -1,5 -0,5 0,5 1,5 2,5<br />
PC 2 : EyeD, DeArW, CPL, PhJW<br />
SWA<br />
CHIN<br />
DOMB<br />
Figure P5. PCA <strong>of</strong> the log-transformed measurements, female specimens (n=23).<br />
A PCA on the log-transformed measurements for the female specimens was done as<br />
well (Figure P5). Here we see that the SWA population is morphologically more diverse than<br />
209
the other two (there are obviously more observations from the SWA which explains part <strong>of</strong><br />
the higher variability) and overlaps with both other populations. On PC3 the CHIN females<br />
are neatly separated from the DOMB females. Factor loadings on PC3 indicate that they<br />
mainly differ in eye diameter and body depth.<br />
Further PC analyses were made to compare all populations two-by-two. <strong>The</strong>se<br />
analyses did not show clear or better results than the previous PC analyses. Large overlaps<br />
were observed for almost all PCA analyses when only two populations were included.<br />
Mann-Whitney U-Test.<br />
<strong>The</strong> Mann-Whitney U-test was used to analyse morphological differences between all<br />
populations. Data used for these analyses are the relative measurements (percentages).<br />
We used only specimens <strong>of</strong> the same sex for these tests. To avoid allometric inferences,<br />
specimens were selected on the basis <strong>of</strong> their standard length for each test between two<br />
populations, so that the p-value for the standard length was close to 0.5 or larger. So, for each<br />
test a different subset <strong>of</strong> specimens was used, and in most cases not all specimens from a<br />
given locality were included in the analyses. A first test was done including male specimens<br />
from all populations.<br />
Table P2 gives an overview <strong>of</strong> the results <strong>of</strong> the analysis between all four populations.<br />
Table P2. Comparison <strong>of</strong> all four populations using the Mann-Whitney U-Test. Above<br />
diagonal the number <strong>of</strong> characters for which significant differences were found, p<br />
values as follows : * indicates p < 0,05; ** p < 0.005; *** p < 0.0005. Below diagonal p<br />
value for SL and number <strong>of</strong> specimens from each population used for the comparison.<br />
Characters for which significant differences were found are given and discussed in the<br />
text.<br />
SWA DOMB KOTA CHIN<br />
SWA 2 * 3 *<br />
1 **<br />
4 *<br />
3 **<br />
DOMB<br />
KOTA<br />
CHIN<br />
p=0.52 for SL<br />
n SWA 19<br />
n DOMB 10<br />
p=0.86 for SL<br />
n SWA 9<br />
n KOTA 9<br />
p=0.46 for SL<br />
n SWA 18<br />
n CHIN 16<br />
p=0.56 for SL<br />
n DOMB 8<br />
n KOTA 9<br />
p=0.93<br />
n DOMB 6<br />
n CHIN 12<br />
1 *<br />
1 **<br />
p=0.52<br />
n KOTA 10<br />
n CHIN 14<br />
3 *<br />
1 **<br />
1 **<br />
1 ***<br />
<strong>The</strong> number <strong>of</strong> characters that differ between populations increases with increasing distance<br />
between the populations. In addition, the morphological differences found between<br />
populations become more significant with increasing distance.<br />
210
<strong>The</strong> characters that were found to be significantly different between the four populations are:<br />
SWA-DOMB.<br />
SWA-KOTA.<br />
SWA-CHIN.<br />
DOMB-KOTA.<br />
DOMB-CHIN.<br />
KOTA-CHIN.<br />
* : EyeD/HL and DeArW/PhJW<br />
* : HL/SL, PrD/SL and DeArW/PhJW<br />
** : PhJL/HL.<br />
* : LacD/HL, SnL/HL, LJL/HL and CPD/SL<br />
** : HL/SL, PrD/SL and PhJL/HL<br />
* : EyeD/HL<br />
** : DeArW/PhJW<br />
* : LJL/HL, ChD/HL, IOW/HL and DeArW/PhJW<br />
** : LacD/HL<br />
*** : ChD/HL<br />
<strong>The</strong> table and short overview show that all populations differ from each other for at least two<br />
characters. Some populations differ in a particular character from all or most other<br />
populations. For the dentigerous area width <strong>of</strong> the pharyngeal jaw the SWA population is<br />
significantly different from the DOMB and KOTA populations but not from the CHIN<br />
population. Moreover, for this character the DOMB population differs from all other<br />
populations. For the eye diameter a significant difference was observed between the DOMB<br />
population and the SWA and KOTA, but again not when compared to the CHIN population.<br />
<strong>The</strong> CHIN population is furthermore significantly different from the SWA and KOTA<br />
populations but not from the DOMB Population for the lachrymal depth. No consistent<br />
differences were found between the Nkhotakota population and the three other populations.<br />
Differences between females from three populations were analysed as well.<br />
Unfortunately three out <strong>of</strong> four female specimens from the DOMB population were<br />
significantly larger than the females from the SWA and CHIN populations. So, no comparison<br />
between DOMB and the two other could be made. As a result, only the SWA and CHIN<br />
populations could be compared. Seven SWA and five CHIN female specimens were used in<br />
the analysis, the p value for SL was 0.68. We found only two significant differences (p0.005) for the ChD/HL and DeArL/PhJL.<br />
Meristics<br />
For only three characters (the number <strong>of</strong> outer teeth in the oral jaws and the number <strong>of</strong><br />
dorsal fin spines) significant differences were found between the populations.<br />
Plots <strong>of</strong> the number <strong>of</strong> outer teeth in the upper and lower oral jaws are given. Specimens are<br />
categorised by locality and sex. Polygons are only given for male specimens (Figures P6 and<br />
P7).<br />
Both graphs show that female specimens cannot be reliably distinguished on the basis <strong>of</strong> this<br />
character. <strong>The</strong> SWA females overlap with all other populations for the number <strong>of</strong> outer teeth<br />
both in upper and lower jaws. <strong>The</strong> only difference was noted for the outer teeth in the upper<br />
jaw, the female DOMB specimens have a higher number than the female CHIN specimens<br />
(52-58 vs 43-52).<br />
211
64<br />
number <strong>of</strong> outer teeth in the upper oral jaw<br />
60<br />
56<br />
52<br />
48<br />
44<br />
40<br />
36<br />
110 115 120 125 130 135 140 145 150<br />
SL<br />
m SWA<br />
f SWA<br />
m CHIN<br />
f CHIN<br />
m DOMB<br />
f DOMB<br />
m KOTA<br />
Figure P6. Plot <strong>of</strong> the number <strong>of</strong> outer teeth in the upper oral jaw vs SL, male specimens<br />
marked with polygons (n=60).<br />
48<br />
number <strong>of</strong> outer teeth in the lower oral jaw<br />
44<br />
40<br />
36<br />
32<br />
28<br />
24<br />
110 115 120 125 130 135 140 145 150<br />
SL<br />
m SWA<br />
f SWA<br />
m CHIN<br />
f CHIN<br />
m DOMB<br />
f DOMB<br />
m KOTA<br />
Figure P7. Plot <strong>of</strong> the number <strong>of</strong> outer teeth in the lower oral jaw vs SL, male specimens<br />
marked with polygons (n=60).<br />
212
For the male specimens, the differences on teeth number are clearer. <strong>The</strong> SWA males are<br />
clearly different from the KOTA males, in having a lower number <strong>of</strong> outer teeth (42-50 vs 50-<br />
62 UJT and 28-40 vs 36-42 LJT respectively). For the outer teeth number in the upper oral<br />
jaw, the range <strong>of</strong> both other populations (DOMB and CHIN) is intermediate. For the outer<br />
teeth number in the lower jaw, the DOMB population has a relatively large range that<br />
overlaps completely with the KOTA population and is different from the SWA population.<br />
<strong>The</strong> CHIN males have the largest range and overlap with all other populations.<br />
12<br />
10<br />
male<br />
8<br />
6<br />
4<br />
No <strong>of</strong> observations<br />
2<br />
0<br />
12<br />
10<br />
female<br />
8<br />
6<br />
4<br />
2<br />
0<br />
14 15 16 17 18 19<br />
SWA<br />
14 15 16 17 18 19<br />
DOMB<br />
14 15 16 17 18 19<br />
KOTA<br />
14 15 16 17 18 19<br />
CHIN<br />
number <strong>of</strong> dorsal spines<br />
Figure P8. Histogram with the number <strong>of</strong> dorsal spines, categorised by sex and locality.<br />
(n=60).<br />
<strong>The</strong> histogram <strong>of</strong> the number <strong>of</strong> dorsal fin spines (Figure P8) shows that in males there was a<br />
slight increase in spine number along the south-north axis. This pattern was not visible in<br />
females. In the SWA population, the modal number <strong>of</strong> dorsal spines is 16 for males (about 2/3<br />
16, 1/3 17); for the DOMB males both numbers are about equal; for the KOTA and<br />
particularly the CHIN males the majority have 17 dorsal fin spines.<br />
<strong>The</strong>se results show the presence <strong>of</strong> small but significant morphological differences<br />
between all M. anaphyrmus populations examined. <strong>The</strong> amount <strong>of</strong> difference is clearly linked<br />
to geographical distance.<br />
213
Table P3. Allelic frequencies observed in the four populations <strong>of</strong> M.<br />
anaphyrmus: South West Arm (SW), Domira Bay (DO), Nkhotakota<br />
(NK) and Chinteche (CH).<br />
SW DO NK CH<br />
Locus TMO M5<br />
(N) 21 15 14 4<br />
295 0.00 0.00 0.00 0.25<br />
313 0.05 0.00 0.00 0.00<br />
315 0.00 0.13 0.00 0.00<br />
317 0.02 0.10 0.00 0.00<br />
321 0.05 0.00 0.04 0.00<br />
323 0.43 0.20 0.00 0.00<br />
327 0.00 0.03 0.00 0.50<br />
329 0.12 0.03 0.04 0.25<br />
331 0.00 0.13 0.14 0.00<br />
333 0.00 0.03 0.21 0.00<br />
335 0.17 0.07 0.29 0.00<br />
337 0.02 0.17 0.21 0.00<br />
339 0.00 0.00 0.07 0.00<br />
353 0.02 0.00 0.00 0.00<br />
361 0.05 0.00 0.00 0.00<br />
363 0.00 0.07 0.00 0.00<br />
365 0.02 0.00 0.00 0.00<br />
367 0.02 0.00 0.00 0.00<br />
369 0.02 0.03 0.00 0.00<br />
H 0.79 0.90 0.83 0.71<br />
H obs. 0.48 0.67 0.50 0.50<br />
Locus TMO M27<br />
(N) 17 30 15 21<br />
236 0.00 0.02 0.00 0.05<br />
238 0.74 0.55 0.87 0.45<br />
240 0.00 0.08 0.03 0.05<br />
242 0.26 0.23 0.10 0.45<br />
244 0.00 0.12 0.00 0.00<br />
H 0.40 0.63 0.25 0.60<br />
H obs. 0.29 0.60 0.13 0.67<br />
H obs. 0.39 0.63 0.32 0.58<br />
A 7.00 8.00 5.00 3.50<br />
214
Genetic analysis<br />
Allelic frequencies obtained are summarised in Table P3 and P4 for Mylochromis<br />
anaphyrmus and Lethrinops gossei, respectively.<br />
Mylochromis anaphyrmus<br />
Four populations were investigated: South West Arm (SWA), Domira Bay (DOMB),<br />
Nkhotakota (KOTA) and Chinteche (CHIN). 19 alleles were observed at locus TMO M5 and<br />
5 at locus TMO M27. Fis and Fst values are summarised in Table P5 and Table P6,<br />
respectively.<br />
Table P5. Fis Values in M. anaphyrmus populations<br />
for both TMO M5 and TMO M27 loci.<br />
Statistically significant values are underlined.<br />
Locus TMO M5 TMO M27<br />
South West Arm 0.3976 0.2727<br />
Domira Bay 0.2689 0.0526<br />
Nkhotokota 0.4052 0.4667<br />
Chinteche 0.323 -0.1133<br />
At locus TMO M5, three out <strong>of</strong> four Fis values were statistically significant indicating that<br />
there was an excess <strong>of</strong> homozygous. Only the Chinteche sample did not exhibit such<br />
homozygous excess but it was likely due to the low sample size (4). No significant values<br />
have been observed for locus TMO M27.<br />
Table P6. Fst Values in M. anaphyrmus populations for all loci<br />
combined, TMO M5 alone and TMO M27 alone.<br />
Statistically significant values are underlined.<br />
All loci DOMB KOTA CHIN<br />
SWA 0.038 0.1057 0.1563<br />
DOMB _ 0.0639 0.0968<br />
KOTA _ 0.2018<br />
Locus TMO M5 DOMB KOTA CHIN<br />
SWA 0.047 0.1348 0.1984<br />
DOMB _ 0.0453 0.1341<br />
KOTA _ 0.1851<br />
Locus TMO M27 DOMB KOTA CHIN<br />
SWA 0.035 0.0257 0.0824<br />
DOMB _ 0.0947 0.0378<br />
KOTA _ 0.2304<br />
215
Table P4. Allelic frequencies observed in the five populations <strong>of</strong> L. gossei:<br />
South West Arm (SW), Leopard Bay (LB), Kiramby Point (KP), Nkhotakota<br />
(NK) and Chinteche (CH).<br />
SW LB KP NK CH<br />
Locus TMO M5<br />
(N) 17 19 2 11 3<br />
237 0.00 0.00 0.00 0.05 0.00<br />
293 0.00 0.00 0.00 0.14 0.00<br />
299 0.00 0.00 0.00 0.18 0.00<br />
317 0.00 0.03 0.00 0.00 0.00<br />
319 0.00 0.03 0.00 0.00 0.00<br />
321 0.00 0.00 0.00 0.23 0.00<br />
323 0.00 0.00 0.50 0.00 0.00<br />
325 0.00 0.05 0.00 0.00 0.50<br />
327 0.09 0.05 0.25 0.05 0.00<br />
329 0.03 0.00 0.00 0.00 0.00<br />
331 0.06 0.18 0.25 0.00 0.00<br />
333 0.03 0.00 0.00 0.00 0.00<br />
335 0.12 0.16 0.00 0.00 0.17<br />
337 0.09 0.00 0.00 0.00 0.00<br />
339 0.03 0.13 0.00 0.00 0.33<br />
341 0.09 0.03 0.00 0.00 0.00<br />
343 0.03 0.05 0.00 0.00 0.00<br />
345 0.06 0.08 0.00 0.00 0.00<br />
347 0.03 0.00 0.00 0.00 0.00<br />
349 0.00 0.03 0.00 0.00 0.00<br />
351 0.00 0.03 0.00 0.00 0.00<br />
353 0.00 0.05 0.00 0.00 0.00<br />
355 0.12 0.00 0.00 0.23 0.00<br />
357 0.06 0.03 0.00 0.00 0.00<br />
359 0.00 0.03 0.00 0.00 0.00<br />
361 0.00 0.00 0.00 0.14 0.00<br />
365 0.03 0.03 0.00 0.00 0.00<br />
369 0.12 0.00 0.00 0.00 0.00<br />
373 0.00 0.03 0.00 0.00 0.00<br />
379 0.03 0.00 0.00 0.00 0.00<br />
H 0.94 0.92 0.83 0.86 0.73<br />
Hobs. 0.88 0.63 0.50 0.64 0.33<br />
Locus TMO M27<br />
(N) 27 29 24 27 6<br />
219 0.04 0.00 0.00 0.00 0.00<br />
225 0.02 0.00 0.00 0.00 0.00<br />
229 0.00 0.00 0.04 0.00 0.00<br />
232 0.00 0.02 0.00 0.00 0.00<br />
236 0.00 0.00 0.08 0.04 0.00<br />
238 0.78 0.86 0.56 0.81 0.83<br />
240 0.02 0.05 0.00 0.00 0.00<br />
242 0.15 0.07 0.29 0.15 0.17<br />
244 0.00 0.00 0.02 0.00 0.00<br />
Hn.b. 0.38 0.25 0.60 0.32 0.30<br />
Hobs. 0.26 0.24 0.54 0.22 0.33<br />
Hobs 0.57 0.44 0.52 0.43 0.33<br />
A 10.5 10.5 4.0 5.0 2.5<br />
216
When using the two loci, all the populations were differentiated with statistically significant<br />
Fst values. All the populations but one were differentiated with locus TMO M5 alone and all<br />
but two with locus TMO M27 alone.<br />
Mantel test (using Fst and geographical distances matrices) obtained with locus TMO M5<br />
indicated a positive correlation between Fst and the geographical distances between<br />
populations (no Z’ value superior to Z) (Table P7).<br />
Table P7. Mantel matrices for Fst values (upper matrices)<br />
using all loci, TMO M5 alone or TMO M27 alone, and for<br />
geographical distances between M. anaphyrmus populations<br />
(lower matrices)<br />
All loci SWA DOMB KOTA CHIN<br />
SWA 0.038 0.1057 0.1563<br />
DOMB 60 _ 0.0639 0.0968<br />
KOTA 135 75 _ 0.2018<br />
CHIN 275 215 140 _<br />
Z=226.81, 24 permutations, 5 values ≥ Z<br />
Locus TMO M5 SWA DOMB KOTA CHIN<br />
SWA 0.047 0.1348 0.1984<br />
DOMB 60 _ 0.0453 0.1341<br />
KOTA 135 75 _ 0.1851<br />
CHIN 275 215 140 _<br />
Z=267.44, 24 permutations, 0 values ≥ Z<br />
Locus TMO M27 SWA DOMB KOTA CHIN<br />
SWA 0.035 0.0257 0.0824<br />
DOMB 60 _ 0.0947 0.0378<br />
KOTA 135 75 _ 0.2304<br />
CHIN 275 215 140 _<br />
Z=151.43, 24 permutations, 16 values ≥ Z<br />
217
Lethrinops gossei<br />
Five populations were investigated: South West Arm (SWA), Leopard Bay (LB)<br />
Kiramby Point (KP), Nkhotakota (KOTA) and Chinteche (CHIN). 30 alleles have been<br />
observed at locus TMO M5 and 9 at locus TMO M27.<br />
Fis and Fst values are summarised in Table P8 and Table P9, respectively.<br />
Table P8. Fis Values in L. gossei populations for both<br />
TMO M5 and TMO M27 loci. Statistically significant<br />
values are underlined.<br />
Locus TMO M5 TMO M27<br />
South West Arm 0.0698 0.318<br />
Leopard Bay 0.3229 0.0485<br />
Kiramby Point NA 0.120<br />
Nkhotokota 0.2708 0.3067<br />
Chinteche NA -0.1111<br />
Significant Fis values were observed at Leopard Bay and Nkhotakota for locus TMO M5 and<br />
at South West Arm for locus TMO M27.<br />
Table P9. Fst values in L. gossei populations for all loci, TMO M5 alone<br />
and TMO M27 alone. Statistically significant values are underlined.<br />
All loci LB KP KOTA CHIN<br />
SWA 0.0092 0.0485 0.0403 0.0595<br />
LB _ 0.0514 0.0727 0.0175<br />
KP _ 0.0886 0.07133<br />
KOTA _ 0.1080<br />
Locus TMO M5 LB KP KOTA CHIN<br />
SWA 0.0108 0.0462 0.0608 0.0999<br />
LB _ 0.0061 0.0932 0.0294<br />
KP 0.0983 0.0938<br />
KOTA _ 0.1584<br />
Locus TMO M27 LB KP KOTA CHIN<br />
SWA 0.0046 0.0540 -0.0178 -0.0600<br />
LB _ 0.1404 0.0012 -0.0263<br />
KP _ 0.0693 0.0321<br />
KOTA _ -0.0636<br />
218
Fst values were statistically significant between KOTA and SWA, KOTA and LB and<br />
between SWA and CHIN, mainly due to locus TMO M5.<br />
All Mantel tests did not indicate any correlation between Fst and geographical distances<br />
matrices for L. gossei populations (Table P10).<br />
Table P10. Mantel matrices for Fst values (upper matrices) using all loci, TMO M5<br />
alone or TMO M27 alone, and for geographical distances between L. gossei<br />
populations (lower matrices).<br />
All locus SWA LB KP KOTA CHIN<br />
SWA _ 0.009 0.049 0.040 0.060<br />
LB 31 _ 0.051 0.073 0.018<br />
KP 63 32 _ 0.089 0.071<br />
KOTA 123 92 60 _ 0108<br />
CHIN 243 212 180 120 _<br />
Z =131.82, 120 permutations, 75 values ≥ Z<br />
Locus TMO M5 SWA LB KP KOTA CHIN<br />
SWA _ 0.011 0.046 0.061 0.100<br />
LB 31 _ 0.006 0.093 0.029<br />
KP 63 32 _ 0.098 0.094<br />
KOTA 123 92 60 _ 0.158<br />
CHIN 243 212 180 120 _<br />
Z =183.51, 120 permutations, 39 values ≥ Z<br />
Locus TMO M27 SWA LB KP KOTA CHIN<br />
SWA _ 0.005 0.054 -0.018 -0.060<br />
LB 31 _ 0.140 0.001 -0.026<br />
KP 63 32 _ 0.069 0.032<br />
KOTA 123 92 60 _ -0.064<br />
CHIN 243 212 180 120 _<br />
Z =-23.82, 120 permutations, 117 values ≥ Z<br />
Despite the high number <strong>of</strong> specimens analysed at each location for each species,<br />
some populations are represented by a very low number <strong>of</strong> specimens due to technical<br />
problems. Both loci are polymorph and it is evident that the polymorphism <strong>of</strong> low sampled<br />
populations is underestimated (for every locus and species, the number <strong>of</strong> alleles increases<br />
with the sample size). Nevertheless, these data can be analysed keeping in mind that the<br />
results only indicate tendencies and have to be confirmed with more specimens and even<br />
more loci.<br />
219
120<br />
SWA<br />
6<br />
SWA<br />
100<br />
5<br />
80<br />
4<br />
60<br />
3<br />
40<br />
2<br />
20<br />
1<br />
0<br />
0 20 40 60 80 100 120 140 160<br />
0<br />
3,50 4,00 4,50 5,00 5,50<br />
120<br />
Domira Bay<br />
5<br />
Domira Bay<br />
Weight (g)<br />
100<br />
80<br />
60<br />
40<br />
20<br />
ln weight<br />
4<br />
3<br />
2<br />
1<br />
0<br />
0 20 40 60 80 100 120 140 160<br />
0<br />
3,50 4,00 4,50 5,00 5,50<br />
120<br />
Nkhotakota<br />
5<br />
Nkhotakota<br />
100<br />
80<br />
60<br />
40<br />
4<br />
3<br />
2<br />
20<br />
1<br />
0<br />
0 20 40 60 80 100 120 140 160<br />
0<br />
3,50 4,00 4,50 5,00 5,50<br />
120<br />
Chinteche<br />
5<br />
Chinteche<br />
100<br />
80<br />
60<br />
40<br />
20<br />
4<br />
3<br />
2<br />
1<br />
0<br />
0 20 40 60 80 100 120 140 160<br />
Length (mm)<br />
0<br />
3,50 4,00 4,50 5,00 5,50<br />
ln length<br />
Figure P9. Length-weight relationships for Mylochromis anaphyrmus females at four<br />
locations in <strong>Lake</strong> <strong>Malawi</strong>.<br />
220
In both species we found some significant Fis values. It is very likely that, to some extent, a<br />
non-random mating exists. Under the neutral model, heterozygous deficits are expected either<br />
when there is a mixture <strong>of</strong> different reproductive units inside a sample (“classical” Wahlund<br />
effect) or when there is family structuring or inbreeding within this sample. Typically when<br />
two or more populations are mixed in a sample, linkage desequilibrium (non randomly<br />
association between alleles <strong>of</strong> different loci) is observed as well as heterozygous deficits.<br />
Linkage desequilibrium can also be caused by random drift in small size population or by<br />
strong selection, two hypotheses that can be rejected here. For both species and loci, no<br />
linkage desequilibrium has been detected, hence local inbreeding might explain the observed<br />
results.<br />
We also have to pay attention to possible null alleles, which can create artificial heterozygous<br />
deficits: in this case also, no linkage desequilibrium was observed.<br />
Statistically significant Fst values were observed in both species for both loci and populations<br />
<strong>of</strong> M. anaphyrmus were more differentiated than those <strong>of</strong> L. gossei. It is then possible that the<br />
different populations <strong>of</strong> both species are genetically differentiated.<br />
<strong>The</strong> results <strong>of</strong> the Mantel test indicated a correlation between Fst values and the geographical<br />
distances between all pairs <strong>of</strong> populations in M. anaphyrmus. This could correspond to an<br />
isolation by distance model, a model in which populations exchange few migrants, mainly<br />
with close populations.<br />
Life history traits analysis<br />
Mylochromis anaphyrmus:<br />
At every sample site, <strong>fish</strong> were collected in February 99, which corresponded with the<br />
beginning <strong>of</strong> the breeding season in the SWA. <strong>The</strong> timing <strong>of</strong> breeding season for the species is<br />
unknown in Domira Bay, Nkhotakota and Chinteche. However, the percentages <strong>of</strong> ripe<br />
females were not significantly different among sites (One way ANOVA on ranks Kruskal-<br />
Wallis, H=2.916, 3 df, p=0.405): 6% in SWA, 4% in Domira Bay, 9% in Nkhotakota and 6%<br />
in Chinteche.<br />
Length-weight relationships at each location are given in Table P11. Comparison <strong>of</strong><br />
length-weight relationships after Log transformation (Figure P9) revealed significant<br />
differences among populations (F 3,535 =6.145, p
Table P11. Comparison <strong>of</strong> Mylochromis anaphyrmus populations. Total number <strong>of</strong> <strong>fish</strong> (N),<br />
length (L)_weight (W) relationships, determination coefficient (R²), number <strong>of</strong> <strong>fish</strong> used for<br />
fecundity calculation (n), mean relative fecundity (MRF) ± SEM.<br />
Location N Relationships R² n MRF<br />
SWA 126 W = 0.00001 × L 3.2353<br />
ln(W) = 3.2373 × ln(L) – 11.4997<br />
Domira Bay 107 W = 0.00001 × L 3.1446<br />
ln(W) = 3.1446 × ln(L) – 11.1180<br />
Nkhotakota 122 W = 0.00003 × L 3.0204<br />
ln(W) = 3.0204 × ln(L) – 10.5690<br />
Chinteche 185 W = 0.000007 × L 3.2946<br />
ln(W) = 3.2946 × ln(L) – 11.8430<br />
0.984 7 2391 ± 94<br />
0.957 3 3469 ± 273<br />
0.971 11 2494 ± 121<br />
0.984 11 2281 ± 77<br />
Table P12. Comparison <strong>of</strong> length-weight relationships (ln transformed) among populations <strong>of</strong><br />
Mylochromis anaphyrmus. ns : non significant, *: significant slope differences (p
Table P13. Comparison <strong>of</strong> relative fecundity among populations <strong>of</strong> Mylochromis anaphyrmus.<br />
ns : non significant, *: significant differences (p
SWA<br />
120<br />
100<br />
80<br />
60<br />
40<br />
20<br />
0<br />
0 50 100 150<br />
SWA<br />
5<br />
4<br />
3<br />
2<br />
1<br />
0<br />
3,50 4,00 4,50 5,00 5,50<br />
120<br />
100<br />
80<br />
60<br />
40<br />
20<br />
0<br />
Leopard Bay<br />
0 50 100 150<br />
Leopard Bay<br />
5<br />
4<br />
3<br />
2<br />
1<br />
0<br />
3,50 4,00 4,50 5,00 5,50<br />
Weight (g)<br />
Kiramby Point<br />
120<br />
100<br />
80<br />
60<br />
40<br />
20<br />
0<br />
0 50 100 150<br />
ln weight (g)<br />
Kiramby Point<br />
5<br />
4<br />
3<br />
2<br />
1<br />
0<br />
3,50 4,00 4,50 5,00 5,50<br />
Nkhotakota<br />
120<br />
100<br />
80<br />
60<br />
40<br />
20<br />
0<br />
0 50 100 150<br />
Nkhotakota<br />
5<br />
4<br />
3<br />
2<br />
1<br />
0<br />
3,50 4,00 4,50 5,00 5,50<br />
120<br />
100<br />
80<br />
60<br />
40<br />
20<br />
0<br />
Chinteche<br />
0 50 100 150<br />
Length (mm)<br />
5<br />
4<br />
3<br />
2<br />
1<br />
Chinteche<br />
0<br />
3,50 4,00 4,50 5,00 5,50<br />
ln length (mm)<br />
Figure P10. Length-weight relationships for Lethrinops gossei females at five<br />
locations in <strong>Lake</strong> <strong>Malawi</strong>.<br />
224
Table P15. Comparison <strong>of</strong> Lethrinops gossei populations. Total number <strong>of</strong> <strong>fish</strong> (N), length<br />
(L)_weight (W) relationships, determination coefficient (R²), number <strong>of</strong> <strong>fish</strong> used for<br />
fecundity calculation (n), mean relative fecundity (MRF) ± SEM.<br />
Location N Relationships R² n MRF<br />
SWA 287 W = 0.00004 × L 2.9598<br />
ln(W) = 2.9598 × ln(L) – 10.107<br />
Leopard Bay 192 W = 0.00003 × L 3.0107<br />
ln(W) = 3.0441 × ln(L) – 10.502<br />
Kiramby Point 89 W = 0.00002 × L 3.0749<br />
ln(W) = 3.0749 × ln(L) – 10.687<br />
Nkhotakota 281 W = 0.00002 × L 3.1267<br />
ln(W) = 3.1267 × ln(L) – 10.933<br />
Chinteche 13 W = 0.00005 × L 2.9097<br />
ln(W) = 2.9097 × ln(L) – 9.8257<br />
0.971 67 1999 ± 46<br />
0.866 0<br />
0.960 11 2204 ± 103<br />
0.959 27 2054 ± 57<br />
0.967 4 1823 ± 85<br />
Comparison <strong>of</strong> length-weight relationships after Log transformation (Figure P10) revealed<br />
significant differences among populations (F 4,857 =2.505, p=0.041) even when Chinteche was<br />
removed from analysis (F 3,845 =3.291, p=0.02). Multiple comparison procedure showed either<br />
slope or intercept differences between SWA and Kiramby Point, SWA and Nkhotakota,<br />
Leopard bay and Nkhotakota, Kiramby Point and Chinteche, Nkhotakota and Chinteche<br />
(Table P16).<br />
Table P16. Comparison <strong>of</strong> length-weight relationships (ln transformed) among populations <strong>of</strong><br />
Lethrinops gossei. ns : non significant, *: significant slope differences (p
<strong>The</strong> number <strong>of</strong> eggs per kg body weight (relative fecundity Table P15) produced by<br />
females did not differ among populations for L. gossei (F=1.589, p=0.196).<br />
Except for the percentage <strong>of</strong> ripe females, which differed significantly among L.<br />
gossei populations only, differences among populations were more intense (see significance<br />
levels <strong>of</strong> statistic tests) and more numerous for M. anaphyrmus than for L. gossei. Indeed,<br />
there was no fecundity difference among populations for L. gossei, and the significance level<br />
for length-weight relationships differences was just below 5% (p=0.041) while it was highly<br />
significant between M. anaphyrmus populations (p
Chapter 6:<br />
<strong>The</strong> potential influence <strong>of</strong> fluvial<br />
sediments on rock-dwelling <strong>fish</strong><br />
communities
Chapter 6: <strong>The</strong> potential influence <strong>of</strong> fluvial sediments on rockdwelling<br />
<strong>fish</strong> communities<br />
F. Duponchelle, A.J. Ribbink, A. Msukwa, J. Mafuka & D. Mandere<br />
Introduction<br />
In <strong>Malawi</strong>, the increasing demographic pressure (Ferguson et al. 1993, Kalipeni 1996)<br />
has recently accelerated the unsustainable land use practices around the lakeshore and its<br />
catchments. As a result <strong>of</strong> deforestation, burning <strong>of</strong> vegetation, destruction <strong>of</strong> wet lands in the<br />
catchments for agricultural purposes and the cultivation <strong>of</strong> marginal areas such as steep slopes<br />
<strong>of</strong> hills (Mkanda 1999), massive quantities <strong>of</strong> sediment eroded from clear-cut watersheds are<br />
discharged in the rivers and eventually in the lake (Bootsma & Hecky 1993). <strong>The</strong> negative<br />
impact <strong>of</strong> excess sedimentation and water turbidity on the diversity and <strong>ecology</strong> <strong>of</strong> aquatic<br />
communities has been <strong>report</strong>ed for other Great <strong>Lake</strong>s (Waters 1995, Evans et al. 1996) and<br />
<strong>Lake</strong> Tanganyika particularly (review by Patterson & Makin 1998). In <strong>Lake</strong> Tanganyika,<br />
species richness <strong>of</strong> crustacean ostracodes was found much lower at highly disturbed sites than<br />
at less disturbed sites, reductions ranging from 40 to 62%. <strong>The</strong> same pattern, though not<br />
statistically tested, was observed for <strong>fish</strong>, with reductions in species richness ranging from 35<br />
to 65% at highly disturbed sites (Cohen et al. 1993a, Cohen et al. 1996). Lower <strong>fish</strong> diversity<br />
was also <strong>report</strong>ed in areas that have become turbid as a result <strong>of</strong> recent eutrophication in <strong>Lake</strong><br />
Victoria, where increased turbidity was recognised to be partly responsible for the decline in<br />
cichlid diversity (Seehausen et al. 1997). In <strong>Lake</strong> <strong>Malawi</strong>, the impact <strong>of</strong> sediment discharge is<br />
not yet permanent and remains associated to the rainy season. However, intensification <strong>of</strong><br />
unsustainable land use practices increases the sediment loads and is cause <strong>of</strong> major concern<br />
(Bootsma & Hecky 1993). <strong>The</strong> limnology team <strong>of</strong> the SADC/GEF Project identified the<br />
steadily increasing sediment and nutrient loads arriving both from rivers and atmosphere as<br />
the main threat to the water quality and therefore to the stability <strong>of</strong> the lake ecosystem as a<br />
whole (Bootsma & Hecky 1999). As an example, within three days following a strong rain<br />
event in February 1998, the Linthipe River, located in the highly populated southern part <strong>of</strong><br />
the lake, delivered about 700 000 tonnes <strong>of</strong> suspended sediment to <strong>Lake</strong> <strong>Malawi</strong> (McCullough<br />
1999). Much <strong>of</strong> the suspended river load is made <strong>of</strong> sand and coarse silt which settled out<br />
quickly (McCullough 1999). Despite the rapid deposition <strong>of</strong> most <strong>of</strong> these sediments, from<br />
January to March-April, a sediment plume settles more or less permanently, depending on<br />
wind and currents, around the Maleri Islands in front <strong>of</strong> the river mouth. Among the potential<br />
effects <strong>of</strong> increased sediment loads on aquatic communities (listed in Patterson & Makin<br />
1998), the reduction <strong>of</strong> light penetration affecting photosynthetic rates or sexual mate choice<br />
(Seehausen et al. 1997), the reduction <strong>of</strong> habitat complexity and destruction <strong>of</strong> spawning<br />
grounds are <strong>of</strong> direct importance for <strong>fish</strong> (Waters 1995, Evans et al. 1996, Lévêque 1997). As<br />
an example, over-<strong>fish</strong>ing and siltation resulting from deforestation have strongly diminished<br />
the abundance <strong>of</strong> potadromous <strong>fish</strong> species in <strong>Lake</strong> <strong>Malawi</strong> (Tweddle 1992, Turner 1994b).<br />
For the littoral rocky shore, which food web is based on benthic algae growing on rocks<br />
(Worthington & Lowe-McConnell 1994), the blanketing <strong>of</strong> benthic algae by deposited<br />
sediments primarily affects the specialised aufwuchs eaters (Patterson & Makin 1998). <strong>Lake</strong><br />
<strong>Malawi</strong> rock-dwelling mbuna, whose communities directly rely on the algal carpet covering<br />
the rocks (Fryer 1959, Ribbink et al. 1983, Marsh & Ribbink 1986, Reinthal 1990) and whose<br />
mobility and migration capacity are very restricted (Ribbink et al. 1983, McElroy & Kornfield<br />
227
N<br />
Senga Bay<br />
Linthipe river<br />
Maleri islands<br />
Chipoka<br />
Cape Mclear<br />
SWA<br />
SEA<br />
Linthipe river<br />
MALERI ISLANDS<br />
Nankoma<br />
Maleri<br />
Nsh<br />
Nakantenga<br />
Nex<br />
Figure S1. Southern <strong>Lake</strong> <strong>Malawi</strong>, with a detail <strong>of</strong> the Linthipe river delta and the Maleri<br />
islands. Arrows indicate the two sampling sites on Nakantenga island, Nsheltered (Nsh)<br />
and Nexposed (Nex). Detailed region redrawn from P. Cooley (1999).<br />
228
1990, Van Oppen et al. 1997) should therefore be directly impacted by the increasing<br />
sediment discharges. Ribbink et al (1983) found a mantle <strong>of</strong> mud was deposited by plumes on<br />
the rocks <strong>of</strong> the Maleri Islands and postulated that it would affect the <strong>fish</strong>es access to benthic<br />
algae. Occasional observations <strong>of</strong> <strong>fish</strong> migrations from deep water to the shallows in the<br />
rocky shores <strong>of</strong> the Maleri Islands when the sediment plume was settled were <strong>report</strong>ed (H.<br />
Bootsma, pers. com.). During the plume influence, the light penetration is greatly reduced and<br />
affects the benthic algal productivity on which most <strong>of</strong> the mbuna depend. Higgins et al.<br />
(1999) indicated how this would cause the <strong>fish</strong> to move upwards to the shallows to<br />
compensate for the shortage <strong>of</strong> food in the deeper waters. <strong>The</strong> present study, carried out in<br />
collaboration with the limnology team <strong>of</strong> the project, was designed to test for that hypothesis<br />
and to monitor the potential influence <strong>of</strong> suspended sediments on the diversity, abundance,<br />
condition and some life history traits <strong>of</strong> rock-dwelling <strong>fish</strong> communities.<br />
Material and methods<br />
<strong>The</strong> rainy season in the <strong>Lake</strong> <strong>Malawi</strong>/Nyasa basin usually starts in November and ends<br />
in March (Eccles 1974, Ribbink 1994). In order to assess the potential influence <strong>of</strong> suspended<br />
sediment on rock-dwelling <strong>fish</strong> communities, we decided to sample during undisturbed<br />
condition (i.e. before the rains), during the disturbed situation (i.e. the rainy season) and after<br />
a few months <strong>of</strong> recovered undisturbed situation (i.e. after the end <strong>of</strong> rains). Hence, from<br />
October 1998 to May 1999, 2 sites impacted by fluvial sediments and 2 control sites were<br />
sampled monthly.<br />
<strong>The</strong> impacted sites were located on Nakantenga Island (Figure S1), <strong>of</strong>f the Linthipe river<br />
mouth. <strong>The</strong> Linthipe is the largest river <strong>of</strong> the southern part <strong>of</strong> the lake and its catchment is<br />
one <strong>of</strong> the most densely populated around the lake (Mkanda 1999, Kingdon et al. 1999,<br />
Bootsma & Hecky 1999). <strong>The</strong> Linthipe catchment has been selected as a model for the study<br />
<strong>of</strong> land use, soil erosion and sedimentation in <strong>Lake</strong> <strong>Malawi</strong> watershed (Mkanda F.X. PhD<br />
thesis in prep., McCullough G., PhD thesis in prep.). Two sites were sampled on Nakantenga<br />
Island:<br />
- a sheltered bay (Nsh) located on the northern shore <strong>of</strong> the island and protected from the<br />
south-easterly trade wind (Mwera), mainly blowing from June to September, by a natural<br />
rock barrier,<br />
- an exposed bay (Nex) located on the other side <strong>of</strong> the rock barrier, hence submitted to the<br />
trade wind.<br />
<strong>The</strong> control sites were located in a sediment free area, in Thumbi West Island at Cape Maclear<br />
(Figure S2). T13 is a little protected bay on the north side <strong>of</strong> the island, whereas T8 is a non<br />
protected rocky area on the northeast side <strong>of</strong> the island.<br />
Fish species were named according to Ribbink et al. (1983). Every month from<br />
October 98 to April 99, the following sampling was carried out at each site:<br />
• Fish diversity and abundance were estimated using underwater visual censuses at 10<br />
m, 6 m and 2 m depth, following the protocol described in Ribbink et al. (1983). Transects<br />
were demarcated by two 6 mm diameter nylon cords, 25 m in length, held 2 m apart by a<br />
galvanised pipe at each end so that an area <strong>of</strong> 50 m² was sampled. At each site and depth, the<br />
4 corners <strong>of</strong> the 50 m² areas were permanently marked to ensure that the censuses were done<br />
exactly at the same place every month. <strong>Fishes</strong> within the demarcated areas were counted after<br />
waiting at least 3 min for them to recover from any diver disturbance. For most species,<br />
sexually active males, in breeding dress and apparently defending territories, were counted.<br />
For each species, the number <strong>of</strong> individuals was the mean number <strong>of</strong> two consecutive<br />
censuses along the transect.<br />
229
N<br />
Senga Bay<br />
Linthipe river<br />
Chipoka<br />
Maleri islands<br />
Cape Mclear<br />
SWA<br />
SEA<br />
T 13<br />
T 8<br />
Thumby west<br />
CAPE MCLEAR<br />
Otter point<br />
Figure S2. Southern <strong>Lake</strong> <strong>Malawi</strong>, with a detail <strong>of</strong> Cape Mclear showing the sampling sites<br />
on Thumby west island, T13 and T8. Detailed region redrawn from P. Cooley (1999).<br />
230
Owing to the very bad visibility conditions at both sites in Nakantenga island in February and<br />
March 1999 (Secchi disk measurements < 2 m), visual censuses were not possible. Owing to<br />
technical problems, none <strong>of</strong> the sites was sampled in November 1998, and Thumbi sites were<br />
not sampled in October.<br />
• At each site and depth, a 30 m length × 1.5 m height mon<strong>of</strong>ilament nylon gill net,<br />
constituted <strong>of</strong> three 10 m panels <strong>of</strong> 0.5, 1 and 1.5 inch mesh size, was set for two hours. Gill<br />
nets were carefully set apart from the areas used for visual censuses. <strong>The</strong> depth at the<br />
beginning and the end <strong>of</strong> setting was checked with a manual depth sounder (Echotest,<br />
Plastimo) and verified with scuba shortly after. After two hours, the <strong>fish</strong> were removed from<br />
the net, sorted to species, labelled and placed in 10% formalin for later examination. Gill nets<br />
were found to fluctuate too much in their catches to be used for diversity and abundance<br />
estimations. Indeed, parts <strong>of</strong> the net were sometimes torn by rocks either during setting or<br />
hauling, which modified the catch per unit effort (CPUE). Some <strong>fish</strong> species tended to follow<br />
the diver during the checking <strong>of</strong> the net depth, entangling themselves more than without the<br />
diver's disturbance, which also modified the CPUE. <strong>The</strong>refore, gill nets were not used to<br />
estimate <strong>fish</strong> diversity and abundance. <strong>The</strong>y were used only to assess the potential<br />
modification <strong>of</strong> life history traits during the plume, such as variations in the % <strong>of</strong> ripe<br />
females, in the condition factor, the fecundity and the egg size.<br />
Both visual censuses and gill net samplings were always done in the morning between 8.00<br />
and 12.00 to avoid potential diel fluctuations in <strong>fish</strong> distribution and abundance.<br />
• Concurrently, benthic algae samples were collected by scraping at the same depths on<br />
top <strong>of</strong> flat horizontal rocks, to monitor the benthic algae biomass. Algae samples were<br />
processed by the limnology team <strong>of</strong> the project. <strong>The</strong> scrapings were collected using a thickwalled<br />
acrylic tube with an inside diameter <strong>of</strong> 4.5 cm². <strong>The</strong> base <strong>of</strong> the tube was fitted with a<br />
neoprene skirt to ensure a good seal with the rock. A plunger fitted with a stiff wire brush<br />
within the tube was used to scrape the algae <strong>of</strong>f <strong>of</strong> the rock. After scraping, the sample was<br />
drawn into a syringe that was attached near the base <strong>of</strong> the scraping tube via a small tube.<br />
After collection, the sample was poured into a bottle and diluted to 250 ml. After thoroughly<br />
mixing, a subsample <strong>of</strong> this was filtered on a Whatman glass fibre GF/F filter (nominal pore<br />
size = 0.7 µm). <strong>The</strong> filter was placed in a mixture <strong>of</strong> methanol and acetone for at least 24<br />
hours to extract algal pigments, after which chlorophyll a was measured on a Turner<br />
fluorometer. Based on the volume <strong>of</strong> extract, the filtration volume, and the area <strong>of</strong> rock that<br />
was scraped, the final measured volumetric chlorophyll a concentration was converted to an<br />
areal measurement <strong>of</strong> µg/cm². Samples were usually collected in triplicate.<br />
• Secchi disk measurements were also carried out to monitor the water transparency.<br />
All <strong>fish</strong> preserved in formalin were measured (SL) to the nearest 1 mm and weighed to<br />
the nearest 0.1 g. <strong>The</strong>ir maturity stage was determined and the gonads in stage 4 were<br />
weighed for Gonado-Somatic Index (GSI) calculation (gonad weight/total body weight × 100)<br />
then preserved in 5% formalin for fecundity and mean oocyte weight calculation.<br />
<strong>The</strong> maturity stage <strong>of</strong> female gonads was macroscopically determined using the slightly<br />
modified scale <strong>of</strong> Legendre & Ecoutin (1989) (Duponchelle 1997).<br />
Stage 1: immature. <strong>The</strong> gonad looks like two short transparent cylinders. No oocytes are<br />
visible to the naked eyes. As a comparison, immature testicle is much longer and thinner, like<br />
two long tinny silver filaments.<br />
Stage 2: beginning maturation. <strong>The</strong> ovaries are slightly larger and little whitish oocytes and<br />
apparent.<br />
Stage 3: maturing. <strong>The</strong> ovaries continue to grow in length and thickness and are full <strong>of</strong><br />
yellowish oocytes in early vitellogenesis.<br />
Stage 4: final maturation. <strong>The</strong> ovaries occupy a large part <strong>of</strong> the abdominal cavity and are full<br />
<strong>of</strong> large uniform sized oocytes in late vitellogenesis.<br />
231
Stage 5: ripe. Ovulation occurred, oocytes can be expelled by a gentle pressure on the<br />
abdomen. This stage is ephemera.<br />
Stage 6: spent. <strong>The</strong> ovaries look like large bloody empty bags with remaining large sized<br />
atretic follicles. Small whitish oocytes are visible.<br />
Stage 6-2: resting. <strong>The</strong> general aspect <strong>of</strong> the gonad recall a stage 2, but the ovarian wall is<br />
thicker, the gonad is larger, <strong>of</strong>ten reddish with an aspect <strong>of</strong> empty bag. This stage is<br />
distinctive <strong>of</strong> resting females, which have spawned during the past breeding season.<br />
Stage 6-3: recovering post-spawning females. <strong>The</strong> general aspect <strong>of</strong> the gonad is like a stage 3<br />
but with empty rooms, remaining large-sized atretic follicles and the blood vessels are still<br />
well apparent. This stage is characteristic <strong>of</strong> post-spawning females initiating another cycle <strong>of</strong><br />
vitellogenesis.<br />
Males were only recorded as being either in "breeding colour" or not.<br />
<strong>The</strong> average size at first maturation (L 50 ) is defined as the standard length at which<br />
50% <strong>of</strong> the females are at an advanced stage <strong>of</strong> the first sexual cycle during the breeding<br />
season. In practice, this is the size at which 50% <strong>of</strong> the females have reached the stage 3 <strong>of</strong> the<br />
maturity scale (Legendre & Ecoutin 1996, Duponchelle & Panfili 1998). For the estimation <strong>of</strong><br />
L 50 , only the <strong>fish</strong> sampled during the height <strong>of</strong> the breeding season were considered.<br />
Fecundity is defined here as the number <strong>of</strong> oocytes to be released at the next spawn,<br />
and correspond to the absolute fecundity. It is estimated, from gonads in the final maturation<br />
stage (stage 4), by the number <strong>of</strong> oocytes belonging to the largest diameter modal group. This<br />
oocyte group is clearly separated from the rest <strong>of</strong> the oocytes to the naked eye and<br />
corresponds approximately to oocytes that are going to be released (Duponchelle 1997,<br />
Duponchelle et al. 2000).<br />
Oocyte weight measurements were all carried out on samples preserved in 5%<br />
formalin. <strong>The</strong> average oocyte weight per female, was determined by weighing 50 oocytes<br />
(Peters 1963) belonging to those considered for fecundity estimates.<br />
In order to compare mean oocyte weight and diameter among the different species, the<br />
measurements need to be made on oocytes in a similar vitellogenic stage, then on oocytes<br />
whose growth is completed. A simplified version <strong>of</strong> the method applied by Duponchelle<br />
(1997) was used to determine the GSI threshold above which the oocyte weight do no longer<br />
increase significantly. For each species, the individual oocyte weights were plotted against the<br />
GSI. <strong>The</strong> GSI corresponded to the beginning <strong>of</strong> the asymptotic part <strong>of</strong> the curve was visually<br />
determined and the <strong>fish</strong> whose GSI was inferior to the defined GSI were removed. <strong>The</strong> final<br />
GSI threshold was reached when no correlation subsisted between the mean oocyte weight<br />
and the GSI.<br />
<strong>The</strong> Fulton's condition factor was calculated as CF = 100 000 × W/L 3 , where W is the<br />
wet weight and L the standard length (Anderson & Gutreuter 1983). Given the well known<br />
trend <strong>of</strong> CF to increase with the length <strong>of</strong> <strong>fish</strong> (Anderson & Gutreuter 1983), the absence <strong>of</strong><br />
relationship between length and CF over the size range sampled was checked for every<br />
species using Pearson correlation.<br />
Statistics<br />
Comparisons <strong>of</strong> among months diversity and abundance <strong>of</strong> <strong>fish</strong> species were<br />
performed with one way repeated measures ANOVA using SigmaStat s<strong>of</strong>tware (Jandel<br />
Scientific).<br />
<strong>The</strong> temporal variation <strong>of</strong> the condition factor for every species was assessed using<br />
univariate general linear model with month, site and sex as factors and CF as the dependant<br />
232
Nakatenga sheltered (Nsh)<br />
16<br />
14<br />
12<br />
10<br />
8<br />
6<br />
4<br />
2<br />
0<br />
2 m<br />
16<br />
14<br />
12<br />
10<br />
8<br />
6<br />
4<br />
2<br />
0<br />
6 m<br />
16<br />
14<br />
12<br />
10<br />
8<br />
6<br />
4<br />
2<br />
0<br />
10 m<br />
Oct-98<br />
Nov-98<br />
Dec-98<br />
Jan-99<br />
Feb-99<br />
Mar-99<br />
Apr-99<br />
May-99<br />
Nakatenga exposed (Nex)<br />
16<br />
14<br />
12<br />
10<br />
8<br />
6<br />
4<br />
2<br />
0<br />
2 m<br />
Oct-98<br />
Nov-98<br />
Dec-98<br />
Jan-99<br />
Feb-99<br />
Mar-99<br />
Apr-99<br />
May-99<br />
Oct-98<br />
Nov-98<br />
Dec-98<br />
Jan-99<br />
Feb-99<br />
Mar-99<br />
Apr-99<br />
May-99<br />
16<br />
14<br />
12<br />
10<br />
8<br />
6<br />
4<br />
2<br />
0<br />
6 m<br />
Oct-98<br />
Nov-98<br />
Dec-98<br />
Jan-99<br />
Feb-99<br />
Mar-99<br />
Apr-99<br />
May-99<br />
Oct-98<br />
Nov-98<br />
Dec-98<br />
Jan-99<br />
Feb-99<br />
Mar-99<br />
Apr-99<br />
May-99<br />
16<br />
14<br />
12<br />
10<br />
8<br />
6<br />
4<br />
2<br />
0<br />
10 m<br />
Oct-98<br />
Nov-98<br />
Dec-98<br />
Jan-99<br />
Feb-99<br />
Mar-99<br />
Apr-99<br />
May-99<br />
Thumby west 13 (T13)<br />
25<br />
2 m<br />
25<br />
6 m<br />
25<br />
10 m<br />
20<br />
20<br />
20<br />
15<br />
15<br />
15<br />
10<br />
10<br />
10<br />
5<br />
5<br />
5<br />
0<br />
0<br />
0<br />
Thumby west 8 (T8)<br />
25<br />
2 m<br />
20<br />
15<br />
10<br />
5<br />
0<br />
Oct-98<br />
Nov-98<br />
Dec-98<br />
Jan-99<br />
Feb-99<br />
Mar-99<br />
Apr-99<br />
May-99<br />
Oct-98<br />
Nov-98<br />
Dec-98<br />
Jan-99<br />
Feb-99<br />
Mar-99<br />
Apr-99<br />
May-99<br />
25<br />
6 m<br />
20<br />
15<br />
10<br />
5<br />
0<br />
Oct-98<br />
Nov-98<br />
Dec-98<br />
Jan-99<br />
Feb-99<br />
Mar-99<br />
Apr-99<br />
May-99<br />
Oct-98<br />
Nov-98<br />
Dec-98<br />
Jan-99<br />
Feb-99<br />
Mar-99<br />
Apr-99<br />
May-99<br />
25<br />
10 m<br />
20<br />
15<br />
10<br />
5<br />
0<br />
Oct-98<br />
Nov-98<br />
Dec-98<br />
Jan-99<br />
Feb-99<br />
Mar-99<br />
Apr-99<br />
May-99<br />
Oct-98<br />
Nov-98<br />
Dec-98<br />
Jan-99<br />
Feb-99<br />
Mar-99<br />
Apr-99<br />
May-99<br />
Figure S4. Monthly progression <strong>of</strong> benthic chlorophyll a biomass (µg/cm²) (black dots) and <strong>of</strong> light<br />
penetration estimated by Secchi disk measurements (m) (white triangles) at 2 m, 6 m and 10 m depth<br />
at each sampled site, from October 1998 to May 1999. Note the different y axis scale between<br />
Nakantenga and Thumby sites. Algae sampling was done on top <strong>of</strong> flat horizontal rocks using a<br />
scrapper. Values are averages <strong>of</strong> three replicates.<br />
233
Results<br />
variable, using SPSS s<strong>of</strong>tware. Given the low sample number at some sites for some species,<br />
the significance level for interaction between factors was fixed at 1%.<br />
Although rainfall patterns might be slightly different in Cape Maclear and Maleri<br />
Islands than in Senga bay, rains effectively started at the end <strong>of</strong> November 1998 (the 23 rd ) and<br />
stopped the 11 th <strong>of</strong> April 1999 at Senga Bay station (Figure S3). Despite an effective start <strong>of</strong><br />
the rainy season in late November, the Linthipe river discharge really began in January to<br />
reach a peak in March (Figure S3). As the sediment plume is linked to the river discharge<br />
rather than to the rains directly, therefore the period under consideration when referring herein<br />
to the rainy season is "January to May".<br />
In February and March 1999, visibility was so poor in Nakantenga sites that visual<br />
censuses were impossible to carry out. However, while one <strong>of</strong> the two divers was scraping for<br />
benthic algae samples, the other diver was doing <strong>fish</strong> observations. Although this required to<br />
be less than 50 cm away from the <strong>fish</strong> and that it was <strong>of</strong>ten impossible to identify the species,<br />
behavioural observations were still possible. Fish were virtually immobile with fins held erect<br />
a they do at night. <strong>The</strong>y stayed in or very close to the entrance to their hideaways among the<br />
rocks, or rested on the rocks. <strong>The</strong>re was virtually no feeding, territorial or courtship<br />
behaviour.<br />
Chlorophyll a biomass<br />
Mean monthly benthic chlorophyll a biomass for each depth and site are presented in<br />
Figure S4. A similar temporal trend was evident at almost all sites and depths, suggesting that<br />
these data, though collected only once per month, represented real monthly trends. A<br />
chlorophyll peak was observed in December 1998 at every depth in Thumbi West sites,<br />
possibly due to an increased nutrient availability resulting from land run<strong>of</strong>f (H. Bootsma,<br />
pers. com.). Another smaller peak was observed in April-May, but apart from these peaks,<br />
chlorophyll concentration was rather similar between the dry and rainy seasons. At<br />
Nakantenga sites, there was also a slight increase in chlorophyll in December, though not<br />
apparent at all depths, but it was followed by chlorophyll concentrations that were lower than<br />
before the rainy season. This suggests a greater impact <strong>of</strong> siltation and reduced light<br />
penetration at Nakantenga. However, changes in chlorophyll concentration at the impacted<br />
sites (Nsh and Nex) were less important than expected. Indeed, from January-February to<br />
May 1999, the thickness <strong>of</strong> sediment (up to 2 cm sometimes) covering the rocks observed<br />
while diving at all depths (and especially at 6 and 10 m) should have almost completely<br />
prevent photosynthesis, even when the plume was temporary out <strong>of</strong> the island. Furthermore<br />
light penetration was severely diminished when the plume was settled, with Secchi disk<br />
measurements inferior to 4 m from February to April (Figure S4). Concern that benthic<br />
chlorophyll a concentration did not change as much as expected between the dry and the rainy<br />
season at Nakantenga matched observations on previous years at the nearby Maleri Island by<br />
the project's limnology team. <strong>The</strong> explanation probably lies in the phytoplankton production<br />
in the first few metres that had settled and mixed with the sediment (H. Bootsma, pers. com.).<br />
<strong>The</strong> question is whether this type <strong>of</strong> algae is still useful to the <strong>fish</strong> as a food source?<br />
234
Total rainfall (mm)<br />
250<br />
200<br />
150<br />
100<br />
50<br />
Rainfall<br />
Discharge<br />
800<br />
700<br />
600<br />
500<br />
400<br />
300<br />
200<br />
100<br />
Mean river discharge (m3/sec)<br />
0<br />
Oct Nov Dec Jan Feb Mar Apr May<br />
1998 1999<br />
0<br />
Figure S3. Total rainfall at Senga Bay station and mean Linthipe river<br />
discharge from October 1998 to April 1999.<br />
Table S1b. Visual censuses at 2 m, 6 m and 10 m depth at Nakantenga exposed (Nex) site.<br />
Month Oct-98 Dec-98 Jan-99 Apr-99 May-99<br />
Species name Depth (m) 2 6 10 2 6 10 2 6 10 2 6 10 2 6 10<br />
Pseudotropheus zebra red dorsal 2 6 68 0 11 77 2 10 39 2 8 38 3 9 11<br />
Pseudotropheus zebra yellow throat 15 8 0 13 6 0 19 6 0 18 4 0 17 7 0<br />
Pseudotropheus zebra black dorsal 0 2 3 0 0 1 0 0 3 0 2 3 0 3 3<br />
Pseudotropheus barlowi 0 9 3 0 11 1 0 4 1 0 9 1 0 6 3<br />
Pseudotropheus tropheops lilac maleri 4 2 0 4 1 0 4 1 0 8 1 0 5 1 0<br />
Pseudotropheus tropheops maleri blue 4 0 0 2 0 0 1 0 0 1 0 0 2 0 0<br />
Pseudotropheus tropheops orange chest 10 1 2 6 2 1 7 1 0 1 1 0 6 0 0<br />
Pseudotropheus williamsi 2 0 0 1 0 0 1 0 0 1 0 0 2 0 0<br />
Pseudotropheus elongatus brown 0 0 0 0 0 7 0 1 7 0 1 2 0 0 1<br />
Pseudotropheus aggressive yellow head 11 19 0 24 44 0 0 50 1 35 44 5 60 35 6<br />
Pseudotropheus aggressive blue 4 0 0 6 0 0 10 0 0 8 0 0 9 0 0<br />
Pseudotropheus aggressive zebra 15 0 0 6 1 0 30 4 0 4 1 0 5 0 0<br />
Pseudotropheus burrower 0 21 7 0 11 10 1 12 12 4 10 0 0 15 10<br />
Melanochromis auratus 2 3 2 3 2 1 2 8 8 8 2 1 5 2 0<br />
Melanochromis vermivorous 0 0 0 0 4 0 1 7 0 0 1 0 0 0 0<br />
Melanochromis melanopterus 3 5 3 0 0 0 0 0 1 1 0 3 0 2 1<br />
Melanochromis crabro 0 0 0 0 0 0 0 0 1 0 0 0 0 0 0<br />
Petrotilapia yellow chin 4 0 0 4 0 0 2 0 0 3 0 0 2 0 0<br />
Petrotilapia genalutea 2 0 0 3 0 0 2 1 0 2 0 0 2 0 0<br />
Petrotilapia fuscous 5 3 9 5 4 5 2 3 9 2 3 4 2 4 1<br />
Labidochromis vellicans 0 0 0 2 1 0 4 4 0 3 2 0 1 2 0<br />
Labidochromis pallidus 2 3 5 3 2 3 3 3 3 4 2 0 3 1 1<br />
Labeotropheus fuelleborni 6 0 2 6 2 2 5 1 0 8 0 5 9 0 0<br />
Labeotropheus trewavasae 1 0 1 2 1 0 0 0 1 0 0 0 0 1 0<br />
Genyochromis mento 0 2 1 0 0 1 1 1 1 0 1 0 0 1 0<br />
Aulonocara gold 0 0 0 0 1 0 0 0 1 0 0 0 0 0 2<br />
Protomelas taeniolatus 2 1 4 0 0 2 0 0 3 0 3 5 0 0 0<br />
Territorial Total 94 85 110 90 104 111 97 117 91 113 95 67 133 89 39<br />
235
Visual censuses<br />
It should be kept in mind that censuses were done exactly at the same place within<br />
each site. Variations in relative abundance <strong>of</strong> species were observed among months along the<br />
rainy season. At Nakantenga sheltered (Nsh) site (Table S1a), Ps. zebra 'red dorsal' tended to<br />
be more abundant at 6 m and especially at 10 m during the rainy season. Ps. zebra 'black<br />
dorsal' was also more abundant at 6 m during the rainy season. <strong>The</strong> same increasing trends at<br />
10 m were noticed for Ps. elongatus 'brown' and Petrotilapia fuscous, whereas Ps. barlowi<br />
abundance decreased at 10 m. Ps. 'aggressive yellow head' tended to be more abundant at 2 m<br />
but less at 6 and 10 m during the rainy months. However, diversity and abundance variations<br />
<strong>of</strong> species among months were not significant at any depth (one way repeated measures<br />
ANOVA, F=0.7 p=0.593 for 2m, F=0.653 p=0.626 for 6 m and F=0.697 p= 0.597 for 10 m<br />
depth).<br />
Table S1a. Visual censuses at 2 m, 6 m and 10 m depth at Nakantenga sheltered (Nsh) site.<br />
Month Oct-98 Dec-98 Jan-99 Apr-99 May-99<br />
Species name Depth (m) 2 6 10 2 6 10 2 6 10 2 6 10 2 6 10<br />
Pseudotropheus zebra 'red dorsal' 2 10 8 0 5 3 1 20 4 2 20 38 1 8 18<br />
Pseudotropheus zebra 'yellow throat' 8 0 0 14 0 0 15 0 0 22 0 0 13 0 0<br />
Pseudotropheus zebra 'black dorsal' 2 2 3 0 1 4 0 3 5 0 7 3 0 5 4<br />
Pseudotropheus barlowi 0 6 2 0 5 4 0 4 2 0 5 1 0 5 0<br />
Pseudotropheus tropheops 'lilac maleri' 7 0 0 3 1 0 4 1 0 3 0 0 3 0 0<br />
Pseudotropheus tropheops 'orange chest' 0 0 0 0 0 0 0 0 0 0 1 0 0 3 0<br />
Pseudotropheus williamsi 1 0 0 0 0 0 1 0 0 1 0 0 0 0 0<br />
Pseudotropheus elongatus 'brown' 1 1 0 2 0 0 0 6 1 1 1 2 0 4 5<br />
Pseudotropheus 'aggressive yellow head' 3 31 11 0 22 9 3 9 7 5 8 0 8 15 0<br />
Pseudotropheus 'aggressive zebra' 21 0 0 34 0 0 36 1 0 26 0 0 38 0 0<br />
Pseudotropheus burrower 10 15 14 5 18 7 6 23 13 6 16 5 4 16 10<br />
Melanochromis auratus 3 2 1 2 0 0 2 2 2 2 1 1 1 3 3<br />
Melanochromis vermivorous 0 0 0 4 0 0 3 3 0 2 1 0 1 0 0<br />
Melanochromis melanopterus 2 2 2 0 0 0 1 1 0 0 0 2 1 0 2<br />
Petrotilapia 'yellow chin' 0 0 0 1 0 0 1 0 0 1 0 0 3 0 0<br />
Petrotilapia genalutea 0 0 0 1 0 0 1 0 0 3 0 0 3 0 0<br />
Petrotilapia 'fuscous' 0 2 2 2 0 0 1 3 1 1 2 4 1 4 10<br />
Labidochromis vellicans 0 0 0 3 0 0 3 0 0 3 0 0 2 2 1<br />
Labidochromis pallidus 3 3 3 3 0 0 4 2 1 5 1 5 4 3 4<br />
Labeotropheus fuelleborni 1 0 0 1 0 0 1 0 0 3 0 0 1 0 0<br />
Labeotropheus trewavasae 1 1 0 1 0 0 0 1 0 1 0 0 0 1 0<br />
Genyochromis mento 1 1 0 2 0 0 1 0 0 1 1 0 1 2 0<br />
Aulonocara 'gold' 0 0 0 0 0 0 0 0 1 0 0 0 0 0 0<br />
Protomelas taeniolatus 0 0 3 0 0 0 0 0 0 0 7 5 0 0 0<br />
Territorial Total 66 76 49 78 52 27 84 79 37 88 71 66 85 71 57<br />
At Nakantenga exposed (Nex) site (Table S1b), Ps. zebra 'red dorsal' showed an opposite<br />
trend, being less abundant at 10 m during the rainy season, like Ps. tropheops 'orange chest'<br />
and Petrotilapia fuscous, which was also less abundant at 2 m. Labeotropheus fuelleborni and<br />
Melanochromis auratus tended to be more abundant at 2 m during the rainy months. Ps.<br />
'aggressive yellow head' abundance tended to increase at every depth during the rainy season.<br />
236
Table S2b. Visual censuses at 2 m, 6 m and 10 m depth at Thumby west T8 site.<br />
Month Dec-98 Jan-99 Feb-99 Mar-99 Apr-99 May-99<br />
Species name Depth (m) 2 6 10 2 6 10 2 6 10 2 6 10 2 6 10 2 6 10<br />
Pseudotropheus zebra 16 1 2 12 15 4 19 14 4 16 12 4 9 6 2 13 12 3<br />
Pseudotropheus zebra callainos 24 9 0 1 1 0 24 1 0 18 1 0 20 0 0 15 1 0<br />
Pseudotropheus aurora 0 0 2 9 8 2 0 11 3 0 12 3 0 8 2 0 10 3<br />
Pseudotropheus heteropictus 0 0 9 0 0 12 0 0 13 0 1 15 0 2 14 0 1 15<br />
Pseudotropheus livingstonii 0 0 0 0 0 1 0 0 0 0 0 0 0 0 0 0 0 0<br />
Pseudotropheus tropheops lilac 0 2 0 0 0 0 1 0 0 1 0 0 1 0 0 0 0 0<br />
Pseudotropheus tropheops red cheek 13 14 0 2 3 0 12 1 0 16 2 0 14 2 0 11 1 0<br />
Pseudotropheus tropheops orange chest 9 6 8 14 16 6 13 15 11 8 13 12 7 16 14 12 13 10<br />
Pseudotropheus tropheops intermediate 0 0 6 6 6 8 1 10 8 0 9 8 0 11 9 0 10 9<br />
Pseudotropheus tropheops gracilior 0 0 0 0 0 1 0 0 0 0 0 0 0 0 0 0 0 0<br />
Pseudotropheus williamsi 0 1 0 0 0 0 0 0 0 0 0 0 0 0 0 0 0 0<br />
Pseudotropheus elongatus brown 0 0 0 1 0 0 0 0 0 0 0 0 0 0 0 0 0 0<br />
Pseudotropheus elongatus slab 0 0 0 0 1 1 0 0 0 0 0 0 0 0 0 0 1 0<br />
Pseudotropheus aggressive brown 18 0 0 0 0 0 17 0 0 21 0 0 16 0 0 15 0 0<br />
Pseudotropheus tiny 0 0 4 0 0 1 0 0 4 0 0 5 0 0 5 0 0 5<br />
Melanochromis auratus 1 0 3 0 1 1 2 3 2 3 1 2 1 2 2 2 1 1<br />
Melanochromis melanopterus 0 0 0 0 0 0 0 1 0 0 0 1 0 0 0 0 0 0<br />
Melanochromis vermivorous 8 0 0 0 0 0 10 0 0 8 0 0 11 0 0 10 0 0<br />
Melanochromis joanjohnsonae 5 0 0 0 0 0 3 0 0 3 0 0 4 0 0 3 0 0<br />
Melanochromis crabro 0 0 1 0 0 0 0 0 0 0 0 0 0 0 0 0 0 0<br />
Petrotilapia mumbo blue 2 0 0 0 0 0 3 0 0 3 0 0 3 0 0 4 0 0<br />
Petrotilapia genalutea 3 6 0 0 0 0 2 0 0 3 0 0 6 0 0 2 0 0<br />
Petrotilapia nigra 1 0 0 6 4 3 2 8 1 1 5 1 2 7 2 1 3 1<br />
Labidochromis vellicans 0 0 0 0 1 0 5 0 0 3 1 0 4 2 0 3 0 0<br />
Labidochromis freibergi 0 2 0 0 0 0 0 0 0 0 0 0 0 0 0 0 0 0<br />
Labidochromis gigas 0 0 3 2 3 2 2 3 4 0 3 4 0 2 3 1 6 3<br />
Labidochromis blue bar 0 19 0 0 0 0 0 0 0 0 0 0 0 0 0 0 0 0<br />
Cynotilapia afra 13 1 21 19 26 26 26 26 24 20 24 26 8 5 6 28 28 21<br />
Labeotropheus fuelleborni 10 1 0 1 2 0 13 0 0 11 2 0 16 1 0 16 0 0<br />
Labeotropheus trewavasae 0 0 0 1 1 0 1 0 0 2 1 0 1 1 0 0 1 0<br />
Genyochromis mento 0 2 0 0 0 0 2 1 1 1 1 1 1 1 1 1 1 1<br />
Aulonocara blue 0 1 0 2 0 1 0 2 5 0 1 3 0 1 3 0 2 3<br />
Protomelas taeniolatus 0 65 0 1 2 1 0 3 0 0 3 1 0 2 1 0 0 1<br />
Territorial Total 123 205 59 77 90 69 158 99 80 138 92 86 124 69 64 137 91 76<br />
237
Again, the observed variations in species diversity and abundance were not significant at any<br />
depth (one way repeated measures ANOVA, F=0.453 p=0.770 for 2m, F=0.816 p=0.518 for 6<br />
m and F=1.220 p= 0.307 for 10 m depth).<br />
At Thumbi West T13 site (Table S2a), some species tended to be more abundant during the<br />
rainy season at 2 m (Ps. callainos, Melanochromis vermivorus, Labidochromis vellicans, L.<br />
fuelleborni), 6 m (L. fuelleborni) and 10 m (Ps. tropheops 'orange chest'). Ps. tropheops<br />
'intermediate' was less abundant at 6 m during the rainy months. However, these species<br />
diversity and abundance variations among months were not significant at any depth (one way<br />
repeated measures ANOVA, F=1.301 p= 0.265 for 2m, F=0.757 p=0.582 for 6 m and F=0.833<br />
p=0.527 for 10 m depth).<br />
Table S2a. Visual censuses at 2 m, 6 m and 10 m depth at Thumbi west T13 site.<br />
Month Dec-98 Jan-99 Feb-99 Mar-99 Apr-99 May-99<br />
Species name Depth (m) 2 6 10 2 6 10 2 6 10 2 6 10 2 6 10 2 6 10<br />
Pseudotropheus zebra 12 30 37 21 27 28 16 31 21 24 38 33 16 36 26 20 35 38<br />
Pseudotropheus zebra callainos 35 20 3 33 27 4 41 17 1 57 25 3 54 24 0 46 15 2<br />
Pseudotropheus aurora 0 1 0 0 0 0 0 0 0 0 0 0 0 0 0 0 0 0<br />
Pseudotropheus heteropictus 0 2 2 0 0 2 0 0 1 0 0 3 0 0 2 0 0 2<br />
Pseudotropheus tropheops lilac 0 0 0 0 0 0 1 0 0 1 0 0 1 0 0 1 0 0<br />
Pseudotropheus tropheops red cheek 4 4 0 4 7 1 4 5 0 6 7 0 4 4 0 3 4 0<br />
Pseudotropheus tropheops orange chest 2 6 8 5 13 8 3 16 9 5 13 10 4 17 12 4 11 13<br />
Pseudotropheus tropheops intermediate 0 9 5 0 3 10 0 4 8 0 2 8 0 2 7 0 1 7<br />
Pseudotropheus elongatus brown 0 0 0 0 0 0 0 0 0 0 0 0 0 0 0 0 0 1<br />
Pseudotropheus elongatus slab 0 0 0 0 1 1 0 1 3 0 2 3 0 1 3 0 1 1<br />
Pseudotropheus aggressive blue 10 0 0 6 0 0 6 0 0 6 0 0 6 0 0 5 0 0<br />
Pseudotropheus aggressive brown 32 0 0 19 0 0 26 0 0 19 0 0 23 0 0 22 0 0<br />
Pseudotropheus tiny 0 3 2 0 0 2 0 0 4 0 1 3 0 0 6 0 0 4<br />
Melanochromis auratus 2 2 3 3 2 2 0 1 2 1 2 1 2 2 3 2 3 3<br />
Melanochromis melanopterus 2 1 4 0 0 0 0 0 0 0 0 0 0 0 0 0 0 0<br />
Melanochromis chipokae 0 0 0 0 0 0 0 0 1 0 0 0 1 0 0 0 0 0<br />
Melanochromis vermivorous 8 2 0 14 3 0 21 1 0 10 3 2 12 2 1 16 4 1<br />
Melanochromis parallelus 3 2 1 2 3 2 3 2 3 2 0 1 2 3 1 2 1 2<br />
Melanochromis joanjohnsonae 6 0 0 4 1 0 6 0 0 2 0 0 5 0 0 5 0 0<br />
Petrotilapia mumbo blue 1 0 0 1 0 0 1 0 0 1 0 0 2 0 0 1 0 0<br />
Petrotilapia tridentiger 1 0 0 0 0 0 1 0 0 0 0 0 0 0 0 0 0 0<br />
Petrotilapia genalutea 2 0 0 4 0 0 1 0 0 1 0 0 2 0 0 1 0 0<br />
Petrotilapia nigra 1 1 2 0 3 3 1 6 2 1 2 2 0 4 3 0 4 2<br />
Labidochromis vellicans 1 2 1 4 4 4 2 4 1 5 3 0 7 2 0 5 3 1<br />
Cynotilapia afra 1 9 0 5 5 0 3 5 0 4 6 0 5 6 0 10 7 0<br />
Labeotropheus fuelleborni 2 4 0 8 18 0 16 13 0 11 15 0 21 18 0 14 11 0<br />
Labeotropheus trewavasae 1 2 1 1 2 3 2 4 2 1 3 4 2 3 6 2 4 4<br />
Genyochromis mento 0 0 2 0 0 0 1 1 1 1 1 0 2 1 3 1 2 1<br />
Aulonocara blue 0 3 0 0 0 2 0 1 1 0 0 1 0 0 1 0 0 2<br />
Protomelas taeniolatus 0 0 0 0 0 0 0 0 0 0 0 0 0 0 0 2 0 0<br />
Territorial Total 126 103 71 134 119 72 155 112 60 158 123 74 171 125 74 162 106 84<br />
At Thumbi West T8 site (Table S2b), Ps. callainos and Ps. tropheops 'red cheek' were found<br />
less abundant at 6 m during the rainy season. <strong>The</strong> opposite tendency was observed at 2 m for<br />
Labidochromis vellicans and L. fuelleborni, and at 6 m for Ps. aurora and Ps. tropheops<br />
238
'orange chest' . This last species was also more abundant at 10 m. As for T13 site, species<br />
diversity and abundance variations among months were not significant at any depth at T8 (one<br />
way repeated measures ANOVA, F=1.958 p= 0.086 for 2m, F=1.175 p=0.322 for 6 m and<br />
F=1.262 p=0.282 for 10 m depth).<br />
Life history traits and condition<br />
Life history traits such as fecundity, egg size and size at maturity require large <strong>fish</strong><br />
samples to be determined. Between months comparisons within each site were not possible<br />
owing to insufficient sample numbers. As a consequence, they were compared only for the<br />
few species abundant enough and represented at both Nakantenga and Thumbi sites. Also<br />
owing to sample number, Nex and Nsh sites were pooled as were T13 and T8, for the<br />
Nakantenga versus Thumbi west comparisons <strong>of</strong> life history traits among populations.<br />
Potential condition variations were investigated for every species abundant enough at every<br />
sampled months.<br />
Species present at both Nakantenga and Thumbi west sites<br />
To be accurate, length at maturity has to be determined at the height <strong>of</strong> the breeding<br />
season. Determination <strong>of</strong> the breeding season was not possible as we did not sample during a<br />
complete annual cycle. However, most <strong>of</strong> the mbuna, including the two species below, breed<br />
throughout the year with a peak in August to October and one in February to March (Marsh et<br />
al. 1986). Our sampling period from October 1998 to May 1999, included part <strong>of</strong> the first<br />
breeding peak and completely the second one. <strong>The</strong>refore, length at maturity were estimated<br />
from the complete sampling period.<br />
Labeotropheus fuelleborni<br />
<strong>The</strong> size at maturity <strong>of</strong> L. fuelleborni was slightly higher at Nakantenga (66 mm) than<br />
at Thumbi west (62 mm) (Figure S5).<br />
100<br />
% mature females<br />
50<br />
0<br />
Nakantenga<br />
Thumby<br />
52 57 62 67 72 77 82 87 92 97<br />
Standard length (mm)<br />
Figure S5. Mean length at first sexual maturity for Labeotropheus<br />
fuelleborni at Nakantenga and Thumbi west sites.<br />
239
Condition factor<br />
3,9<br />
3,8<br />
3,7<br />
3,6<br />
3,5<br />
3,4<br />
3,3<br />
CF<br />
Chloro a<br />
Secchi<br />
16<br />
14<br />
12<br />
10<br />
8<br />
6<br />
4<br />
2<br />
0<br />
Chlorophyll a biomass (ug/cm²)<br />
Secchi disk depth (m)<br />
Oct-98<br />
Nov-98<br />
Dec-98<br />
Jan-99<br />
Feb-99<br />
Mar-99<br />
Apr-99<br />
May-99<br />
a 30 24 27 25 20 5 19 32<br />
Condition factor<br />
3,9<br />
3,8<br />
3,7<br />
3,6<br />
3,5<br />
3,4<br />
3,3<br />
CF<br />
Secchi<br />
Chloro a<br />
18<br />
16<br />
14<br />
12<br />
10<br />
8<br />
6<br />
4<br />
2<br />
0<br />
Chlorophyll a biomass (ug/cm²)<br />
Seeci disk depth (m)<br />
Oct-98<br />
Nov-98<br />
Dec-98<br />
Jan-99<br />
Feb-99<br />
Mar-99<br />
Apr-99<br />
May-99<br />
b 37 18 50 23 22 24 54 32<br />
Figure S6. Monthly progression <strong>of</strong> Labeotropheus fuelleborni mean<br />
condition factor, Secchi disk measurements (m) and benthic chlorophyll<br />
a biomass (µg/cm²) at Nakantenga sites (a) and Thumby west sites (b).<br />
Numbers below the months are the corresponding sample numbers.<br />
240
As the relative fecundity was not correlated to the body weight for L. fuelleborni at<br />
either sites (Pearson correlation r=-0.225, p=0.506 and r=-0.298, p=0.140 for Nakantenga and<br />
Thumbi populations, respectively), comparison <strong>of</strong> fecundity were done on relative fecundity.<br />
<strong>The</strong>re was no significant difference (Mann-Whitney rank sum test: T= 221, p=0.702) <strong>of</strong><br />
relative fecundity between the populations <strong>of</strong> Nakantenga (N=11, mean relative<br />
fecundity=1725 ± 405 SD) and Thumbi west (N=26, mean relative fecundity=1675 ± 252<br />
SD).<br />
<strong>The</strong> GSI threshold above which oocyte weight did no longer increase significantly was<br />
3.8% for L. fuelleborni. At Nakantenga sites, only two females had a GSI superior to 3.8%,<br />
giving a mean oocyte weight <strong>of</strong> 31.9 mg ± 2.69. At Thumbi west sites, 4 females had a GSI<br />
superior to 3.8%, giving a mean oocyte weight <strong>of</strong> 29.5 mg ± 5.21. Owing to the low sample<br />
number at Nakantenga, statistical comparison was not possible, but the weak difference was<br />
likely to be insignificant.<br />
Analysis <strong>of</strong> monthly progression <strong>of</strong> mean condition factor (CF) were carried out<br />
separately at Nakantenga and Thumbi sites.<br />
At Nakantenga, no correlation was observed between CF and length <strong>of</strong> <strong>fish</strong> (Pearson<br />
correlation p>0.05), allowing to test for between months (October to May), sites (Nex and<br />
Nsh) and sex (females and males) differences using a general linear model with month, site<br />
and sex as factors and CF as dependant variable. <strong>The</strong> monthly progression <strong>of</strong> the mean<br />
condition factor, secchi disk measurements and benthic chlorophyll a biomass are presented in<br />
Figure S6a. <strong>The</strong> significant factors were month (F 7,156 =4.673, p
At Thumbi west, no correlation was observed between CF and length <strong>of</strong> <strong>fish</strong> (Pearson<br />
correlation p>0.05), allowing to search for between months, sites and sex differences. None <strong>of</strong><br />
the factor had a significant effect on the mean condition factor, indicating that the rainy<br />
season did not significantly influence the condition <strong>of</strong> L. fuelleborni at Thumbi west. <strong>The</strong><br />
monthly progression <strong>of</strong> the mean condition factor, Secchi disk measurements and benthic<br />
chlorophyll a biomass are presented in Figure S6b. No significant correlation was found<br />
between the mean CF, Secchi disk measurements and the chlorophyll a biomass (Pearson<br />
correlation p>0.05).<br />
Pseudotropheus tropheops 'orange chest'<br />
<strong>The</strong> mean size at maturity <strong>of</strong> Ps. tropheops 'orange chest' was the same (65 mm) in<br />
Nakantenga and Thumbi west sites (Figure S7).<br />
100<br />
% mature females<br />
50<br />
0<br />
Nakantenga<br />
Thumby<br />
47 52 57 62 67 72 77 82 87 92 97<br />
Standard length (mm)<br />
Figure S7. Mean length at first sexual maturity for Pseudotropheus<br />
tropheops 'orange chest' at Nakantenga and Thumbi west sites.<br />
As the relative fecundity was not correlated to the body weight for Ps. tropheops<br />
'orange chest' at either sites (Pearson correlation r=-0.21, p=0.489 and r=-0.28, p=0.134 for<br />
Nakantenga and Thumbi populations, respectively), comparisons <strong>of</strong> fecundity were done on<br />
relative fecundity. <strong>The</strong>re was no significant difference (t-test: t= 1.889, 4 df, p=0.066) <strong>of</strong><br />
relative fecundity between the populations <strong>of</strong> Nakantenga (N=13, mean relative<br />
fecundity=2451 ± 495 SD) and Thumbi west (N=30, mean relative fecundity=2183 ± 395<br />
SD).<br />
<strong>The</strong> GSI threshold above which oocyte weight did no longer increase significantly was<br />
4% for Ps. tropheops 'orange chest'. At Nakantenga sites, 7 females had a GSI superior to<br />
4%, giving a mean oocyte weight <strong>of</strong> 17.7 mg ± 2.73. At Thumbi west sites, 9 females had a<br />
GSI superior to 4%, giving a mean oocyte weight <strong>of</strong> 17.4 mg ± 2.68. <strong>The</strong> difference in oocyte<br />
weight between the females <strong>of</strong> two sites was not significant (t-test t=-0.534, 14 df, p=0.602).<br />
242
4,0<br />
16<br />
Condition factor<br />
3,9<br />
3,8<br />
3,7<br />
3,6<br />
3,5<br />
3,4<br />
3,3<br />
3,2<br />
3,1<br />
3,0<br />
CF<br />
Secchi<br />
Chloro a<br />
14<br />
12<br />
10<br />
8<br />
6<br />
4<br />
2<br />
0<br />
Chlorophyll a biomass (ug/cm²)<br />
Secchi disk depth (m)<br />
a<br />
Oct-98<br />
Nov-98<br />
Dec-98<br />
Jan-99<br />
21 36 19 39 34 13 27 27<br />
Feb-99<br />
Mar-99<br />
Apr-99<br />
May-99<br />
4,0<br />
3,9<br />
3,8<br />
3,7<br />
3,6<br />
3,5<br />
3,4<br />
3,3<br />
3,2<br />
3,1<br />
3,0<br />
CF<br />
Secchi<br />
Chloro a<br />
Females<br />
16<br />
14<br />
12<br />
10<br />
8<br />
6<br />
4<br />
2<br />
0<br />
Oct-98<br />
Nov-98<br />
Dec-98<br />
Jan-99<br />
Feb-99<br />
Mar-99<br />
Apr-99<br />
May-99<br />
b 8 16 4 19 10 8 17 10<br />
4,0<br />
3,9<br />
3,8<br />
3,7<br />
3,6<br />
3,5<br />
3,4<br />
3,3<br />
3,2<br />
3,1<br />
3,0<br />
CF<br />
Secchi<br />
Chloro a<br />
Males<br />
16<br />
14<br />
12<br />
10<br />
8<br />
6<br />
4<br />
2<br />
0<br />
Oct-98<br />
Nov-98<br />
Dec-98<br />
Jan-99<br />
Feb-99<br />
Mar-99<br />
Apr-99<br />
May-99<br />
c 13 20 15 20 24 5 10 17<br />
Figure S8. Monthly progression <strong>of</strong> Pseudotropheus tropheops 'orange chest' mean<br />
condition factor, Secchi disk measurements (m) and benthic chlorophyll a<br />
biomass (µg/cm²) at Nakantenga sites for females and males pooled (a),<br />
females only (b) and males only (c). Numbers below the months are the<br />
corresponding sample numbers.<br />
243
Analysis <strong>of</strong> monthly progression <strong>of</strong> condition factor (CF) were carried out separately<br />
at Nakantenga and Thumbi sites.<br />
Nakantenga: <strong>The</strong> monthly progression <strong>of</strong> the mean condition factor, Secchi disk<br />
measurements and benthic chlorophyll a biomass are presented in Figure S8a. No correlation<br />
was observed between CF and length <strong>of</strong> <strong>fish</strong> (Pearson correlation p>0.05), allowing to test for<br />
between months (October to May), sites (Nex and Nsh) and sex (females and males)<br />
differences using a general linear model with month, site and sex as factors and CF as<br />
dependant variable. <strong>The</strong> only significant factors was month (F 7,189 =8.533, p0.05). Despite their similar monthly progression (Figure S8c), there<br />
was no significant correlation between the mean CF and Secchi disk measurements for males.<br />
Mean CF and chlorophyll a biomass were not correlated either.<br />
Once separated, both females and males showed significant differences <strong>of</strong> mean condition<br />
factor among months (F 7,79 =3.061, p=0.007 for females and F 7,110 =9.409, p
Condition factor<br />
3,7<br />
3,6<br />
3,5<br />
3,4<br />
3,3<br />
3,2<br />
3,1<br />
3<br />
CF<br />
Secchi disk<br />
Chloro a<br />
18<br />
16<br />
14<br />
12<br />
10<br />
8<br />
6<br />
4<br />
2<br />
Oct-98<br />
Nov-98<br />
Dec-98<br />
Jan-99<br />
Feb-99<br />
Mar-99<br />
Apr-99<br />
May-99<br />
Chlorophyll a biomass (ug/cm²)<br />
Secchi disk depth (m)<br />
35 70 121 70 67 71 88<br />
Figure S9. Monthly progression <strong>of</strong> Pseudotropheus tropheops 'orange chest'<br />
mean condition factor, Secchi disk measurements (m) and benthic chlorophyll<br />
a biomass (µg/cm²) at Thumby west sites. Numbers below the months are the<br />
corresponding sample numbers.<br />
245
At Thumbi west, no correlation was observed between CF and length <strong>of</strong> <strong>fish</strong> (Pearson<br />
correlation p>0.05), allowing to search for between months, sites and sex differences. <strong>The</strong><br />
only factor with a significant effect was month (F 7,496 =24.801, p0.05), allowing to test for between months (October to May), sites (Nex and Nsh) and sex<br />
(females and males) differences using a general linear model with month, site and sex as<br />
factors and CF as dependant variable. All three factors had a significant effect and interactions<br />
existed between all <strong>of</strong> them. <strong>The</strong>refore, sites and sex had to be separated in analysis to test for<br />
between months differences.<br />
At Nakantenga sheltered site (Nsh), there were significant monthly differences <strong>of</strong> CF for both<br />
females (Figure S10b, F 7,499 =22.978, p
Condition factor<br />
3,8<br />
3,6<br />
3,4<br />
3,2<br />
3,0<br />
2,8<br />
2,6<br />
Oct-98<br />
CF<br />
Secchi<br />
Chloro a<br />
Nov-98<br />
Dec-98<br />
Jan-99<br />
a 566 342 362 1037 216 419 381 333<br />
Feb-99<br />
Mar-99<br />
Apr-99<br />
May-99<br />
16<br />
14<br />
12<br />
10<br />
8<br />
6<br />
4<br />
2<br />
0<br />
Chlorophyll a biomass (ug/cm²)<br />
Secchi disk depth (m)<br />
3,8<br />
Nsh females<br />
16<br />
3,8<br />
Nsh males<br />
16<br />
3,6<br />
3,4<br />
14<br />
12<br />
10<br />
3,6<br />
3,4<br />
14<br />
12<br />
10<br />
3,2<br />
8<br />
3,2<br />
8<br />
3,0<br />
2,8<br />
6<br />
4<br />
2<br />
3,0<br />
2,8<br />
6<br />
4<br />
2<br />
2,6<br />
0<br />
2,6<br />
0<br />
Oct-98<br />
Nov-98<br />
Dec-98<br />
Jan-99<br />
Feb-99<br />
Mar-99<br />
Apr-99<br />
May-99<br />
Oct-98<br />
Nov-98<br />
Dec-98<br />
Jan-99<br />
Feb-99<br />
Mar-99<br />
Apr-99<br />
May-99<br />
b<br />
95 36 76 33 48 22 186 11<br />
c<br />
165 243 281 233 89 37 108 100<br />
3,8<br />
3,6<br />
3,4<br />
Nex females<br />
16<br />
14<br />
12<br />
10<br />
3,8<br />
3,6<br />
3,4<br />
Nex males<br />
16<br />
14<br />
12<br />
10<br />
3,2<br />
8<br />
3,2<br />
8<br />
3,0<br />
2,8<br />
6<br />
4<br />
2<br />
3,0<br />
2,8<br />
6<br />
4<br />
2<br />
2,6<br />
0<br />
2,6<br />
0<br />
Oct-98<br />
Nov-98<br />
Dec-98<br />
Jan-99<br />
Feb-99<br />
Mar-99<br />
Apr-99<br />
May-99<br />
Oct-98<br />
Nov-98<br />
Dec-98<br />
Jan-99<br />
Feb-99<br />
Mar-99<br />
Apr-99<br />
May-99<br />
d<br />
24 8 2 357 12 202 43 78<br />
e<br />
282 55 3 414 67 158 44 144<br />
Figure S10. Monthly progression <strong>of</strong> Pseudotropheus zebra 'red dorsal' mean condition factor,<br />
Secchi disk measurements (m) and benthic chlorophyll a biomass (µg/cm²) at Nakantenga for<br />
both sites, females and males pooled (a), at Nakantenga sheltered (Nsh) for females only (b),<br />
males only (c) and at Nakantenga exposed (Nex) for females only (d), males only (e). Numbers<br />
below the months are the corresponding sample numbers.<br />
247
At Nakantenga exposed site (Nex), there were also significant monthly differences <strong>of</strong> CF for<br />
both females (Figure S10d, F 7,718 =13.742, p
Condition factor<br />
3,8<br />
3,7<br />
3,6<br />
3,5<br />
3,4<br />
3,3<br />
CF<br />
Secchi<br />
Chloro a<br />
16<br />
14<br />
12<br />
10<br />
8<br />
6<br />
4<br />
2<br />
Chlorophyll a biomass (ug/cm²)<br />
Secchi disk depth (m)<br />
3,2<br />
0<br />
Oct-98<br />
Nov-98<br />
Dec-98<br />
Jan-99<br />
Feb-99<br />
Mar-99<br />
Apr-99<br />
May-99<br />
4 23 32 37 26 18 42 63<br />
Figure S11. Monthly progression <strong>of</strong> Pseudotropheus zebra 'yellow throat'<br />
mean condition factor, Secchi disk measurements (m) and benthic<br />
chlorophyll a biomass (µg/cm²) at Nakantenga for both sites. Numbers<br />
below the months are the corresponding sample numbers.<br />
4,1<br />
16<br />
Condition factor<br />
4,0<br />
3,9<br />
3,8<br />
3,7<br />
3,6<br />
3,5<br />
3,4<br />
3,3<br />
3,2<br />
CF<br />
Secchi<br />
Chloro a<br />
14<br />
12<br />
10<br />
8<br />
6<br />
4<br />
2<br />
0<br />
Oct-98<br />
Nov-98<br />
Dec-98<br />
Jan-99<br />
Feb-99<br />
Mar-99<br />
Apr-99<br />
Chlorophylla biomass (ug/cm²)<br />
Secchi disk depth (m)<br />
May-99<br />
57 35 11 9 16 21 21 17<br />
Figure S12. Monthly progression <strong>of</strong> Pseudotropheus zebra 'black dorsal'<br />
mean condition factor, Secchi disk measurements (m) and benthic<br />
chlorophyll a biomass (µg/cm²) at Nakantenga for both sites. Numbers<br />
below the months are the corresponding sample numbers.<br />
249
Pseudotropheus zebra 'black dorsal'<br />
<strong>The</strong> monthly progression <strong>of</strong> Ps. zebra 'black dorsal' mean condition factor, Secchi<br />
disk measurements and benthic chlorophyll a biomass at Nakantenga sites are presented in<br />
Figure S12. No correlation was observed between CF and length <strong>of</strong> <strong>fish</strong> (Pearson correlation<br />
p>0.05), allowing to test for between months (October to May), sites (Nex and Nsh) and sex<br />
(females and males) differences using a general linear model with month, site and sex as<br />
factors and CF as dependant variable. <strong>The</strong> only factor with a significant effect was month<br />
(F 7,157 =6.220, p
Condition factor<br />
4,0<br />
3,9<br />
3,8<br />
3,7<br />
3,6<br />
3,5<br />
3,4<br />
3,3<br />
3,2<br />
CF<br />
Secchi<br />
Chloro a<br />
16<br />
14<br />
12<br />
10<br />
8<br />
6<br />
4<br />
2<br />
Chlorophyll a biomass (ug/cm²)<br />
Secchi disk depth (m)<br />
3,1<br />
0<br />
Oct-98<br />
Nov-98<br />
Dec-98<br />
Jan-99<br />
Feb-99<br />
Mar-99<br />
Apr-99<br />
May-99<br />
14 14 5 9 43 20 16 56<br />
Figure S13. Monthly progression <strong>of</strong> Petrotilapia 'fuscous' mean condition<br />
factor, Secchi disk measurements (m) and benthic chlorophyll a biomass<br />
(µg/cm²) at Nakantenga for both sites. Numbers below the months are the<br />
corresponding sample numbers.<br />
3,8<br />
16<br />
Condition factor<br />
3,7<br />
3,6<br />
3,5<br />
3,4<br />
3,3<br />
3,2<br />
3,1<br />
3,0<br />
2,9<br />
CF<br />
Secchi<br />
Chloro a<br />
14<br />
12<br />
10<br />
8<br />
6<br />
4<br />
2<br />
0<br />
Oct-98<br />
Nov-98<br />
Dec-98<br />
Jan-99<br />
Feb-99<br />
Mar-99<br />
Apr-99<br />
May-99<br />
Chlorophyll a biomass (ug/cm²)<br />
Secchi disk depth (m)<br />
38 29 4 25 52 85 42 22<br />
Figure S14. Monthly progression <strong>of</strong> Pseudotropheus barlowi mean condition<br />
factor, Secchi disk measurements (m) and benthic chlorophyll a biomass<br />
(µg/cm²) at Nakantenga for both sites. Numbers below the months are the<br />
corresponding sample numbers.<br />
251
versus February-May (Figure S13 and Table S7). Using these subsets, CF was significantly<br />
lower in February -May than in October- January (F 1,175 =46.847, p0.05).<br />
Pseudotropheus barlowi<br />
<strong>The</strong> monthly progression <strong>of</strong> Ps. barlowi mean condition factor, Secchi disk<br />
measurements and benthic chlorophyll a biomass at Nakantenga sites are presented in Figure<br />
S14. No correlation was observed between CF and length <strong>of</strong> <strong>fish</strong> (Pearson correlation<br />
p>0.05), allowing to test for between months (October to May), sites (Nex and Nsh) and sex<br />
(females and males) differences using a general linear model with month, site and sex as<br />
factors and CF as dependant variable. <strong>The</strong> only factor with a significant effect was month<br />
(F 7,271 =7.967, p
Condition factor<br />
4,0<br />
3,9<br />
3,8<br />
3,7<br />
3,6<br />
3,5<br />
3,4<br />
3,3<br />
CF<br />
Secchi<br />
Chloro a<br />
16<br />
14<br />
12<br />
10<br />
8<br />
6<br />
4<br />
2<br />
Chlorophyll a biomass (ug/cm²)<br />
Secchi disk depth (m)<br />
3,2<br />
0<br />
Oct-98<br />
Nov-98<br />
Dec-98<br />
Jan-99<br />
Feb-99<br />
Mar-99<br />
Apr-99<br />
May-99<br />
15 2 10 42 2 43 73<br />
Figure S15. Monthly progression <strong>of</strong> Pseudotropheus williamsi mean<br />
condition factor, Secchi disk measurements (m) and benthic chlorophyll a<br />
biomass (µg/cm²) at Nakantenga for both sites. Numbers below the months<br />
are the corresponding sample numbers.<br />
3,5<br />
16<br />
Condition factor<br />
3,4<br />
3,3<br />
3,2<br />
3,1<br />
3,0<br />
2,9<br />
2,8<br />
CF<br />
Secchi<br />
Chloro a<br />
14<br />
12<br />
10<br />
8<br />
6<br />
4<br />
2<br />
0<br />
Oct-98<br />
Nov-98<br />
Dec-98<br />
Jan-99<br />
Feb-99<br />
Mar-99<br />
Apr-99<br />
May-99<br />
Chlorophyll a biomass (ug/cm²)<br />
Secchi disk depth (m)<br />
13 2 40 33 9 1 10<br />
Figure S16. Monthly progression <strong>of</strong> Pseudotropheus 'aggressive zebra' mean<br />
condition factor, Secchi disk measurements (m) and benthic chlorophyll a<br />
biomass (µg/cm²) at Nakantenga for both sites. Numbers below the months<br />
are the corresponding sample numbers.<br />
253
<strong>The</strong> only month differing from the others was April, when mean condition factor was slightly<br />
lower. However, the temporal variations <strong>of</strong> the mean CF did not show any clear seasonal<br />
pattern (Figure S15) and season did not seem to have a marked effect on CF for this species.<br />
<strong>The</strong> mean CF was correlated neither with the Secchi disk measurements, nor the chlorophyll a<br />
biomass (Pearson correlation p>0.05).<br />
Pseudotropheus 'aggressive zebra'<br />
<strong>The</strong> monthly progression <strong>of</strong> Ps. 'aggressive zebra' mean condition factor, Secchi disk<br />
measurements and benthic chlorophyll a biomass at Nakantenga sites are presented in Figure<br />
S16. No correlation was observed between CF and length <strong>of</strong> <strong>fish</strong> (Pearson correlation<br />
p>0.05), allowing to test for between months, sites and sex differences using a general linear<br />
model with month, site and sex as factors and CF as dependant variable. Despite the fact that<br />
the mean condition factor tended to decrease along the rainy season from November to May,<br />
none <strong>of</strong> the factors had a significant effect indicating that the observed differences were not<br />
significant. <strong>The</strong> mean CF was correlated neither with the Secchi disk measurements, nor the<br />
chlorophyll a biomass (Pearson correlation p>0.05).<br />
Species present only at Thumbi west sites<br />
Pseudotropheus zebra<br />
<strong>The</strong> monthly progression <strong>of</strong> Ps. zebra 'red dorsal' mean condition factor, Secchi disk<br />
measurements and benthic chlorophyll a biomass at Thumbi west sites are presented in Figure<br />
S17a. No correlation was observed between CF and length <strong>of</strong> <strong>fish</strong> (Pearson correlation<br />
p>0.05), allowing to test for between months (October to May), sites (T13 and T13) and sex<br />
(females and males) differences using a general linear model with month, site and sex as<br />
factors and CF as dependant variable. All three factors had a significant effect and interactions<br />
existed between month and site, and between month and sex. <strong>The</strong>refore, sites and sex had to<br />
be separated in analysis to test for monthly differences.<br />
At Thumbi T13, there were significant monthly differences <strong>of</strong> CF for both females (Figure<br />
S17b, F 7,283 =3.96, p
Condition factor<br />
3,8<br />
3,7<br />
3,6<br />
3,5<br />
3,4<br />
3,3<br />
3,2<br />
3,1<br />
CF<br />
Secchi<br />
Chloro a<br />
20<br />
18<br />
16<br />
14<br />
12<br />
10<br />
8<br />
6<br />
4<br />
2<br />
Chlorophyll a biomass (ug/cm²)<br />
Secchi disk depth (m)<br />
3,0<br />
0<br />
Oct-98<br />
Nov-98<br />
Dec-98<br />
Jan-99<br />
Feb-99<br />
Mar-99<br />
Apr-99<br />
May-99<br />
a<br />
381 117 59 481 273 233 125 300<br />
3,8<br />
3,7<br />
3,6<br />
3,5<br />
3,4<br />
3,3<br />
3,2<br />
3,1<br />
3,0<br />
T13 females<br />
20<br />
18<br />
16<br />
14<br />
12<br />
10<br />
8<br />
6<br />
4<br />
2<br />
0<br />
3,8<br />
3,7<br />
3,6<br />
3,5<br />
3,4<br />
3,3<br />
3,2<br />
3,1<br />
3,0<br />
T13 males<br />
20<br />
18<br />
16<br />
14<br />
12<br />
10<br />
8<br />
6<br />
4<br />
2<br />
0<br />
Oct-98<br />
Nov-98<br />
Dec-98<br />
Jan-99<br />
Feb-99<br />
Mar-99<br />
Apr-99<br />
May-99<br />
Oct-98<br />
Nov-98<br />
Dec-98<br />
Jan-99<br />
Feb-99<br />
Mar-99<br />
Apr-99<br />
May-99<br />
b<br />
112 21 25 58 16 19 11 29<br />
c<br />
172 77 34 169 56 76 18 60<br />
3,7<br />
3,6<br />
3,5<br />
3,4<br />
3,3<br />
3,2<br />
3,1<br />
3,0<br />
T8 females<br />
20<br />
18<br />
16<br />
14<br />
12<br />
10<br />
8<br />
6<br />
4<br />
2<br />
0<br />
3,8<br />
3,7<br />
3,6<br />
3,5<br />
3,4<br />
3,3<br />
3,2<br />
3,1<br />
3,0<br />
T8 males<br />
20<br />
18<br />
16<br />
14<br />
12<br />
10<br />
8<br />
6<br />
4<br />
2<br />
0<br />
Oct-98<br />
Nov-98<br />
Dec-98<br />
Jan-99<br />
Feb-99<br />
Mar-99<br />
Apr-99<br />
May-99<br />
Oct-98<br />
Nov-98<br />
Dec-98<br />
Jan-99<br />
Feb-99<br />
Mar-99<br />
Apr-99<br />
May-99<br />
d<br />
35 7 114 82 60 26 104<br />
e<br />
62 12 140 119 78 70 107<br />
Figure S17. Monthly progression <strong>of</strong> Pseudotropheus zebra mean condition factor, Secchi disk<br />
measurements (m) and benthic chlorophyll a biomass (µg/cm²) at Thumby west for both sites,<br />
females and males pooled (a), at Thumby T13 for females only (b), males only (c) and at<br />
Thumby T8 for females only (d), males only (e). Numbers below the months are the<br />
corresponding sample numbers.<br />
255
Despite some significant differences among months, there was no evidence <strong>of</strong> seasonal effect<br />
on CF for females (Figure S17b), and only a slight decreasing trend for males (Figure S17c).<br />
<strong>The</strong> mean CF was correlated neither with the Secchi disk measurements, nor with the<br />
chlorophyll a biomass (Pearson correlation p>0.05) for both females and males.<br />
At Thumbi T8, there were significant monthly differences <strong>of</strong> CF for both females (Figure<br />
S17d, F 7,421 =21.746, p
Condition factor<br />
4,0<br />
3,9<br />
3,8<br />
3,7<br />
3,6<br />
3,5<br />
3,4<br />
CF<br />
Secchi<br />
Chloro a<br />
18<br />
16<br />
14<br />
12<br />
10<br />
8<br />
6<br />
4<br />
2<br />
Chlorophyll a biomass (ug/cm²)<br />
Secchi disk depth (m)<br />
3,3<br />
0<br />
Oct-98<br />
Nov-98<br />
Dec-98<br />
Jan-99<br />
Feb-99<br />
Mar-99<br />
Apr-99<br />
May-99<br />
25 16 18 38 13 16 37 31<br />
Figure S18. Monthly progression <strong>of</strong> Pseudotropheus tropheops 'red cheek'<br />
mean condition factor, Secchi disk measurements (m) and benthic<br />
chlorophyll a biomass (µg/cm²) at Thumby west for both sites. Numbers<br />
below the months are the corresponding sample numbers.<br />
Condition factor<br />
3,5<br />
3,4<br />
3,3<br />
3,2<br />
3,1<br />
3,0<br />
2,9<br />
CF<br />
Secchi<br />
Chloro a<br />
18<br />
16<br />
14<br />
12<br />
10<br />
8<br />
6<br />
4<br />
2<br />
2,8<br />
0<br />
Oct-98<br />
Nov-98<br />
Dec-98<br />
Jan-99<br />
Feb-99<br />
Mar-99<br />
Apr-99<br />
May-99<br />
Chlorophyll a biomass (ug/cm²)<br />
Secchi disk depth (m)<br />
86 21 14 63 44 33 47 14<br />
Figure S19. Monthly progression <strong>of</strong> Pseudotropheus callainos mean<br />
condition factor, Secchi disk measurements (m) and benthic chlorophyll a<br />
biomass (µg/cm²) at Thumby west for both sites. Numbers below the<br />
months are the corresponding sample numbers.<br />
257
Despite the clear tendency <strong>of</strong> mean CF to decrease along the rainy season (Figure S18), it was<br />
not possible to group months (i.e. October-January versus February-May) owing to the<br />
significant difference between March and April and May (Table S10). However, separating<br />
April-May from the other months, the mean CF was significantly lower in April-May<br />
(F 1,192 =37.886, p0.05), allowing to test for between months (October to May), sites (T13 and T8) and sex<br />
(females and males) differences using a general linear model with month, site and sex as<br />
factors and CF as dependant variable. Month had a significant effect (F 7,294 =4.050, p
Condition factor<br />
3,7<br />
3,5<br />
3,3<br />
3,1<br />
2,9<br />
2,7<br />
CF<br />
Secchi<br />
Chloro a<br />
18<br />
16<br />
14<br />
12<br />
10<br />
8<br />
6<br />
4<br />
2<br />
Chlorophyll a biomass (ug/cm²)<br />
Secchi disk depth (m)<br />
2,5<br />
0<br />
Oct-98<br />
Nov-98<br />
Dec-98<br />
Jan-99<br />
Feb-99<br />
Mar-99<br />
Apr-99<br />
May-99<br />
16 18 23 54 47 29 19 85<br />
Figure S20. Monthly progression <strong>of</strong> Pseudotropheus aurora mean condition<br />
factor, Secchi disk measurements (m) and benthic chlorophyll a biomass<br />
(µg/cm²) at Thumby west for both sites. Numbers below the months are<br />
the corresponding sample numbers.<br />
Condition factor<br />
3,7<br />
3,6<br />
3,5<br />
3,4<br />
3,3<br />
3,2<br />
3,1<br />
CF<br />
Secchi<br />
Chloro a<br />
18<br />
16<br />
14<br />
12<br />
10<br />
8<br />
6<br />
4<br />
2<br />
3<br />
0<br />
Oct-98<br />
Nov-98<br />
Dec-98<br />
Jan-99<br />
Feb-99<br />
Mar-99<br />
Apr-99<br />
May-99<br />
Chlorophyll a biomass (ug/cm²)<br />
Secchi disk depth (m)<br />
5 9 18 24 21 29 23<br />
Figure S21. Monthly progression <strong>of</strong> Petrotilapia nigra mean condition factor,<br />
Secchi disk measurements (m) and benthic chlorophyll a biomass (µg/cm²)<br />
at Thumby west for both sites. Numbers below the months are the<br />
corresponding sample numbers.<br />
259
A similar pattern as that <strong>of</strong> Ps. callainos was observed for Ps. aurora, with the mean<br />
condition factor decreasing from November to December, a plateau phase from December to<br />
March and then another decrease in April-May (Figure S20). During what we called the<br />
plateau phase, a sharp increase <strong>of</strong> the mean CF arose in January as for most <strong>of</strong> the species at<br />
Thumbi sites, though in a lesser extent. Statistical results confirmed that most <strong>of</strong> the observed<br />
differences were significant. <strong>The</strong> mean CF was significantly correlated to the Secchi disk<br />
measurements (r=0.829, p=0.011), but not with the chlorophyll a biomass.<br />
Petrotilapia nigra<br />
<strong>The</strong> monthly progression <strong>of</strong> P. nigra mean condition factor, Secchi disk measurements<br />
and benthic chlorophyll a biomass at Thumbi west sites are presented in Figure S21. No<br />
correlation was observed between CF and length <strong>of</strong> <strong>fish</strong> (Pearson correlation p>0.05),<br />
allowing to test for between months (October to May), sites (T13 and T8) and sex (females<br />
and males) differences using a general linear model with month, site and sex as factors and<br />
CF as dependant variable. None <strong>of</strong> the factors had a significant effect on mean condition<br />
factor, which translated the absence <strong>of</strong> seasonal effect on CF (Figure S21). <strong>The</strong> mean CF was<br />
correlated neither with the Secchi disk measurements nor the chlorophyll a biomass.<br />
Discussion<br />
Parallel to this study <strong>of</strong> rocky shore <strong>fish</strong> communities (September 1998 to April 1999),<br />
the impact <strong>of</strong> suspended sediments on the abundance and species richness <strong>of</strong> near-shore sandy<br />
<strong>fish</strong>es was investigated along a sedimentation gradient from Linthipe river mouth to 35 km<br />
northwards, during the course <strong>of</strong> a Master's degree (Sululu 2000). In <strong>Lake</strong> Tanganyika, Cohen<br />
et al. (1993a) compared the biodiversity and abundance <strong>of</strong> ostracods, diatoms and <strong>fish</strong> species<br />
in sites permanently characterised by diverse degrees <strong>of</strong> sedimentation disturbances, but for<br />
which no baseline data were available to assess the state <strong>of</strong> species communities before the<br />
apparition <strong>of</strong> the permanent disturbance. <strong>The</strong> originality <strong>of</strong> both Sululu's and ours studies,<br />
compared to that <strong>of</strong> Cohen et al. (1993a), lies in that we investigated the short term effects <strong>of</strong><br />
a temporary sediment disturbance on sites for which pre-disturbance state was (previously)<br />
assessed.<br />
In <strong>Lake</strong> Tanganyika, sites highly impacted by sedimentation had a lower species<br />
richness and species abundance than non impacted sites, and sites characterised by an<br />
intermediate disturbance had intermediate species richness and abundance (Cohen et al.<br />
1993a). In <strong>Lake</strong> <strong>Malawi</strong>, significant variations in the abundance and species richness <strong>of</strong> sanddwelling<br />
<strong>fish</strong> were observed before and during the sedimentation period at the station closest<br />
to the Linthipe river mouth in gillnet catches, but not in beach seine catches (Sululu 2000).<br />
However, over all the stations sampled by beach seine, the mean abundance <strong>of</strong> cichlids rose<br />
during the rainy season, while species richness declined (Sululu 2000). Some fluctuations in<br />
the relative abundance <strong>of</strong> rock-dwelling species were observed among months at both<br />
Nakantenga and Thumbi sites. However, these variations were not significant. Thumbi west<br />
sites housed a slightly higher number <strong>of</strong> species than Nakantenga sites and on both islands<br />
exposed sites were richer than protected ones: 24, 27, 30 and 33 species for Nsh, Nex, T13<br />
and T8 respectively. However, within each site, the number <strong>of</strong> species did not changed along<br />
the rainy season, thus during the disturbance period.<br />
Close to the Linthipe river mouth, both species richness and abundance <strong>of</strong> sand-dwelling<br />
<strong>fish</strong>es showed overall significant negative correlation with the concentration <strong>of</strong> suspended<br />
sediments (Sululu 2000). <strong>The</strong> concentration <strong>of</strong> suspended sediment was assessed by Secchi<br />
disk measurements in our case. Correlation between species richness or abundance and<br />
260
concentration <strong>of</strong> suspended sediment was not investigated as species richness and abundance<br />
did not differ significantly. On the other hand, a striking pattern appeared when looking at the<br />
relationship between the <strong>fish</strong>es mean condition factor and the Secchi disk measurements or<br />
the mean chlorophyll a biomass. Despite <strong>of</strong>ten similar monthly progression, there was very<br />
few significant correlation between the species mean CF and these two parameters. However,<br />
at Nakantenga, the mean CF <strong>of</strong> species, when significant, was always positively correlated to<br />
the chlorophyll a biomass (r=0.744, p=0.034 for Ps. zebra 'black dorsal' and r=0.943,<br />
p=0.0005 for Ps. zebra 'yellow throat'), whereas it was always correlated with the Secchi disk<br />
depth when significant at Thumbi West (r=0.829, p=0.011 for Ps. aurora; r=0.870, p=0.005<br />
for Ps. callainos; r=0.768, p=0.026 for Ps. tropheops 'red cheek'; r=0.843, p=0.017 for<br />
females, r=0.842, p=0.017 for males Ps. zebra at T8). Chlorophyll a biomass was found to<br />
fluctuate very little in Thumbi West sites (Figure S4) apart from a temporary large peak<br />
resulting from land run<strong>of</strong>f. On the other hand, water clarity (assessed by Secchi disk<br />
measurements) decreased slightly but steadily from October to April-May (Figure S4). A<br />
decreased visibility might interfere with plankton foraging for the partly plankton feeding<br />
species <strong>of</strong> the Ps. zebra complex and account for a decreased condition. But it is more<br />
difficult to explain the influence <strong>of</strong> a slightly decreased water clarity on a preferentially<br />
aufwush feeder like Ps. tropheops 'red cheek', especially if the effect <strong>of</strong> water transparency<br />
does not affect algae biomass. Suspended particles, though not as abundant as at Nakantenga,<br />
might decrease the nutritional value <strong>of</strong> the benthic detritus and algae (Cohen et al. 1993b),<br />
accounting for the observed decreased condition <strong>of</strong> <strong>fish</strong> species. Next, if a slight decline <strong>of</strong><br />
water clarity affects the <strong>fish</strong> condition, why for none <strong>of</strong> the species (not even species <strong>of</strong> the<br />
Ps. zebra complex) the CF was correlated to Secchi disk measurements at Nakantenga where<br />
the visibility strongly decreased? A likely explanation is that unlike the monthly mean<br />
chlorophyll biomass, which probably reflected real monthly trends (see results), monthly<br />
Secchi disk measurements, taken once a month, may not represent monthly trends at<br />
Nakantenga, but rather transient trends. Indeed, even though the island was most <strong>of</strong> the time<br />
surrounded by "cloudy waters" from February to April-May, the dense sediment plume<br />
resulting in very poor visibility was going back and forth according to wind and current<br />
direction. Given the observed steady sediment deposition on rocks from February to April-<br />
May at Nakantenga, and the subsequent decline <strong>of</strong> algal biomass, it appears logical that <strong>fish</strong><br />
condition was rather correlated to algae biomass, even if this correlation was significant for a<br />
few species only.<br />
At Thumbi West sites, an sudden increase <strong>of</strong> the mean condition factor was observed for all<br />
the species in January. As this increase occurred for every species, it is likely to be a<br />
consequence <strong>of</strong> the algae biomass peak recorded in December at every site in Thumbi Island.<br />
<strong>The</strong> influence <strong>of</strong> suspended sediment on life history characteristics could only be<br />
assessed on two species present at both islands and abundant enough at both <strong>of</strong> them. For both<br />
species (L. fuelleborni and Ps. tropheops 'orange chest') no significant difference <strong>of</strong> size at<br />
maturity, fecundity or oocyte weight was observed between the site highly impacted by<br />
fluvial sediment (Nakantenga) and the control site (Thumbi West).<br />
<strong>The</strong> mean condition factor showed a clear decreasing trend along the rainy season (i.e. during<br />
the sediment plume's influence) for every species but one at Nakantenga sites. More<br />
surprising was the same tendency, though in a lesser extent, observed at Thumbi West sites,<br />
which were supposed to be the sediment free or control sites. Although the sediment plume<br />
was seen once surrounding Mumbo Island <strong>of</strong>f Cape Maclear, it never reached Thumbi West.<br />
Also there is no major river at Cape Maclear and despite deforestation problems on the steep<br />
slopes <strong>of</strong> the Nankumba peninsula resulting in some silt deposition on the rocky shores<br />
(Bootsma 1992), Thumbi West is by far less impacted by sedimentation than Nakantenga.<br />
261
Table S12. Homogeneous months grouping for between-season comparison <strong>of</strong> mean condition factor per<br />
species at Nakantenga. White bars, mean CF does not differ from the dry season mean value. Black<br />
bars, mean CF significantly lower than the dry season mean value. Absence <strong>of</strong> bars means that season<br />
had no effect on the CF.<br />
Species Oct-98 Nov-98 Dec-98 Jan-99 Feb-99 Mar-99 Apr-99 May-99<br />
Ps. zebra 'red dorsal'<br />
Ps. zebra 'yellow throat'<br />
Ps. zebra 'black dorsal'<br />
Ps. 'aggressive zebra'<br />
Petrotilapia 'fuscous'<br />
Ps. barlowi<br />
Ps. williamsi<br />
Labeotropheus fuelleborni<br />
Ps. tropheops 'orange chest' M<br />
F<br />
Table S13. Homogeneous months grouping for between-season comparison <strong>of</strong> mean condition factor<br />
per species at Thumby west. White bars: mean CF does not differ from the dry season mean value.<br />
Black bars: mean CF significantly lower than the dry season mean value. Grey bars: intermediate<br />
state. Absence <strong>of</strong> bars means that season had no effect on the CF.<br />
Species Oct-98 Nov-98 Dec-98 Jan-99 Feb-99 Mar-99 Apr-99 May-99<br />
Ps. zebra<br />
Ps. . tropheops 'red cheek<br />
Ps. callainos<br />
Ps. aurora<br />
Petrotilapia nigra<br />
Labeotropheus fuelleborni<br />
Ps. tropheops 'orange chest'<br />
262
Benthic algal biomass and water clarity measurements along the course <strong>of</strong> this study clearly<br />
supported this statement. However, Thumbi West might possibly not be considered as a real<br />
sediment free site, which would account for the observed results.<br />
<strong>The</strong> decrease <strong>of</strong> mean condition factor along the rainy season did not start at the same time for<br />
every species at Nakantenga (Table S12). Depending on species, the date at which the mean<br />
CF started to significantly decrease varied from January to April, but for most <strong>of</strong> them it<br />
started in March (50%) and February (25%), which was the period when the Linthipe river<br />
discharge was maximum (Figure S3), the water clarity the worst and the algae biomass the<br />
lowest (Figure S4). A similar tendency was observed at Thumbi West site (Table S13), but the<br />
difference in CF appeared more progressively to become really significant later in the season<br />
for most <strong>of</strong> the species. It is interesting to note that for most <strong>of</strong> the species at Thumbi West,<br />
the lowest CF were recorded in April-May, when algae biomass and water clarity had already<br />
started to increase (Figure S4).<br />
<strong>The</strong> influence <strong>of</strong> season on the mean CF was also observed to vary between sites at each<br />
island. At Nsh, for Ps. zebra 'red dorsal' season had the same significant effect on CF for both<br />
females and males whereas no effect was detected at Nex for either sex. At Thumbi West T8,<br />
for Ps. zebra, season had the same significant effect on CF for both females and males<br />
whereas no effect was detected at site T13 for either sex. Interestingly, these species are<br />
ecological equivalent on the two islands and were the two most abundant species.<br />
<strong>The</strong> hypothesis that during the sediment plume, the <strong>fish</strong> would move upwards from the<br />
deep waters to the shallows to compensate for the shortage <strong>of</strong> food availability in the deeper<br />
waters, was not verified during this study. At Nsh site, only one species was found more<br />
abundant at 2 m during the rainy season. Two species were more abundant at 6 m and 3 at 10<br />
m, whereas only 2 species were less abundant at 10 m and one at 6 m. At Nex site, three<br />
species were found less abundant at 10 m and one at 6 m during the rainy season, whereas at<br />
each depth one species was found more abundant. At Thumbi West sites, only three species<br />
were less abundant at 6 m during the rainy season, whereas two were more abundant at 10 m,<br />
three at 6 m and six at 2 m. Furthermore, none <strong>of</strong> these trends were significant. However, it is<br />
likely that the monthly sampling frequency was not adequate to reveal such a phenomenon,<br />
which is probably rather transient. Indeed, during one sampling at Nakantenga exposed site in<br />
February 1999, we experienced an exceptional event. A dense sediment plume was settled<br />
around the island, water visibility being less than 2 m at the surface (Secchi disk depth: 1.5<br />
m), when a narrow band (about 20 m width) <strong>of</strong> clearer water drifted towards our site. We<br />
quickly equipped ourselves with scuba gears and slates, and jumped down the water to<br />
observe the <strong>fish</strong>es behaviour during that event. Before the arrival <strong>of</strong> the clearer water band,<br />
<strong>fish</strong>es were moving only very little, staying within a 50 cm radius from their hiding hole,<br />
some <strong>of</strong> them not moving at all, behaving as if it were night. When the clearer water band<br />
reached the site, within seconds all the <strong>fish</strong>es gathered in the water column near the surface in<br />
a huge crowd cropping frenetically upon plankton. A few minutes later, the clear water was<br />
gone and the <strong>fish</strong>es almost instantaneously returned down to their respective hiding holes, as<br />
if nothing had happened and it were night again (Ribbink & Duponchelle, unpublished data).<br />
This quick observation might actually be what happens when the wind and currents drive the<br />
plume away from the island. Opportunistic behaviour and ability to food switching <strong>of</strong> mbuna<br />
are well documented (Fryer & Iles 1972, McKaye & Marsh 1983, Ribbink et al. 1983,<br />
Reinthal 1990). Our hypothesis is that during darkness resulting from the dense plume's<br />
presence, mbuna would spend very little energy in territorial and sexual activity given the<br />
poor visibility and in feeding upon scarce and/or blanketed benthic material with diminished<br />
nutritional value. Instead <strong>of</strong> that, they would keep resting, expensing only limited amounts <strong>of</strong><br />
263
energy, awaiting for improved environmental conditions. As soon as visibility improves, they<br />
all move in the water column towards the shallows, feeding upon the large amounts <strong>of</strong><br />
plankton flourishing from the nutrients associated with suspended particles, making up for the<br />
food deprivation endured or building up reserves. This strategy would allow the highly<br />
stenotopic mbuna to pass through the still-temporary disturbance occasioned by the suspended<br />
sediment. It would explain why, unlike the easily-moving sand-dwelling species, no<br />
significant variations in species richness or abundance were observed and why only a<br />
decreased body condition was recorded for mbuna. <strong>The</strong> stable isotope samples taken during<br />
this study but unfortunately not available at the moment might shed some light and support or<br />
reject that hypothesis.<br />
This study is considered as preliminary. A clear decreased in body condition was observed for<br />
almost every species during the period <strong>of</strong> the sediment plume's influence. However, our<br />
results also suggest that a sampling design with much shorter sampling intervals is necessary<br />
to better understand the dynamics <strong>of</strong> rock-dwelling <strong>fish</strong> reaction to suspended sediment<br />
disturbance. A regular stomach content analysis before and during the sedimentation period<br />
would help testing our hypothesis. Multivariate analysis <strong>of</strong> the data, which would help<br />
clarifying the observed trends, was not possible given the time constraint over this <strong>report</strong>, but<br />
will be carried out ultimately. Despite the seasonal and temporary effects <strong>of</strong> suspended<br />
sediment, still restricted to the rainy season, impacts have already been detected on sandy<br />
(Sululu 2000) and rocky <strong>fish</strong> communities. Given the increase <strong>of</strong> anthropogenic activities that<br />
lead to habitat degradation and increased erosion around the <strong>Lake</strong> shore and the steadily<br />
increasing human population, this impact is very likely to considerably worsen in the coming<br />
years.<br />
264
References cited
References cited<br />
Albaret JJ. 1982. Reproduction et fécondité des poissons d'eau douce de Côte d'Ivoire. Rev.<br />
Hydrobiol. Trop. 15: 347-371.<br />
Allison E.H., K. Irvine, A.B. Thompson & B.P. Ngatunga 1996. Diets and food consumption<br />
rates <strong>of</strong> pelagic <strong>fish</strong> in <strong>Lake</strong> <strong>Malawi</strong>, <strong>Africa</strong>. Freshw. Biol. 35: 489-515.<br />
Anderson R.O. & S.J. Gutreuter 1983. Length, weight and associated structural indices, pp. 283-<br />
300. In Fisheries techniques (Nielsen L.A. & D.L. Johnson eds.). Am. Fisher. Soc. Bethesda,<br />
Maryland, 468p.<br />
Bagenal T.B. 1969. Relationship between egg size and fry survival in Brown Trout Salmo truta<br />
L.. J. Fish Biol. 1: 349-353.<br />
Bagenal T.B. 1978. Aspects <strong>of</strong> <strong>fish</strong> fecundity. In: Ecology <strong>of</strong> freshwater <strong>fish</strong> production, S.D.<br />
Gerking (ed.), pp 75-101. Blackwell Scientific Publications, Oxford.<br />
Banda M.C. & T. Tómasson 1996. Surveys <strong>of</strong> trawling grounds and demersal <strong>fish</strong> stocks in<br />
central <strong>Lake</strong> <strong>Malawi</strong>, from Dormira Bay to Nkhata Bay, in 1994 and 1995. Government <strong>of</strong><br />
<strong>Malawi</strong>, Fisheries Department, Fish. Bul. 33. 34p.<br />
Banda M.C., T. Tómasson & D. Tweddle 1996. Assesment <strong>of</strong> the deep water trawl <strong>fish</strong>eries <strong>of</strong><br />
the South East Arm <strong>of</strong> <strong>Lake</strong> <strong>Malawi</strong> using exploratory surveys and commercial catch data, pp.<br />
53-75. In Stock assessment in inland <strong>fish</strong>eries (I.G. Cowx ed.). Fishing New Books, Oxford.<br />
Belkhir K., P. Borsa, J. Goudet, L. Chikhi & F. Bonhomme 1996 - 1998. GENETIX, logiciel sous<br />
Windows TM pour la génétique des populations. Laboratoire Génome et Populations, CNRS<br />
UPR 9060, Université de Montpellier II, Montpellier (France).<br />
Bootsma H.A. 1992. <strong>Lake</strong> <strong>Malawi</strong> National Park: an overview. Mitt. Internat. Verein. Limnol. 23:<br />
125-128.<br />
Bootsma H.A. & R.E. Hecky 1993. Conservation <strong>of</strong> the <strong>Africa</strong>n Great <strong>Lake</strong>s: a limnological<br />
perspective. Conserv. Biol. 7(3): 644-656.<br />
Bootsma H.A. & R.E. Hecky 1999. Water Quality Report, <strong>Lake</strong> <strong>Malawi</strong>/Nyasa Biodiversity<br />
Conservation Project. 276pp.<br />
Bootsma H.A., R. E. Hecky, R.H. Hesslein & G.F. Turner, 1996. Food partitioning among <strong>Lake</strong><br />
<strong>Malawi</strong> nearshore <strong>fish</strong>es as revealed by stable isotope analyses. Ecology 77 (4): 1286-1290.<br />
Bouton N, O. Seehausen & J.J.M. van Alphen 1997. Resource partitioning among rock-dwelling<br />
haplochromines (Pisces: cichlidae) from <strong>Lake</strong> Victoria. Ecol. Freshwat. Fish 6: 225-240.<br />
Cambray J.A. & M.N. Bruton 1994. Evolutionary trade-<strong>of</strong>f between egg size and egg number in a<br />
sister species pair <strong>of</strong> redfin ninnows, Pseudobarbus afer and P. asper (Osteichthyes:<br />
Cyprinidae). Ichthyol. Explor. Freshwaters 5: 305-320.<br />
Casselman J.M. 1987. Determination <strong>of</strong> age and growth, pp. 209-242. In: <strong>The</strong> Biology <strong>of</strong> Fish<br />
Growth (Weatherley A.H. & H.S. Gill eds.). Academic Press, 443 p.<br />
Cohen A.S., S. Kaufman & R. Oguttu-Ohwayo 1996. Anthropogenic threats, impacts and<br />
conservation strategies in the <strong>Africa</strong>n Great <strong>Lake</strong>s: a review pp. 576-614. In <strong>The</strong> limnology,<br />
climatology and paleolimnology <strong>of</strong> the Great <strong>Africa</strong>n <strong>Lake</strong>s (Johnson T.C. & E.O. Odada<br />
eds.). Gordon & Breach publishers.<br />
Cohen A.S., R. Bills, C.Z. Cocquyt & A.G. Caljon 1993a. <strong>The</strong> impact <strong>of</strong> sediment pollution on<br />
biodiversity in <strong>Lake</strong> Tanganyika. Conserv. Biol. 7: 667-677.<br />
Cohen A.S., R. Bills, M. Gashagaza, E. Michel, J-J. Tiercelin, K. Martens, M. Shoreghan, P.<br />
Coveliers, K. West, G. Ntakimazil, S. Mboko, & K. Sona 1993b. Preliminary observations <strong>of</strong><br />
sedimentation impacts on benthic environments and biodiversity using an ROV submersible in<br />
265
<strong>Lake</strong> Tanganyika. In Abstracts and Programme <strong>of</strong> PARADI (Poissons, resources, diversité),<br />
Sénégal, November 1993.<br />
Cooley P.M. 1999. Coastal and Littoral Habitat. In CEOS Data Report in Support <strong>of</strong> the <strong>Lake</strong><br />
<strong>Malawi</strong> Biodiversity Conservation Project, <strong>Malawi</strong>, <strong>Africa</strong>: Volume II (Cooley, P. M., G. K.<br />
McCullough, & F.X. Mkanda eds.). Centre for Earth Observation Science Data Report 99-9-1.<br />
99 p.<br />
Coulter G.W. 1991. Pelagic <strong>fish</strong>. In: <strong>Lake</strong> Tanganyika and its life (Coulter G.W. ed.), pp. 111-<br />
138. British Museum <strong>of</strong> Natural History/Oxford University Press, London.<br />
Craig J.F. 1978. A note on ageing in field with special reference to perch, Perca fluviatilis L..<br />
Verh. Internat. Verei. Limn. 20: 2060-2064.<br />
Darwall W.R.T. 1999. Diet analysis. In "<strong>The</strong> trophic <strong>ecology</strong> <strong>of</strong> the demersal <strong>fish</strong> community <strong>of</strong><br />
<strong>Lake</strong> <strong>Malawi</strong>/Niasa, central <strong>Africa</strong>", First Annual Report. INCO-DC: International<br />
Cooperation with Developing Countries.<br />
Day M. Cpt. 1999. NR International Ltd's consultant for SADC/GEF <strong>Lake</strong> <strong>Malawi</strong> Biodiversity<br />
Conservation Project. Final Report.<br />
De Silva S.S. 1986. Reproductive biology <strong>of</strong> Oreochromis mossambicus populations <strong>of</strong> manmade<br />
lakes in Sri Lanka: a comparative study. Aquacul. Fisher. Manag.17: 31-38.<br />
Duarte C.M. & M. Alcaraz 1989. To produce many small or few large eggs: a size-independante<br />
tactic <strong>of</strong> <strong>fish</strong>. Oceologia 80: 401-404.<br />
Duponchelle, F. 1997. Reproduction du tilapia (Pisces, <strong>Cichlid</strong>ae) Oreochromis niloticus<br />
(Linnaeus, 1758) dans les retenues artificielles de Côte d'Ivoire : analyse comparative des<br />
modalités de reproduction et approche expérimentale de leur déterminisme. PhD <strong>The</strong>sis,<br />
Université de Bretagne Occidentale.<br />
Duponchelle F. & Panfili J. (1998). Variations in age and size at maturity <strong>of</strong> female Nile tilapia,<br />
Oreochromis niloticus, populations from man-made lakes <strong>of</strong> Côte d'Ivoire. Envir. Biol. Fish.<br />
52: 453-465.<br />
Duponchelle F. P. Cecchi, D. Corbin, J. Nunez, & M. Legendre (1999). Spawning season<br />
variations <strong>of</strong> female Nile tilapia, Oreochromis niloticus, populations from man-made lakes <strong>of</strong><br />
Côte d'Ivoire. Envir. Biol. Fish. 56: 377-389.<br />
Duponchelle F., P. Cecchi, D. Corbin, J. Nunez, & M. Legendre (2000). Variations in fecundity<br />
and egg size <strong>of</strong> female Nile tilapia, Oreochromis niloticus, populations from man-made lakes<br />
<strong>of</strong> Côte d'Ivoire. Envir. Biol. Fish. 57: 155-170.<br />
Eccles D.H. (1974). An outline <strong>of</strong> the physical limnology <strong>of</strong> <strong>Lake</strong> <strong>Malawi</strong> (<strong>Lake</strong> Nyasa). Limnol.<br />
Oceanogr. 19: 730-742.<br />
Eccles D.H. & D.S.C. Lewis (1981). Midwater spawning in Haplochromis chrysonotus<br />
(Boulenger) (Teleostei: <strong>Cichlid</strong>ae) in <strong>Lake</strong> <strong>Malawi</strong>. Env. Biol. Fish. 6: 201-202.<br />
Eccles D.H. & E. Trewavas 1989. <strong>Malawi</strong>an cichlid <strong>fish</strong>es. <strong>Lake</strong> Fish Movies, Herten, Germany,<br />
335 p.<br />
Elgar M.A. 1990. Evolutionary compromise between a few large and many small eggs:<br />
comparative evidence in teleost <strong>fish</strong>. Oikos 59: 283-287.<br />
Evans D.O., K.H. Nicholls, Y.C. Allen & M.J. Memurty 1996. Historical land use, phosphorus<br />
loading and loss <strong>of</strong> <strong>fish</strong> habitat in <strong>Lake</strong> Simcoe, Canada. Can J. Fish. Aquat. Sci. 53:194-218.<br />
FAO 1993. Fisheries management in south-east <strong>Lake</strong> <strong>Malawi</strong>, the Upper Shire River and <strong>Lake</strong><br />
Malombe, with particular reference to the <strong>fish</strong>eries on chambo (Oreochromis spp.). CIFA<br />
Technical Paper 21, 113p.<br />
Fergusson A., B. Dermanm & R. Mkandwire 1993. <strong>The</strong> new development rhetoric and <strong>Lake</strong><br />
<strong>Malawi</strong>. <strong>Africa</strong> 63: 1-18.<br />
Fishelson L. 1966. <strong>Cichlid</strong>ae <strong>of</strong> the genus Tilapia in Israel. Bamidgeh 18: 67-80.<br />
Fry B. P.L. Mumford, F. Tam, D.D. Fox, G.L. Warren, K.E. Havens & A. D. Steinman 1999.<br />
Trophic position and individual feeding histories <strong>of</strong> <strong>fish</strong> from <strong>Lake</strong> Okeechobee, Florida. Can.<br />
J. Fish. Aquat. Sci. 56: 590-600.<br />
266
Fryer G. 1959. <strong>The</strong> trophic interrelationships and <strong>ecology</strong> <strong>of</strong> some littoral communities <strong>of</strong> <strong>Lake</strong><br />
Nyasa, with especial reference to the <strong>fish</strong>es. Proc. Zool. Soc. Lond. 132: 153-281.<br />
Fryer G. 1972. Conservation <strong>of</strong> the Great <strong>Lake</strong>s <strong>of</strong> <strong>Africa</strong>: a lesson and a warning. Biol. Conserv.<br />
4(4): 256-262.<br />
Fryer G. 1984. <strong>The</strong> conservation and rational exploitation <strong>of</strong> the biota <strong>of</strong> <strong>Africa</strong>'s Great <strong>Lake</strong>s. S.<br />
Afr. Nat. Sci. Prog. Rep. 92: 135-154.<br />
Fryer G. & T.D. Iles 1972. <strong>The</strong> <strong>Cichlid</strong> <strong>Fishes</strong> <strong>of</strong> the Great <strong>Lake</strong>s <strong>of</strong> <strong>Africa</strong>. Oliver & Boyd,<br />
London, 641 p.<br />
Gannes L.Z., D.M. O'Brien and C.D.M. Rio 1997. Stable isotopes in animal <strong>ecology</strong>:<br />
assumptions, caveats, and a call for more laboratory experiments. Ecology 78: 1271-1276.<br />
Gauthier J.Y., M.A. Richard-Yris, B. Lefaucheux & M. Foraste 1996. Plasticité du cycle parental<br />
chez Oreochromis niloticus. In: Proceedings <strong>of</strong> <strong>The</strong> Third International Symposiumon Tilapia<br />
in Aquaculture (Pullin R. S. V., J. Lazard, M. Legendre, J.-B. Amon Kothias & D. Pauly eds.),<br />
pp. 340-346. ICLARM Conf. Proc. 41, 575 p.<br />
Gayanilo F.C. Jr., P. Sparre & D. Pauly 1996. <strong>The</strong> FAO-ICLARM Stock Assessment Tool<br />
(FiSAT) user's guide. FAO Comput. Info. Ser. (Fish.) 7, FAO, Rome. 124pp.<br />
Gayanilo F.C. Jr. & D. Pauly 1997. <strong>The</strong> FAO-ICLARM Stock Assessment Tool (FiSAT)<br />
Reference manual. FAO Comput. Info. Ser. (Fish.) 8, FAO, Rome. 262 p.<br />
Genner M.J., G.F. Turner, S. Barker & S.J. Hawkins 1999a. Niche segregation among <strong>Lake</strong><br />
<strong>Malawi</strong> cichlid <strong>fish</strong>es? Evidence from stable isotope signatures. Ecol. Let. 2: 185-190.<br />
Genner M.J., G.F. Turner & S.J. Hawkins 1999b. Resource control by territorial male cichlid <strong>fish</strong><br />
in <strong>Lake</strong> <strong>Malawi</strong>. J. Anim. Ecol. 68: 522-529.<br />
Genner M.J., G.F. Turner & S.J. Hawkins 1999c. Foraging <strong>of</strong> rocky habitat cichlid <strong>fish</strong>es in <strong>Lake</strong><br />
<strong>Malawi</strong>: coexistence through niche partitioning? Oecologia 121: 283-292.<br />
Gorokhova E. & S. Hansson 1999. An experimental study on variations in stable carbon and<br />
nitrogen isotope fractionation during growth <strong>of</strong> Mysis mixta and Neomysis integer. Can. J.<br />
Fish. Aquat. Sci. 56: 2203-2210.<br />
Greenwood P.H. 1984. What is a species flock?, pp. 13-19. In Evolution <strong>of</strong> <strong>fish</strong> species flocks<br />
(Echelle A.A. & I. Kornfield eds.). University <strong>of</strong> Maine at Orono Press.<br />
Hecky R.E. & H.A. Bootsma 1999. Introduction, pp. 18-28. In Water Quality Report (Bootsma<br />
H.A. & R.E. Hecky eds.), SADC/GEF <strong>Lake</strong> <strong>Malawi</strong> / Nyasa Biodiversity Conservation<br />
Project. 276 p.<br />
Hecky R.E., H.J. Kling, T.C. Johnson, H.A. Bootsma & P. Wilkinson 1999. Algal and<br />
sedimentary evidence for recent changes in the water quality and limnology <strong>of</strong> <strong>Lake</strong><br />
<strong>Malawi</strong>/Nyasa, pp. 191-212. In Water Quality Report (Bootsma H.A. & R.E. Hecky eds.),<br />
SADC/GEF <strong>Lake</strong> <strong>Malawi</strong> / Nyasa Biodiversity Conservation Project. 276 p.<br />
Hesslein R.H., K.A. Hallard & P. Ramlal 1993. Replacement <strong>of</strong> sulfur, carbon and nitrogen in<br />
tissue <strong>of</strong> growing broad white<strong>fish</strong> (Coregonus nasus) in response to a change in diet traced by<br />
δ 34 S, δ 13 C and δ 15 N. Can. J. Fish. Aquat. Sci. 50: 2071-2076.<br />
Hesslein R.H., M.J. Capel, D.E. Fox & K.A. Hallard 1991. Stable isotopes <strong>of</strong> sulfur, carbon, and<br />
nitrogen as indicators <strong>of</strong> trophic level and <strong>fish</strong> migration n the lower Mackenzie river basin,<br />
Canada. Can. J. Fish. Aquat. Sci. 48: 2258-2265.<br />
Higgins S., H. Bootsma, R. Hecky, H. Kling, J. Mwita & B. Mwichande 1999. Conserving<br />
biodiversity in the rocky littoral zones <strong>of</strong> <strong>Lake</strong> <strong>Malawi</strong>/Nyasa: a limnological perspective, pp.<br />
46-50. In SADC/GEF, <strong>Lake</strong> <strong>Malawi</strong>/Nyasa/Niassa Biodiversity Conservation Project,<br />
Extended abstracts, Senga Bay Conference (A.J. & A.C. Ribbink eds.). 4-5 March 1999,<br />
Senga Bay, <strong>Malawi</strong>. 179 p.<br />
Hynes H. 1950. <strong>The</strong> food <strong>of</strong> freshwater sticklebacks (Gasterosteus aculeatus and Pygosteus<br />
pungitius), with a review <strong>of</strong> the methods used in the studies <strong>of</strong> the food <strong>of</strong> <strong>fish</strong>es. J. Animal<br />
Ecol. 19: 6-58.<br />
267
Iles T.D. 1960. A group <strong>of</strong> zooplankton feeders <strong>of</strong> the genus Haplochromis (<strong>Cichlid</strong>ae) in <strong>Lake</strong><br />
Nyasa. Ann. Mag. Nat. Hist. 13: 257-280.<br />
Iles T.D. 1971. Ecological aspects <strong>of</strong> growth in <strong>Africa</strong>n cichlid <strong>fish</strong>es. J. Cons. int. Explor. Mer.<br />
33: 363-385.<br />
Irvine K. 1995. Standing biomasses, production, spatial and temporal distributions <strong>of</strong> the<br />
crustacean zooplankton. pp. 85-108. In <strong>The</strong> <strong>fish</strong>eries potential and productivity <strong>of</strong> the pelagic<br />
zone <strong>of</strong> <strong>Lake</strong> <strong>Malawi</strong>/Niassa (A. Menz, ed.), SADC/ODA Final Report, 386 p.<br />
Jackson P.B.M., T.D. Iles, D. Harding & G. Fryer 1963. Report on the survey <strong>of</strong> northern lake<br />
Nyasa. Government Printers, Zomba. 171 pp.<br />
James N.P.E. & M.N. Bruton 1992. Alternative life history traits associated with reproduction in<br />
Oreochromis mossambicus (Pisces: <strong>Cichlid</strong>ae) in smallwater bodies <strong>of</strong> the eastern Cape, South<br />
<strong>Africa</strong>. Envir. Biol. Fish. 34: 379-392.<br />
Kalipeni E. 1996. Demographic response to environmental pressure in <strong>Malawi</strong>. Pop. Environ. 17:<br />
285-308.<br />
King M (ed.) 1995. Fisheries Biology, Assesment and Management. Fishing New Books, Oxford,<br />
England, 341 p.<br />
Kingdon M.J., H.A Bootsma, J. Mwita, B. Mwichande & R.E. Hecky 1999. River discharge and<br />
water quality, pp. 29-69. In Water Quality Report, <strong>Lake</strong> <strong>Malawi</strong>/Nyasa Biodiversity<br />
Conservation Project (Bootsma H.A. & R.E. Hecky eds.). 276 p.<br />
Konings A. 1995. <strong>Malawi</strong> cichlids in their natural habitat. 2 nd Edition. <strong>Cichlid</strong> Press, Germany.<br />
352 p.<br />
Legendre M. 1992. Potentialités aquacoles des <strong>Cichlid</strong>ae (Sarotherodon melanotheron, Tilapia<br />
guineensis) et Clariidae (Heterobranchus longifilis) autochtones des lagunes ivoiriennes.<br />
Ph.D. <strong>The</strong>sis, Université Montpellier II, Montpellier.<br />
Legendre, M. & J.M. Ecoutin. 1989. Suitability <strong>of</strong> brackish water tilapia species from the Ivory<br />
Coast for lagoon aquaculture. I - Reproduction. Aquat. Living Resour. 2: 71-79.<br />
Legendre, M. & J.M. Ecoutin. 1996. Aspects <strong>of</strong> the reproductive strategy <strong>of</strong> Sarotherodon<br />
melanotheron: comparison between a natural population (Ebrie lagoon, Côte d'Ivoire) and<br />
different cultured populations. pp.326-338. In: R.S.V. Pullin, J. Lazard, M. Legendre, J.-B.<br />
Amon Kothias & D. Pauly (ed.), <strong>The</strong> Third International Symposium on Tilapia in<br />
Aquaculture. ICLARM Conf. Proc. 41, Abidjan.<br />
Lévêque C. 1997. Biodiversity dynamics and conservation: the freshwater <strong>fish</strong> <strong>of</strong> tropical <strong>Africa</strong>.<br />
Cambridge University Press. 438p.<br />
Lewis D.S.C. 1982. Problems <strong>of</strong> species definition in <strong>Lake</strong> <strong>Malawi</strong> cichlid <strong>fish</strong>es (Pisces:<br />
<strong>Cichlid</strong>ae). J.L.B. Smith Institute <strong>of</strong> Ichthyology Special Publication 23: 1-5.<br />
Lewis D.S.C. & D. Tweddle 1990. Breeding seasonality in some commercially important trawlcaught<br />
species in the southern <strong>Lake</strong> <strong>Malawi</strong>. pp. 23-35. In: Collected Reports on Fisheries<br />
Research in <strong>Malawi</strong>, Occasional Papers Vol. 1 (Pitcher T. J. & C. R. Hollingworth eds.).<br />
ODA, Overseas Development Administration, London.<br />
Liem K.F. 1980. Adaptative significance <strong>of</strong> intra- and interspecific differences in the feeding<br />
repertoires <strong>of</strong> cichlid <strong>fish</strong>es. Amer. Zool. 20: 295-314.<br />
Liem K.F. 1991. Functional morphology, pp. 129-150. In <strong>Cichlid</strong> <strong>Fishes</strong>: behaviour, <strong>ecology</strong> and<br />
evolution (Keenleyside M.H.A. ed.). Chapman & Hall, 378p.<br />
Lowe R.H. 1953. Notes on the <strong>ecology</strong> and evolution <strong>of</strong> Nyasa <strong>fish</strong>es <strong>of</strong> the genus Tilapia, with a<br />
description <strong>of</strong> Tilapia saka, Lowe. Proc. Zool. Soc. Lond. 122: 1035-1041.<br />
Lowe R.H. 1955. <strong>The</strong> fecundity <strong>of</strong> tilapia species. East Afr. Agricult. J. 21: 45-52.<br />
Lowe-McConnell R.H. 1979. Ecological aspects <strong>of</strong> seasonality in <strong>fish</strong>es <strong>of</strong> tropical waters. Symp.<br />
Zool. Soc. Lond. 44, 219-241.<br />
Lowe-McConnell R.H. 1982. Tilapias in <strong>fish</strong> communities. In <strong>The</strong> biology and culture <strong>of</strong> tilapias,<br />
Pullin R.S.V. and R.H. Lowe-McConnell (eds), pp 83-113. ICLARM Conference Proceedings<br />
7, Manila, Philippines, 432 p.<br />
268
Lowe-McConnell R.H. 1987. Ecological studies in tropical <strong>fish</strong> communities. Cambridge<br />
University Press, Cambridge, 382 p.<br />
Lowe-McConnell R.H. 1993. Fish fauna <strong>of</strong> the <strong>Africa</strong>n Great <strong>Lake</strong>s: origins, diversity, and<br />
vulnerability. Conserv. Biol. 7 (3): 634-643.<br />
Lowe-McConnell R.H. 1994. <strong>The</strong> role <strong>of</strong> ecological and behaviour studies <strong>of</strong> cichlids in<br />
understanding <strong>fish</strong> diversity and speciation in <strong>Africa</strong>n Great <strong>Lake</strong>s: a review. Arch. Hydrobiol.<br />
Beih. Ergebn. Limnol. 44: 335-345.<br />
Lowe-McConnell R.H., F.C. Roest, G. Ntakimazi & L. Risch 1994. <strong>The</strong> <strong>Africa</strong>n Great <strong>Lake</strong>s. In<br />
Biological diversity in <strong>Africa</strong>n fresh and brackish water <strong>fish</strong>es (Teugels et al. eds.).<br />
Symposium PARADI. Ann. Mus. r. Afr. Centr., Zool. 275: 87-94.<br />
McCullough G. 1999. Transport <strong>of</strong> Linthipe River suspended sediments in <strong>Lake</strong> malawi/Nyasa,<br />
pp. 71-84. In Water Quality Report, <strong>Lake</strong> <strong>Malawi</strong>/Nyasa Biodiversity Conservation Project<br />
(Bootsma H.A. & R.E. Hecky eds.). 276 p.<br />
McKaye K.R. & A. Marsh 1983. Food switching by two specialized algae-scraping cichlid <strong>fish</strong>es<br />
in <strong>Lake</strong> <strong>Malawi</strong>, <strong>Africa</strong>. Oecologia 56: 245-248.<br />
Mann R.H.K. & C.A. Mills 1979. Demographic aspects <strong>of</strong> <strong>fish</strong> fecundity. Symp. Zool. Soc.<br />
London 44: 161-177.<br />
Mantel N. 1967. <strong>The</strong> detection <strong>of</strong> disease clustering and a generalized regression approach.<br />
Cancer Res. 27: 209-220.<br />
Marsh E. 1986. Effects <strong>of</strong> egg size on <strong>of</strong>fspring fitness and maternal fecundity in the orangethroat<br />
darter, Etheostoma spectabile (Pisces, Percidae). Copeia 1986: 18-30.<br />
Marsh A.C. & A.J. Ribbink 1985. Feeding-site utilization in three sympatric species <strong>of</strong><br />
Petrotilapia (Pisces: <strong>Cichlid</strong>ae) from <strong>Lake</strong> <strong>Malawi</strong>. Biol. J. Lin. Soc. 25: 331-338.<br />
Marsh A.C. & A.J. Ribbink 1986. Feeding schools among <strong>Lake</strong> <strong>Malawi</strong> cichlid <strong>fish</strong>es. Env. Biol.<br />
Fish. 15: 75-79.<br />
Marsh B. A., A. C. Marsh & A. J. Ribbink 1986. Reproductive seasonality in a group <strong>of</strong> rockfrequenting<br />
cichlid <strong>fish</strong>es in <strong>Lake</strong> <strong>Malawi</strong>. J. Zool., Lond. (A) 209: 9-20.<br />
Marshall B. 1993. Biology <strong>of</strong> the <strong>Africa</strong>n clupeid Limnothrissa miodon with reference to its small<br />
size in artificial lakes. Rev. Fish Biol. Fisheries 3: 17-38.<br />
McElroy D.M. & I. Kornfield 1990. Sexual selection, reproductive behavior, and speciation in the<br />
mbuna species flock <strong>of</strong> <strong>Lake</strong> <strong>Malawi</strong> (Pisces: <strong>Cichlid</strong>ae). Env. Biol. Fish. 28: 273-284.<br />
McKaye K.R. 1983. Ecology and breeding behaviour <strong>of</strong> a cichlid <strong>fish</strong> Cyrtocara eucinostomus on<br />
a large lek in <strong>Lake</strong> <strong>Malawi</strong>. Env. Biol. Fish. 8(2): 81-96.<br />
McKaye K.R. & J.R. Stauffer 1988. Seasonality, depth and habitat distribution <strong>of</strong> breeding males<br />
<strong>of</strong> Oreochromis spp., 'chambo' in <strong>Lake</strong> <strong>Malawi</strong> National Park. J. Fish Biol. 33: 825-834.<br />
Melard C., E. Baras & D. Desprez 1997. Compensatory growth <strong>of</strong> Nile Tilapia, Oreochromis<br />
niloticus., pp. 178-185. In: Proceedings <strong>of</strong> the Fourth International Symposium on Tilapia in<br />
Aquaculture (Fitzsimmons ed.). 9-12 November 1997, Orlando, USA.<br />
Merona de B. 1983. Modèle d'estimation rapide de la croissance des poissons. Application aux<br />
poissons d'eau douce d'Afrique. Rev. Hydrobiol. trop. 16(1): 103-113.<br />
Merona de B., T. Hecht & J. Moreau 1988. Growth <strong>of</strong> <strong>Africa</strong>n freshwater <strong>fish</strong>es, pp. 191-219. In:<br />
Biology and Ecology <strong>of</strong> <strong>Africa</strong>n Freshwater <strong>Fishes</strong> (Lévêque C., M.N. Bruton & G.W.<br />
Ssentongo eds.). ORSTOM editions, 508 p.<br />
Meyer A. 1993. Phylogenetic relationships and evolutionary processes in East <strong>Africa</strong>n cichlid<br />
<strong>fish</strong>es. Trends Ecol. Evol. 8: 279-284.<br />
Meyer A., T.D. Kocher, P. Basasibwaki & A.C. Wilson 1990. Monophyletic origin <strong>of</strong> <strong>Lake</strong><br />
Victoria cichlids suggested by mitochondrial DNA sequences. Nature 347: 550-553.<br />
Mkanda F.X. 1999. Land use, soil erosion and sedimentation in the <strong>Lake</strong> <strong>Malawi</strong> watershed. In<br />
CEOS Data Report in Support <strong>of</strong> the <strong>Lake</strong> <strong>Malawi</strong> Biodiversity Conservation Project, <strong>Malawi</strong>,<br />
<strong>Africa</strong>: Volume II (Cooley, P. M., G. K. McCullough, & F.X. Mkanda eds.). Centre for Earth<br />
Observation Science Data Report 99-9-1. 99 p.<br />
269
Moran P. I. Kornfield & P.N. Reinthal 1994. Molecular systematics and radiation <strong>of</strong> the<br />
haplochromine cichlids (Teleostei: Perciformes) <strong>of</strong> <strong>Lake</strong> <strong>Malawi</strong>. Copeia 1994: 274-288.<br />
Moreau J. & B. Nyakageni 1992. Luciolates stapperssi in <strong>Lake</strong> Tanganyika. Demographical<br />
status and possible recent variations assessed by length frequency distributions. Hydrobiologia<br />
232: 57-64.<br />
Moreau J., Bambino C. & D. Pauly 1986. Indices <strong>of</strong> overall growth performance <strong>of</strong> 100 tilapia<br />
(<strong>Cichlid</strong>ae) populations, pp. 201-206. In: <strong>The</strong> First Asian Fisheries Forum (Mclean J., L.B.<br />
Dizon & L.V. Hosillos eds.). Asian Fisheries Society, Manila, Philippines.<br />
Moreau J., J. Munyandorero & B. Nyakageni 1991. Evaluation des paramètres émographiques<br />
chez Stolothrissa tanganyikae et Limnothrissa myodon du lac Tanganyika. Verh. Internet.<br />
Verein. Limnol. 24: 2552-2558.<br />
Moreau J., M.L.D. Palomares, F.S.B. Torres Jr. & D. Pauly 1995. Atlas démographique des<br />
populations de poissons d'eau douce d'Afrique. ICLARM Rapp. Tech. 45, 140 p.<br />
Msukwa A.V. & A.J. Ribbink 1997. <strong>The</strong> potential role <strong>of</strong> sanctuary areas for biological control <strong>of</strong><br />
schistosomiasis in lake <strong>Malawi</strong> national Park, pp. 305-317. In Proceeding <strong>of</strong> "Workshop on<br />
Medical Malacology in <strong>Africa</strong>", Harare, Zimbabwe, September 22-26.<br />
Ngatunga B.P. & E.H. Allison 1996. Food consumption/biomass ratios <strong>of</strong> the pelagic <strong>fish</strong><br />
community <strong>of</strong> <strong>Lake</strong> <strong>Malawi</strong>/Nyassa. Fishbyte: 36-42.<br />
van Oppen M.J.H., G.F. Turner, C. Ricco, J.C. Deutsch, K.M. Ibrahim, R.L. Robinson & G.M.<br />
Hewitt 1997. Unuasually fine-scale structuring found in rapidly speciating <strong>Malawi</strong> cichlid<br />
<strong>fish</strong>es. Proc. R. Soc. Lond. B 264: 1803-1812.<br />
van Oppen M.J.H., G.F. Turner, C. Ricco, R.L. Robinson, J.C. Deutsch, M.J. Genner & G.M.<br />
Hewitt 1998. Assortative mating among rock-dwelling cichlid <strong>fish</strong>es supports high estimates<br />
<strong>of</strong> species richness from <strong>Lake</strong> <strong>Malawi</strong>. Molecular Ecology 7: 991-1001.<br />
Owen R.B., R. Crossley, T.C. Johnson, D. Tweddle, I. Kornfield, S. Davison, D.H. Eccles & D.E.<br />
Engstrom 1990. Major low levels <strong>of</strong> <strong>Lake</strong> <strong>Malawi</strong> and their implications for speciation rates in<br />
cichlid <strong>fish</strong>es. Proc. R. Soc. Lond. B. 240: 519-553.<br />
Patterson G. & J. Makin (eds.) 1998. <strong>The</strong> state <strong>of</strong> Biodiversity in <strong>Lake</strong> Tanganyika - A Literature<br />
Review. Chatham, UK: Natural Resources Institute. 134pp.<br />
PaulyD. 1980. On the interrelationship between natural mortality, growth parameters and mean<br />
environmental temperature in 175 <strong>fish</strong> stocks. J. Cons. Int. Explor. Mer. 39(2): 175-192.<br />
Pauly D. 1983. <strong>The</strong> length converted catch curves. A powerful tool for <strong>fish</strong>eries research in the<br />
tropics. Fishbyte 1: 9-13.<br />
PaulyD. 1987. A review <strong>of</strong> the ELEFAN system for analysis <strong>of</strong> length frequency data in <strong>fish</strong> and<br />
aquatic invertebrates, pp. 7-34. In: Length-based methods in <strong>fish</strong>eries research (Pauly D. &<br />
G.R. Morgan eds.). ICLARM Conf. Proc. 13, 468 p.<br />
Peters, H.M. 1963. Fecundity, egg weight and oocyte development in tilapias (<strong>Cichlid</strong>ae,<br />
Teleostei). Translated and edited by D. Pauly, 1983. ICLARM Translation 2, 28 p.<br />
Peterson B.J. & B. Fry 1987. Stable isotopes in ecosystem studies. Ann. Rev. Ecol. Syst. 18: 293-<br />
320.<br />
Pitcher T.J. & P.J.B. Hart 1982. Fisheries Ecology. Chapman & Hall, London. 414p.<br />
Reinthal P.N. 1990. <strong>The</strong> feeding habits <strong>of</strong> a group <strong>of</strong> herbivorous rock-dwelling cichlid <strong>fish</strong>es<br />
(<strong>Cichlid</strong>ae: Perciformes) from <strong>Lake</strong> <strong>Malawi</strong>, <strong>Africa</strong>. Env. Biol. Fish. 27: 215-233.<br />
Reznick D.A. & J.A. Endler 1982. <strong>The</strong> impact <strong>of</strong> predation on life history evolution in<br />
Trinidadian guppies (Poecilia reticulata). Evolution 36: 160-177.<br />
Ribbink A.J. 1987. <strong>Africa</strong>n lakes and their <strong>fish</strong>es: conservation scenarios and suggestions.<br />
Environ. Biol. Fish. 19: 3-26.<br />
Ribbink A.J. 1988. Evolution and speciation <strong>of</strong> <strong>Africa</strong>n cichlids, pp. 35-51. In Biology and<br />
<strong>ecology</strong> <strong>of</strong> <strong>Africa</strong>n freshwater <strong>fish</strong>es (Lévêque C., M.N. Bruton & G.W. Ssentongo eds.). 508<br />
p.<br />
270
Ribbink A.J. 1990. Alternative life history styles <strong>of</strong> some <strong>Africa</strong>n cichlid <strong>fish</strong>es. Environ. Biol.<br />
Fish. 28: 87-100.<br />
Ribbink A.J. 1991. Distribution and <strong>ecology</strong> <strong>of</strong> the cichlids <strong>of</strong> the <strong>Africa</strong>n Great <strong>Lake</strong>s, pp. 37-59.<br />
In <strong>Cichlid</strong> <strong>fish</strong>es: behaviour, <strong>ecology</strong> and evolution (M.H.A. Keenleyside ed.). Chapman &<br />
Hall, 378 p.<br />
Ribbink A.J. 1994. <strong>Lake</strong> <strong>Malawi</strong>. Arch. Hydrobiol. Beih. Ergebn. Lmnol. 44: 27-33, Stuttgart.<br />
Ribbink A.J. & D.H. Eccles 1988. Fish communities in the East <strong>Africa</strong>n Great <strong>Lake</strong>s, pp. 277-<br />
301. In Biology and <strong>ecology</strong> <strong>of</strong> <strong>Africa</strong>n freshwater <strong>fish</strong>es (Lévêque C., M.N. Bruton & G.W.<br />
Ssentongo eds.). 508 p.<br />
Ribbink A.J., B.J. Marsh, A.C. Marsh, A.C. Ribbink & B.J. Sharp 1983. A preliminary survey <strong>of</strong><br />
the cichlid <strong>fish</strong>es <strong>of</strong> the rocky habitats <strong>of</strong> <strong>Lake</strong> <strong>Malawi</strong>. S. Afr. J. Zool. 18: 149-310.<br />
Rico C., I. Rico & G. Hewitt 1996. 470 Million years <strong>of</strong> conservation <strong>of</strong> microsatellite loci among<br />
<strong>fish</strong> species. Proc. R. Acad. Lond. B. 263: 549-557.<br />
Rico C., D. Zadworny, U. Kuhnlein & J.G. Fitzgerald 1993. Characterisation <strong>of</strong> microsatellites<br />
loci in the three-spine stickleback Gasterosteus aculeatus. Molec. Ecol. 2, 271-272.<br />
Ricker W.E. 1975. Computation and interpretation <strong>of</strong> biological statistics <strong>of</strong> <strong>fish</strong> populations.<br />
Bull. Fish. Res. Bd. Can. 191: 1-382.<br />
Sargent R.C., P.D. Taylor & M.R. Gross 1987. Parental care and the evolution <strong>of</strong> egg size in<br />
<strong>fish</strong>es. Am. Nat. 129: 32-46.<br />
Scherrer, B. 1984. Biostatistique. Gaëtan Morin, Boucherville. 850 p.<br />
Seehausen O., J.J.M. van Alphen & F. Witte 1997. <strong>Cichlid</strong> <strong>fish</strong> diversity threatened by<br />
eutrophication that curbs sexual selection. Science 277: 1808-1811.<br />
Snoeks J. 1994. <strong>The</strong> Haplochromines (Teleostei, <strong>Cichlid</strong>ae) <strong>of</strong> <strong>Lake</strong> Kivu (East <strong>Africa</strong>). Ann.<br />
Mus. Roy. Afr. Centr., Sc. Zool, 270: 221 p.<br />
Schnute J. 1981. A versatile growth model with statistically stable parameters. Can. J. Fisher.<br />
Aquat. Sci. 38: 1128-1140.<br />
Stiassny M. & A. Meyer 1999. La naissance des espèces. Pour la Science 258: 70-75.<br />
Stauffer J.R. Jr. & K.R. McKaye 1985. Cyrtocara macrocleithrum, a deep-water cichlid<br />
(Teleostei: cichlidae) from <strong>Lake</strong> <strong>Malawi</strong>, <strong>Africa</strong>. Copeia 3: 591-596.<br />
Stearns S.C. 1983. A natural experiment in life history evolution: field data on the introduction <strong>of</strong><br />
mosquito <strong>fish</strong> (Gambusia affinis) to Hawaii. Evolution 37: 601-617.<br />
Stewart K.M. 1988. Change in condition and maturation <strong>of</strong> the Oreochromis niloticus population<br />
<strong>of</strong> Ferguson’s Gulf, <strong>Lake</strong> Turkana, Kenya. J. Fish Biol. 33: 181-188.<br />
Sturmbauer C., W. Mark & R. Dallinger 1992. Ecophysiology <strong>of</strong> aufwuchs eating cichlids in<br />
<strong>Lake</strong> Tanganyika: niche separation by trophic specialisation. Env. Biol. Fish. 35: 283-290.<br />
Sululu R.S.M. 2000. Impact <strong>of</strong> suspended sediments on the abundance and species richness <strong>of</strong> the<br />
sandy-shore dwelling haplochromine cichlids in southwestern <strong>Lake</strong> <strong>Malawi</strong> / Nyassa (East<br />
<strong>Africa</strong>). MSc's <strong>The</strong>sis, Waterloo University, Ontario, Canada.<br />
Tacon P., P. Ndiaye, C. Cauty, F. Le Menn & B. Jalabert 1996. Relationship between the<br />
expression <strong>of</strong> maternal behavior and ovarian development in the mouthbrooding cichlid <strong>fish</strong>,<br />
Oreochromis niloticus. Aquaculture 146: 261-275.<br />
Thompson A. B., E. H. Allison & B. P. Ngatunga 1996. Distribution and breeding biology <strong>of</strong><br />
<strong>of</strong>fshore cichlids in <strong>Lake</strong> <strong>Malawi</strong>/Niassa. Env. Biol. Fish. 47: 235-254.<br />
Thompson A. B., E. H. Allison, B. P. Ngatunga & A. Bulirani 1995. Fish growth and breeding<br />
biology, pp. 279-306. In <strong>The</strong> <strong>fish</strong>eries potential and productivity <strong>of</strong> the pelagic zone <strong>of</strong> <strong>Lake</strong><br />
<strong>Malawi</strong>/Niassa (A. Menz, ed.), SADC/ODA Final Report, 386 p.<br />
Tómasson T. & M.C. Banda, 1996. Depth distribution <strong>of</strong> <strong>fish</strong> species in southern <strong>Lake</strong> <strong>Malawi</strong>.<br />
Implications for <strong>fish</strong>eries management. Government <strong>of</strong> <strong>Malawi</strong>, Fisheries Department,<br />
Fisheries Bulletin 34. 28 p.<br />
Tomassone R. C. Dervin & J.P. Masson 1993. Biométrie: modélisation de phénomènes<br />
biologiques. Masson, Paris. 553 pp.<br />
271
Trewavas E. 1983. Tilapiine <strong>fish</strong>es <strong>of</strong> the genus Sarotherodon, Oreochromis and Danakilia.<br />
British Museum (Natural History), London. 583 p.<br />
Turner G. F. 1994a. Description <strong>of</strong> a commercially important pelagic species <strong>of</strong> the genus<br />
Diplotaxodon (Pisces: <strong>Cichlid</strong>ae) from <strong>Lake</strong> <strong>Malawi</strong>, <strong>Africa</strong>. J. Fish Biol. 44: 799-807.<br />
Turner G.F. 1994b. Fishing and conservation <strong>of</strong> the endemic <strong>fish</strong>es <strong>of</strong> <strong>Lake</strong> <strong>Malawi</strong>. Arch.<br />
Hydrobiol. Beih. Ergebin. Limnol. 44: 481-494.<br />
Turner G.F. 1995. Management, conservation and species changes <strong>of</strong> exploited <strong>fish</strong> stocks in<br />
<strong>Lake</strong> <strong>Malawi</strong>. In <strong>The</strong> impact <strong>of</strong> species changes in <strong>Africa</strong>n lakes. Pitcher T.J. & P.J.B. Hart<br />
(eds.). Chapman & Hall publishers. pp. 365-395.<br />
Turner G.F. 1996. Offshore cichlids <strong>of</strong> <strong>Lake</strong> <strong>Malawi</strong>. <strong>Cichlid</strong> Press. 240 p.<br />
Turner G.F. 1998. Explosive speciation in <strong>Africa</strong>n cichlid <strong>fish</strong>es. In Evolution <strong>of</strong> Biological<br />
Diversity (Magurran A.E. & R.M. May eds.). Oxford University Press, Oxford, UK.<br />
Turner G.F. D. Tweddle & R.D. Makwinja, 1995. Changes in demersal cichlid communities as a<br />
result <strong>of</strong> trawling in southern <strong>Lake</strong> <strong>Malawi</strong>, pp. 397-412.. In: <strong>The</strong> impact <strong>of</strong> species changes in<br />
<strong>Africa</strong>n lakes. Pitcher T.J. & P.J.B. Hart (eds.). Chapman & Hall publishers.<br />
Turner G.F. A.S. Grimm, O.K. Mhonet, R.L. Robinson & T.J. Pitcher 1991a. Reproductive<br />
isolation and the nest sites <strong>of</strong> <strong>Lake</strong> <strong>Malawi</strong> chambo, Oreochromis (Nyasalapia) spp.. J. Fish<br />
Biol. 39: 775-782.<br />
Turner G.F. A.S. Grimm, O.K. Mhonet, R.L. Robinson & T.J. Pitcher 1991b. <strong>The</strong> diet <strong>of</strong><br />
Oreochromis lidole (Trewavas) and other chambo species in <strong>Lake</strong>s <strong>Malawi</strong> and Malombe. J.<br />
Fish Biol. 39: 15-24.<br />
Turner J.L., 1977a. Some effects <strong>of</strong> demersal trawling in <strong>Lake</strong> <strong>Malawi</strong> (<strong>Lake</strong> Nyasa) from 1968<br />
to 1974. J. Fish Biol. 10: 261-272.<br />
Turner J.L., 1977b. Changes in size structure <strong>of</strong> cichlid populations <strong>of</strong> <strong>Lake</strong> <strong>Malawi</strong> resulting<br />
from bottom trawling. J. Fish. Res. Bd. Can. 34: 232-238.<br />
Tweddle D. 1991. Twenty years <strong>of</strong> <strong>fish</strong>eries research in <strong>Lake</strong> <strong>Malawi</strong>. Fisheries Department,<br />
Ministry <strong>of</strong> Forestry & Natural Resources, <strong>Malawi</strong>, Fish. Bulletin 7, 43 p.<br />
Tweddle D. 1992. Conservation and threats to the resources <strong>of</strong> <strong>Lake</strong> <strong>Malawi</strong>. Mitt. Internat.<br />
Verein. Limnol. 23: 17-24.<br />
Tweddle D. & J.L. Turner 1977. Age, growth and natural mortality rates <strong>of</strong> some cichlid <strong>fish</strong>es <strong>of</strong><br />
<strong>Lake</strong> <strong>Malawi</strong>. J. Fish Biol. 10: 385-398.<br />
Tweddle D. & J.H. Magasa 1989. Assessment <strong>of</strong> multispecies cichlid <strong>fish</strong>eries <strong>of</strong> the Southeast<br />
Arm <strong>of</strong> <strong>Lake</strong> <strong>Malawi</strong>, <strong>Africa</strong>. J. cons. Int. Explor. Mer. 45: 209-222.<br />
Ware D.M. 1977. Spawning time and egg size <strong>of</strong> Atlantic Mackerel, Scomber scombrus, in<br />
relation to the plankton. J. Fish. Res. Board Can. 34: 2308-2315.<br />
Waters T.F. 1995. Sediment in streams: sources, biological effects and control. Monograph 7.<br />
Am. Fisher. Soc. Bethesda, Maryland.<br />
Weir B.S.& C.C. Cokerham 1984. Estimating F statistics for the analysis <strong>of</strong> population structure.<br />
Evolution 38: 1358-1370.<br />
Witte F. & W.L.T. van Densen (eds.) 1995.Fish Stocks and Fisheries <strong>of</strong> <strong>Lake</strong> Victoria: A<br />
handbook for field observations. Samara Publishing Ltd., Cardigan (UK). 404 p.<br />
Wootton R.J. 1979. Energy cost <strong>of</strong> egg production and environmental determinants <strong>of</strong> fecundity<br />
in teleost <strong>fish</strong>es. Symp. Zool. Soc. Lond. 44: 133-159.<br />
Wootton R.J. 1990. <strong>The</strong> <strong>ecology</strong> <strong>of</strong> teleost <strong>fish</strong>es. Chapman & Hall, London. 404 pp.<br />
Wootton R.J. 1994. Life histories as sampling devices: optimum egg size in pelagic <strong>fish</strong>es. J. Fish<br />
Biol. 45: 1067-1077.<br />
Wootton R.J. & G.W. Evans 1976. Cost <strong>of</strong> egg production in the three-spined stickleback<br />
(Gasterosteus aculeatus L.). J. Fish Biol 8: 385-395.<br />
Worthington E.B & R. Lowe-McConnell 1994. <strong>Africa</strong>n <strong>Lake</strong>s Reviewed: Creation and<br />
destruction <strong>of</strong> Biodiversity. Environmental Conservation 21(3): 199-213.<br />
272
Wright S. 1969. Evolution and the genetics <strong>of</strong> populations. Vol2: the theory <strong>of</strong> gene frequencies.<br />
University <strong>of</strong> Chicago press, Chicago.<br />
Yamaoka K. 1991. Feeding relationships, pp. 151-172. In <strong>Cichlid</strong> <strong>Fishes</strong>: behaviour, <strong>ecology</strong> and<br />
evolution (Keenleyside M.H.A. ed.). Chapman & Hall, 378p.<br />
Zardoya R., D.M. Vollmer, C. Craddock, J. Streelman, S. Karl & A. Meyer 1996. Evolutionary<br />
conservation <strong>of</strong> microsatellite flanking regions and their use in resolving the phylogeny <strong>of</strong><br />
cichlid <strong>fish</strong>es (Pisces: Perciformes). Proc. R. Acad. Lond. B. 263: 1589-1598.<br />
273
Appendixes
Appendix 1. Date, GPS positioning and depth <strong>of</strong> each trawl transect (TBM), CTD cast (CTD) and Grab sample (GRB) in the SWA between June 1998 and May 1999.<br />
Cruise Sample Gear Date Time Time Latitude (deg) Latitude (min) Latitude (deg) Latitude (min) Longitude (deg) Longitude (min) Longitude (deg) Longitude (min) Bottom depth<br />
Setting Hauling Setting Setting Hauling Hauling Setting Setting Hauling Hauling<br />
38 1 TBM 15/6/98 09:30 09:50 14 0,557 14 1,37 34 35,564 34 35,482 50,5<br />
38 2 GRB 15/6/98 10:23 14 0,83 34 35,607 51<br />
38 3 CTD 15/6/98 10:31 14 0,843 34 35,57 50,8<br />
38 4 TBM 15/6/98 15:45 16:05 13 52,755 13 51,744 34 51,067 34 50,806 128<br />
38 5 GRB 15/6/98 16:46 13 52,121 34 50,938 131<br />
38 6 CTD 15/6/98 17:02 13 52,06 34 50,999 132<br />
38 7 TBM 16/6/98 06:58 07:18 13 57,321 13 56,63 34 43,992 34 43,46 105<br />
38 8 CTD 16/6/98 11:00 13 57,031 34 43,84 105<br />
38 9 GRB 16/6/98 11:12 13 56,9 34 43,813 105<br />
38 10 TBM 16/6/98 13:08 13:32 14 2,061 14 1,02 34 33,966 34 33,84 25,6<br />
38 11 CTD 16/6/98 14:10 14 1,576 34 33,876 31<br />
38 12 GRB 16/6/98 14:17 14 1,639 34 33,807 30,4<br />
38 13 TBM 17/6/98 07:19 07:39 14 0,1 13 59,388 34 37,47 34 36,997 77,6<br />
38 14 CTD 17/6/98 11:30 13 59,905 34 37,393 77<br />
38 15 GRB 17/6/98 11:41 13 59,822 34 37,378 76,9<br />
38 16 TBM 17/6/98 12:37 12:57 14 1,952 14 2,729 34 32,815 34 32,86 10,9<br />
38 17 CTD 17/6/98 13:30 14 2,1 34 32,787 10,7<br />
38 18 GRB 17/6/98 13:40 14 2,095 34 32,757 10,1<br />
39 1 TBM 9/7/98 11:15 11:35 14 1,07 14 2,01 34 33,86 34 33,92 29,8<br />
39 2 GRB 9/7/98 12:00 14 1,53 34 34,05 32,5<br />
39 3 TBM 9/7/98 14:42 15:02 13 32,7 13 51,7 34 51,23 34 50,9 127<br />
39 4 GRB 9/7/98 15:32 13 52,21 34 50,93 130<br />
39 5 TBM 10/7/98 08:16 08:36 13 57,26 13 56,54 34 43,95 34 43,5 103<br />
39 6 GRB 10/7/98 09:05 13 56,97 34 43,73 103<br />
39 7 TBM 10/7/98 11:22 11:42 13 59,35 14 0,29 34 36,97 34 37,67 71,5<br />
39 8 GRB 10/7/98 12:45 13 59,7 34 37,25 74<br />
39 9 CTD 10/7/98 12:15 13 59,78 34 37,28 74<br />
39 10 TBM 10/7/98 14:48 15:08 14 0,34 14 1,56 34 35,61 34 35,46 50<br />
39 11 CTD 10/7/98 15:35 14 0,91 34 35,52 14<br />
39 12 GRB 10/7/98 15:45 14 0,86 34 35,53 49<br />
39 13 CTD 10/7/98 14 1,57 34 33,95 31<br />
39 14 CTD 10/7/98 17:30 13 56,92 34 43,74 10,3<br />
39 16 TBM 11/7/98 11:38 11:58 14 1,77 14 2,71 34 32,83 34 33,01 9<br />
39 17 GRB 11/7/98 12:16 14 2,35 34 32,94 10,3<br />
40 1 TBM 12/8/98 09:43 10:03 14 87 14 203 34 3379 34 3398 29,4<br />
40 2 CTD 12/8/98 10:33 14 150 34 3404 32,1<br />
40 3 GRB 12/8/98 10:40 14 145 34 3403 31,5<br />
40 4 TBM 12/8/98 12:59 13:19 13 5750 13 5650 34 4411 34 4350 103<br />
40 5 CTD 12/8/98 13:49 13 5697 34 4376 103<br />
40 6 GRB 12/8/98 13:56 13 5679 34 4376 103<br />
40 7 TBM 12/8/98 15:31 15:21 13 5290 13 5186 34 5122 34 5091 126
Cruise Sample Gear Date Time Time Latitude (deg) Latitude (min) Latitude (deg) Latitude (min) Longitude (deg) Longitude (min) Longitude (deg) Longitude (min) Bottom depth<br />
Setting Hauling Setting Setting Hauling Hauling Setting Setting Hauling Hauling<br />
40 8 CTD 12/8/98 16:27 13 5217 34 5100 130<br />
40 9 GRB 12/8/98 16:36 13 5212 34 5106 129<br />
40 10 TBM 13/8/98 09:00 09:20 14 18 13 5925 34 3762 34 3685 70<br />
40 11 CTD 13/8/98 09:45 13 5987 34 3735 74<br />
40 12 GRB 13/8/98 09:56 13 5976 34 3734 74<br />
40 13 TBM 13/8/98 11:52 12:12 14 32 14 147 34 3560 34 3551 50<br />
40 14 CTD 13/8/98 12:35 14 88 35 3556 49<br />
40 15 GRB 13/8/98 12:42 14 86 34 3558 49<br />
40 16 TBM 13/8/98 15:11 15:31 14 194 14 304 34 3287 34 3303 10<br />
40 17 CTD 13/8/98 15:55 14 248 34 3288 10<br />
40 18 GRB 13/8/98 16:02 14 247 34 3289 10<br />
43 1 TBM 7/10/98 08:04 08:24 14 0,936 14 1,87 34 32,981 34 33,104 11,3<br />
43 2 CTD 7/10/98 08:48 14 1,822 34 33,092 12,9<br />
43 3 GRB 7/10/98 08:56 14 1,813 34 33,078 12,8<br />
43 4 TBM 7/10/98 10:11 10:31 14 1,366 14 2,238 34 33,874 34 33,736 30,8<br />
43 5 CTD 7/10/98 11:11 14 1,361 34 33,823 29,8<br />
43 6 GRB 7/10/98 11:17 14 1,337 34 33,74 29,7<br />
43 7 TBM 7/10/98 13:45 14:10 14 0,257 14 1,054 34 35,097 34 36,085 43<br />
43 8 CTD 7/10/98 14:50 14 0,741 34 35,773 52,6<br />
43 9 GRB 7/10/98 14:57 14 0,691 34 35,791 52,8<br />
43 10 TBM 7/10/98 15:20 15:40 14 0,603 14 0,349 34 34,325 34 34,088 37<br />
43 11 TBM 8/10/98 06:41 07:01 13 53,379 13 52,737 34 51,465 34 51,692 125<br />
43 12 CTD 8/10/98 07:44 13 52,805 34 51,851 124<br />
43 13 GRB 8/10/98 07:57 13 52,836 34 51,908 124<br />
43 14 TBM 8/10/98 10:23 10:43 13 56,913 13 57,902 34 43,256 34 43,211 103<br />
43 15 TBM 8/10/98 11:22 11:42 13 57,953 13 57,103 34 43,196 34 42,692 99<br />
43 16 CTD 8/10/98 12:49 13 57,529 34 42,968 100<br />
43 17 GRB 8/10/98 12:59 13 57,514 34 42,997 99<br />
43 18 TBM 8/10/98 14:22 14:43 14 0,08 13 59,241 34 37,935 34 37,365 78<br />
43 19 CTD 8/10/98 15:24 13 59,274 34 37,32 75<br />
43 20 GRB 8/10/98 15:26 13 59,258 34 37,342 75,1<br />
49 1 TBM 24/11/98 12:15 12:39 14 0,816 14 2,015 34 33,28 34 33,101 12<br />
49 2 CTD 24/11/98 13:16 14 1,883 34 33,113 13,3<br />
49 3 GRB 24/11/98 13:22 14 1,836 34 33,067 12,1<br />
49 4 GRB 24/11/98 13:35 14 1,764 34 33,055 11,5<br />
49 5 GRB 24/11/98 13:38 14 1,729 34 33,044 11,5<br />
49 6 GRB 24/11/98 13:40 14 1,714 34 33,048 11,5<br />
49 7 GRB 24/11/98 13:42 14 1,706 34 33,035 11,4<br />
49 8 TBM 24/11/98 15:43 16:03 14 1,497 14 2,424 34 34,012 34 34,131 31,9<br />
49 9 CTD 24/11/98 16:38 14 1,772 34 34,11 32,5<br />
49 10 GRB 24/11/98 16:48 14 1,691 34 34,087 32,9<br />
49 11 GRB 24/11/98 16:55 14 1,678 34 34,055 32,5<br />
49 12 GRB 24/11/98 17:00 14 1,652 34 34,028 32,4
Cruise Sample Gear Date Time Time Latitude (deg) Latitude (min) Latitude (deg) Latitude (min) Longitude (deg) Longitude (min) Longitude (deg) Longitude (min) Bottom depth<br />
Setting Hauling Setting Setting Hauling Hauling Setting Setting Hauling Hauling<br />
49 13 GRB 24/11/98 17:04 14 1,633 34 34,022 32,3<br />
49 14 GRB 24/11/98 17:07 14 1,629 34 34,015 32,2<br />
49 15 TBM 25/11/98 06:50 07:11 13 54,576 13 53,607 34 50,421 34 50,081 120<br />
49 16 CTD 25/11/98 07:57 13 53,848 34 50,151 122<br />
49 17 GRB 25/11/98 08:10 13 53,966 34 50,091 121<br />
49 18 GRB 25/11/98 08:21 13 53,107 34 50,053 120<br />
49 19 GRB 25/11/98 08:32 13 54,157 34 50,043 120<br />
49 20 GRB 25/11/98 08:39 13 54,196 34 50,029 120<br />
49 21 GRB 25/11/98 08:46 13 54,257 34 50,014 120<br />
49 32 TBM 26/11/98 09:47 10:09 13 56,718 13 57,521 34 42,626 34 43,056 99<br />
49 33 CTD 26/11/98 10:55 13 57,154 34 43,123 100<br />
49 34 GRB 26/11/98 11:05 13 57,254 34 43,247 101<br />
49 35 GRB 26/11/98 11:13 13 57,311 34 43,33 101<br />
49 36 GRB 26/11/98 11:28 13 57,442 34 43,426 101<br />
49 37 GRB 26/11/98 11:39 13 57,549 34 43,538 101<br />
49 38 GRB 26/11/98 11:45 13 57,553 34 43,579 101<br />
49 39 TBM 26/11/98 13:45 14:07 13 59,547 14 0,487 34 37,449 34 37,308 75<br />
49 40 CTD 26/11/98 14:52 14 0,129 34 37,254 74<br />
49 41 GRB 26/11/98 15:00 14 0,149 34 37,164 72<br />
49 42 GRB 26/11/98 15:07 14 0,125 34 37,15 72<br />
49 43 GRB 26/11/98 15:11 14 0,077 34 37,176 72<br />
49 44 GRB 26/11/98 15:19 14 0,095 34 37,202 72<br />
49 45 GRB 26/11/98 15:24 14 0,082 34 37,217 72<br />
49 46 TBM 26/11/98 15:54 16:14 14 0,269 14 0,031 34 35,827 34 35,489 53<br />
49 47 CTD 26/11/98 16:47 14 0,706 34 35,548 49<br />
49 48 GRB 26/11/98 16:51 14 0,724 34 35,524 49<br />
51 1 TBM 15/12/98 08:00 08:20 14 1,776 14 2,645 34 33,236 34 33,383 14<br />
51 2 CTD 15/12/98 08:50 14 2,042 34 33,286 14<br />
51 3 GRB 15/12/98 08:56 14 1,979 34 33,263 14<br />
51 4 TBM 15/12/98 10:45 11:05 13 57,484 13 56,129 34 43,095 34 43,246 100<br />
51 5 CTD 15/12/98 11:46 13 57,025 34 43,228 103<br />
51 6 GRB 15/12/98 11:58 13 56,894 34 43,192 104<br />
51 7 TBM 15/12/98 14:15 14:35 13 53,256 13 52 34 50,123 34 50,183 125<br />
51 8 CTD 15/12/98 15:21 13 52,9 34 50,26 126<br />
51 9 GRB 15/12/98 15:36 13 52,983 34 50,346 126<br />
51 10 TBM 16/12/98 05:50 06:10 14 0,125 13 59,455 34 39,117 34 38,533 80<br />
51 11 CTD 16/12/98 06:57 13 59,911 34 38,873 80<br />
51 12 GRB 16/12/98 07:00 13 59,91 34 38,867 80<br />
51 13 TBM 16/12/98 09:42 10:02 14 0,734 14 1,32 34 35,882 34 35,188 53<br />
51 14 CTD 16/12/98 10:34 14 0,807 34 35,369 49<br />
51 15 GRB 16/12/98 10:40 14 0,866 34 35,348 49<br />
51 16 TBM 16/12/98 12:16 12:36 14 1,198 14 1,532 34 34,105 34 34,511 31<br />
51 17 CTD 16/12/98 14:06 14 1,199 34 34,049 31
Cruise Sample Gear Date Time Time Latitude (deg) Latitude (min) Latitude (deg) Latitude (min) Longitude (deg) Longitude (min) Longitude (deg) Longitude (min) Bottom depth<br />
Setting Hauling Setting Setting Hauling Hauling Setting Setting Hauling Hauling<br />
51 18 GRB 16/12/98 14:12 14 1,233 34 33,911 31<br />
52 1 TBM 27/1/99 08:07 08:27 14 1,705 14 2,534 34 33,153 34 33,271 14<br />
52 2 ZOO 27/1/99 09:02 14 1,952 34 33,136 13<br />
52 3 GRB 27/1/99 09:07 14 2,014 34 33,132 13<br />
52 4 GRB 27/1/99 09:17 14 2,014 34 33,132 13<br />
52 5 GRB 27/1/99 09:20 14 2,014 34 33,132 13<br />
52 6 GRB 27/1/99 09:25 14 2,014 34 33,132 13<br />
52 7 GRB 27/1/99 09:30 14 2,014 34 33,132 13<br />
52 8 GRB 27/1/99 09:35 14 2,014 34 33,132 13<br />
52 9 CTD 27/1/99 09:40 14 2,014 34 33,132 13<br />
52 10 TBM 27/1/99 11:34 11:54 13 58,042 13 57,306 34 43,25 34 43,763 100<br />
52 11 CTD 27/1/99 12:50 13 57,644 34 43,538 101<br />
52 12 ZOO 27/1/99 12:59 13 57,567 34 43,494 100<br />
52 13 GRB 27/1/99 13:15 13 57,524 34 43,454 101<br />
52 14 GRB 27/1/99 13:24 13 57,504 34 43,392 101<br />
52 15 GRB 27/1/99 13:32 13 57,496 34 43,338 101<br />
52 16 GRB 27/1/99 13:39 13 57,469 34 43,293 101<br />
52 17 GRB 27/1/99 13:46 13 57,47 34 43,295 101<br />
52 18 GRB 27/1/99 13:51 13 57,486 34 43,191 101<br />
52 19 TBM 27/1/99 15:26 15:46 13 52,658 13 51,835 34 50,347 34 50,4 127<br />
52 20 CTD 27/1/99 16:31 13 52,235 34 50,324 128<br />
52 21 ZOO 27/1/99 16:48 13 52,202 34 50,284 129<br />
52 22 GRB 27/1/99 17:01 13 52,171 34 50,211 129<br />
52 23 GRB 27/1/99 17:14 13 52,216 34 50,158 128<br />
52 24 GRB 27/1/99 17:25 13 52,176 34 50,168 128<br />
52 25 GRB 27/1/99 17:32 13 52,156 34 50,155 128<br />
52 26 GRB 27/1/99 17:36 13 52,208 34 50,09 128<br />
52 27 GRB 27/1/99 17:42 13 52,205 34 50,053 128<br />
52 28 TBM 28/1/99 06:36 06:56 13 59,906 13 59,247 34 37,979 34 37,503 77<br />
52 29 CTD 28/1/99 07:36 13 59,615 34 37,781 78<br />
52 30 ZOO 28/1/99 07:44 13 59,721 34 37,87 77<br />
52 31 GRB 28/1/99 08:02 13 59,719 34 37,807 77<br />
52 32 GRB 28/1/99 08:07 13 59,754 34 37,801 77<br />
52 33 GRB 28/1/99 08:14 13 59,752 34 37,782 77<br />
52 34 GRB 28/1/99 08:20 13 59,752 33 37,73 77<br />
52 35 GRB 28/1/99 08:27 13 59,702 33 37,69 77<br />
52 36 TBM 28/1/99 09:22 09:42 14 1,896 14 0,895 34 34,055 34 33,851 31<br />
52 37 CTD 28/1/99 10:20 14 1,495 34 34,113 33<br />
52 38 ZOO 28/1/99 10:29 14 1,398 34 34,044 32<br />
52 39 GRB 28/1/99 10:37 14 1,317 34 34,054 32<br />
52 40 GRB 28/1/99 10:41 14 1,308 34 34,057 32<br />
52 41 GRB 28/1/99 10:45 14 1,284 34 34,281 31<br />
52 42 GRB 28/1/99 10:48 14 1,269 34 34,033 31
Cruise Sample Gear Date Time Time Latitude (deg) Latitude (min) Latitude (deg) Latitude (min) Longitude (deg) Longitude (min) Longitude (deg) Longitude (min) Bottom depth<br />
Setting Hauling Setting Setting Hauling Hauling Setting Setting Hauling Hauling<br />
52 43 GRB 28/1/99 10:51 14 1,245 34 34,042 31<br />
52 44 GRB 28/1/99 10:54 14 1,224 34 34,009 31<br />
52 45 TBM 28/1/99 12:00 12:20 14 0,218 14 1,153 34 35,531 34 35,807 48<br />
52 46 CTD 28/1/99 12:59 14 0,931 34 35,607 49<br />
52 47 ZOO 28/1/99 13:07 14 0,891 34 35,527 49<br />
52 48 GRB 28/1/99 13:17 14 0,881 34 35,393 49<br />
52 49 GRB 28/1/99 13:23 14 0,878 34 35,342 49<br />
52 50 GRB 28/1/99 13:28 14 0,87 34 35,263 49<br />
52 51 GRB 28/1/99 13:31 14 0,858 34 35,244 47<br />
52 52 GRB 28/1/99 13:34 14 0,86 34 35,202 47<br />
52 53 GRB 28/1/99 13:38 14 0,865 34 35,2 47<br />
52 54 GRB 28/1/99 14:38 13 58,95 34 36,8 53<br />
52 55 GRB 28/1/99 14:48 13 55,957 34 36,649 52<br />
53 1 TBM 16/2/99 08:46 09:06 14 2,878 14 2,184 34 33,415 34 32,954 13<br />
53 2 CTD 16/2/99 09:44 14 2,604 34 32,221 13<br />
53 3 GRB 16/2/99 09:48 14 2,604 34 32,221 13<br />
53 4 GRB 16/2/99 09:51 14 2,604 34 32,221 13<br />
53 5 GRB 16/2/99 09:53 14 2,604 34 32,221 13<br />
53 6 GRB 16/2/99 09:57 14 2,604 34 32,221 13<br />
53 7 GRB 16/2/99 09:59 14 2,604 34 32,221 13<br />
53 8 TBM 16/2/99 11:46 12:06 14 2,162 14 1,321 34 34,101 34 33,982 29<br />
53 9 CTD 16/2/99 12:59 14 1,69 34 33,942 32<br />
53 10 GRB 16/2/99 13:07 14 1,602 34 33,953 32<br />
53 11 GRB 16/2/99 13:12 14 1,617 34 34,039 32<br />
53 12 GRB 16/2/99 13:14 14 1,575 34 34,045 32<br />
53 13 GRB 16/2/99 13:17 14 1,595 34 33,999 32<br />
53 14 GRB 16/2/99 13:21 14 1,554 34 33,987 32<br />
53 15 TBM 16/2/99 13:59 14:19 14 1,427 14 0,579 34 35,341 34 35,344 49<br />
53 16 CTD 16/2/99 14:53 14 1,096 34 35,38 48<br />
53 17 GRB 16/2/99 14:58 14 1,091 34 35,323 48<br />
53 18 TBM 17/2/99 06:27 06:47 13 54,036 13 53,341 34 51,227 34 51,394 122<br />
53 19 CTD 17/2/99 07:35 13 53,536 34 51,284 124<br />
53 20 GRB 17/2/99 07:43 13 53,579 34 51,177 124<br />
53 21 GRB 17/2/99 07:58 13 53,577 34 51,153 124<br />
53 22 GRB 17/2/99 08:07 13 53,581 34 51,09 124<br />
53 23 GRB 17/2/99 08:16 13 53,621 34 51,021 124<br />
53 25 TBM 17/2/99 09:59 10:19 13 57,167 13 56,289 34 43,671 34 43,253 101<br />
53 26 CTD 17/2/99 11:01 13 56,577 34 43,462 104<br />
53 27 GRB 17/2/99 11:10 13 56,562 34 43,459 104<br />
53 28 TBM 17/2/99 12:25 12:45 13 59,345 14 0,196 34 37,522 34 37,422 76<br />
53 29 CTD 17/2/99 13:28 13 59,812 34 37,468 75<br />
53 30 GRB 17/2/99 13:35 13 59,762 34 37,425 75<br />
53 31 GRB 17/2/99 13:42 13 59,714 34 37,413 75
Cruise Sample Gear Date Time Time Latitude (deg) Latitude (min) Latitude (deg) Latitude (min) Longitude (deg) Longitude (min) Longitude (deg) Longitude (min) Bottom depth<br />
Setting Hauling Setting Setting Hauling Hauling Setting Setting Hauling Hauling<br />
53 32 GRB 17/2/99 13:46 13 59,681 34 37,383 75<br />
53 33 GRB 17/2/99 13:52 13 59,647 34 37,383 75<br />
53 34 GRB 17/2/99 13:58 13 59,668 34 37,383 75<br />
53 35 TBM 17/2/99 18:38 18:58 13 38,993 13 38,013 34 40,343 34 40,219 126<br />
55 1 TBM 19/3/99 10:45 11:05 14 0,416 14 1,148 34 33,158 34 33,159 16<br />
55 2 CTD 19/3/99 11:37 14 0,922 34 33,138 17<br />
55 3 GRB 19/3/99 11:41 14 0,861 34 33,068 15,7<br />
55 4 GRB 19/3/99 11:44 14 0,84 34 33,081 15,5<br />
55 5 TBM 19/3/99 13:36 13:56 13 57,936 13 57,112 34 43,265 34 43,549 101<br />
55 6 CTD 19/3/99 14:30 13 57,088 34 43,264 102<br />
55 7 GRB 19/3/99 14:43 13 57,119 34 43,159 102<br />
55 8 GRB 19/3/99 14:50 13 57,138 34 43,11 102<br />
55 9 TBM 19/3/99 16:22 16:42 13 53,576 13 52,972 34 49,441 34 49,692 122<br />
55 10 CTD 19/3/99 17:28 13 53,378 34 49,582 122<br />
55 11 GRB 19/3/99 17:40 13 53,489 34 49,52 122<br />
55 12 GRB 19/3/99 17:46 13 53,57 34 49,508 122<br />
55 13 TBM 20/3/99 05:55 06:15 14 0,494 13 59,743 34 38,168 34 37,736 79<br />
55 14 CTD 20/3/99 06:50 13 59,797 34 37,541 79<br />
55 15 GRB 20/3/99 07:03 13 59,8 34 37,433 78<br />
55 16 GRB 20/3/99 07:09 13 59,87 34 37,523 78,5<br />
55 17 TBM 20/3/99 08:31 08:51 14 1,119 14 0,246 34 35,708 34 35,555 51,1<br />
55 18 CTD 20/3/99 09:25 14 0,755 34 35,623 50,1<br />
55 19 GRB 20/3/99 09:32 14 0,686 34 35,576 50<br />
55 20 GRB 20/3/99 09:35 14 0,658 34 35,573 49,7<br />
55 21 TBM 20/3/99 11:37 11:57 14 2,193 14 1,455 34 34,066 34 33,821 27,8<br />
55 22 CTD 20/3/99 12:38 14 1,658 34 33,862 30,3<br />
55 23 GRB 20/3/99 12:42 14 1,648 34 33,804 29,8<br />
55 24 GRB 20/3/99 12:47 14 1,648 34 33,794 29,8<br />
57 1 TBM 14/4/99 09:00 09:20 14 0,589 14 1,372 34 33,157 34 33,062 19<br />
57 2 CTD 14/4/99 09:55 14 1,258 34 33,072 11<br />
57 3 GRB 14/4/99 09:59 14 1,258 34 33,072 11<br />
57 4 GRB 14/4/99 10:03 14 1,258 34 33,072 11<br />
57 5 GRB 14/4/99 10:06 14 1,258 34 33,072 11<br />
57 6 GRB 14/4/99 10:09 14 1,258 34 33,072 11<br />
57 7 GRB 14/4/99 10:12 14 1,258 34 33,072 11<br />
57 8 GRB 14/4/99 10:15 14 1,258 34 33,072 11<br />
57 9 TBM 14/4/99 11:32 11:52 14 0,29 13 59,505 34 37,584 34 37,536 77<br />
57 10 CTD 14/4/99 12:25 13 59,451 34 37,481 76<br />
57 11 GRB 14/4/99 12:37 13 59,376 34 37,367 76<br />
57 12 GRB 14/4/99 12:45 13 59,357 34 37,311 75<br />
57 13 GRB 14/4/99 12:51 13 59,321 34 37,269 75<br />
57 14 GRB 14/4/99 12:56 13 59,273 34 37,228 75<br />
57 15 GRB 14/4/99 13:01 13 59,227 34 37,177 75
Cruise Sample Gear Date Time Time Latitude (deg) Latitude (min) Latitude (deg) Latitude (min) Longitude (deg) Longitude (min) Longitude (deg) Longitude (min) Bottom depth<br />
Setting Hauling Setting Setting Hauling Hauling Setting Setting Hauling Hauling<br />
57 16 GRB 14/4/99 13:09 13 59,145 34 37,115 74<br />
57 17 TBM 14/4/99 14:20 14:40 14 0,835 14 0,087 34 35,732 34 35,643 52<br />
57 18 CTD 14/4/99 15:10 14 0,404 34 35,59 51<br />
57 19 GRB 14/4/99 15:16 14 0,291 34 35,474 50<br />
57 20 GRB 14/4/99 15:20 14 0,276 34 35,455 49<br />
57 21 TBM 15/4/99 06:10 06:30 13 53,878 13 53,063 34 50,216 34 50,084 122<br />
57 22 TBM 15/4/99 09:30 09:50 13 57,584 13 56,776 34 43,46 34 43,555 102<br />
57 23 CTD 15/4/99 10:34 13 57,11 34 43,608 104<br />
57 24 GRB 15/4/99 10:40 13 57,104 34 43,617 104<br />
57 25 GRB 15/4/99 10:51 13 57,051 34 43,676 104<br />
57 26 TBM 15/4/99 12:45 13:05 14 1,934 14 1,116 34 33,983 34 33,593 32<br />
57 27 CTD 15/4/99 13:40 14 1,068 34 33,639 29<br />
57 28 GRB 15/4/99 13:43 14 1,068 34 33,639 29<br />
57 29 GRB 15/4/99 13:46 14 1,068 34 33,639 29<br />
57 30 GRB 15/4/99 13:52 14 1,068 34 33,639 29<br />
57 31 GRB 15/4/99 13:55 14 1,068 34 33,639 29<br />
57 32 GRB 15/4/99 14:00 14 1,068 34 33,639 29<br />
57 33 GRB 15/4/99 14:03 14 1,068 34 33,639 29<br />
58 1 TBM 20/5/99 07:38 07:59 14 0,135 14 0,973 34 33,096 34 33,056 14<br />
58 2 CTD 20/5/99 08:25 14 0,545 34 33,001 13<br />
58 3 GRB 20/5/99 08:29 14 0,545 34 33,002 13<br />
58 4 GRB 20/5/99 08:38 14 0,545 34 33,002 13<br />
58 5 GRB 20/5/99 08:40 14 0,545 34 33,002 13<br />
58 6 GRB 20/5/99 08:45 14 0,545 34 33,002 13<br />
58 7 GRB 20/5/99 08:47 14 0,545 34 33,002 13<br />
58 8 TBM 20/5/99 10:03 10:23 14 0,5 14 1,443 34 35,674 34 35,719 51<br />
58 9 CTD 20/5/99 10:49 14 1,007 34 35,468 51<br />
58 10 GRB 20/5/99 10:58 14 0,865 34 35,418 51<br />
58 11 TBM 20/5/99 12:52 13:12 13 57,24 13 56,471 34 43,255 34 43,66 102<br />
58 12 CTD 20/5/99 13:50 13 56,908 34 43,591 105<br />
58 13 GRB 20/5/99 14:00 13 56,895 34 43,675 106<br />
58 14 TBM 20/5/99 15:26 15:46 13 53,242 13 52,565 34 51,348 34 51,762 127<br />
58 15 CTD 20/5/99 16:28 13 52,742 34 51,764 125<br />
58 16 GRB 20/5/99 16:42 13 52,702 34 51,861 124<br />
58 17 GRB 20/5/99 16:53 13 52,698 34 51,938 124<br />
58 18 GRB 20/5/99 17:03 13 52,741 34 52,014 123<br />
58 19 GRB 20/5/99 17:26 13 52,675 34 52,163 122<br />
58 20 TBM 21/5/99 06:07 06:27 14 0,117 13 59,401 34 37,765 34 37,342 78<br />
58 21 CTD 21/5/99 07:00 13 59,391 34 37,454 76<br />
58 22 GRB 21/5/99 07:08 13 59,288 34 37,478 77<br />
58 23 GRB 21/5/99 07:15 13 59,232 34 37,466 77<br />
58 24 GRB 21/5/99 07:21 13 59,223 34 37,449 77<br />
58 25 GRB 21/5/99 07:27 13 59,176 34 37,404 76
Cruise Sample Gear Date Time Time Latitude (deg) Latitude (min) Latitude (deg) Latitude (min) Longitude (deg) Longitude (min) Longitude (deg) Longitude (min) Bottom depth<br />
Setting Hauling Setting Setting Hauling Hauling Setting Setting Hauling Hauling<br />
58 26 GRB 21/5/99 07:33 13 59,176 34 37,381 76<br />
58 27 TBM 21/5/99 08:29 08:49 14 1,707 14 0,901 34 34,036 34 33,537 33<br />
58 28 CTD 21/5/99 09:19 14 0,983 34 33,663 30<br />
58 29 GRB 21/5/99 09:25 14 0,967 34 33,642 30<br />
58 30 GRB 21/5/99 09:28 14 0,923 34 33,731 30<br />
58 31 GRB 21/5/99 09:31 14 0,875 34 33,72 29<br />
58 32 GRB 21/5/99 09:34 14 0,86 34 33,783 29<br />
58 33 GRB 21/5/99 09:42 14 0,851 34 33,794 29
Appendix 2. List <strong>of</strong> <strong>fish</strong> species caught by trawling in the SWA.<br />
Alticorpus 'ge<strong>of</strong>freyi'<br />
Alticorpus macrocleithrum<br />
Alticorpus mentale<br />
Alticorpus pectinatum<br />
Alticorpus spp.<br />
Aristochromis christyi<br />
Aulonocara 'blue orange'<br />
Aulonocara 'copper'<br />
Aulonocara guentheri<br />
Aulonocara 'long'<br />
Aulonocara 'cf. macrochir'<br />
Aulonocara 'minutus'<br />
Aulonocara rostratum<br />
Aulonocara 'rostratum deep'<br />
Aulonocara spp.<br />
Bagrus meridionalis<br />
Barbus eurystomus<br />
Barbus johnstonii<br />
Barbus litamba<br />
Bathyclarias spp.<br />
Buccochromis lepturus<br />
Buccochromis nototaenia<br />
Buccochromis rhoadesi<br />
Buccochromis 'small'<br />
Caprichromis liemi<br />
Champsochromis caeruleus<br />
Chilotilapia rhoadesi<br />
Copadichromis inornatus<br />
Copadichromis quadrimaculatus<br />
Copadichromis trimaculatus<br />
Copadichromis virginalis<br />
Copadichromis spp.<br />
Corematodus taeniatus<br />
Ctenopharynx nitidus<br />
Ctenopharynx pictus<br />
Dimidiochromis sp.<br />
Diplotaxodon apogon<br />
Diplotaxodon argenteus<br />
Diplotaxodon macrops<br />
Diplotaxodon 'brevimaxillaris'<br />
Diplotaxodon greenwoodi<br />
Diplotaxodon limnothrissa<br />
Diplotaxodon 'similis'<br />
Diplotaxodon spp.<br />
Docimodus johnstonii<br />
Engraulicypris sardella<br />
Exocochromis anagenis<br />
Haplochromis 'sp.'<br />
Hemitaeniochromis 'insignis'<br />
Hemitaeniochromis urotaenia<br />
Hemitilapia oxyrhynchus<br />
Lethrinops albus<br />
Lethrinops altus<br />
Lethrinops argenteus<br />
Lethrinops 'blue orange'<br />
Lethrinops 'cf. auritus'<br />
Lethrinops christyi<br />
Lethrinops dark<br />
Lethrinops 'deep water albus'<br />
Lethrinops 'deep water altus'<br />
Lethrinops 'cf. furcifer'<br />
Lethrinops gossei<br />
Lethrinops 'grey'<br />
Lethrinops lethrinus<br />
Lethrinops longimanus<br />
Lethrinops longipinnis<br />
Lethrinops macrochir<br />
Lethrinops 'macrostoma'<br />
Lethrinops 'matumbae'<br />
Lethrinops microdon<br />
Lethrinops 'minutus'<br />
Lethrinops mylodon<br />
Lethrinops 'oliveri'<br />
Lethrinops 'cf. parvidens'<br />
Lethrinops 'pink head'<br />
Lethrinops polli<br />
Lethrinops stridei<br />
Lethrinops 'yellow chin'<br />
Lethrinops spp.<br />
Mormyrus longirostris<br />
Mylochromis anaphyrmus<br />
Mylochromis formosus<br />
Mylochromis gracilis<br />
Mylochromis melanonotus<br />
Mylochromis sphaerodon<br />
Mylochromis spilostichus<br />
Mylochromis 'torpedo'<br />
Mylochromis spp.<br />
Nevochromis chrysogaster<br />
Nimbochromis livingstonii<br />
Nimbochromis polystigma<br />
Nimbochromis venustus<br />
Nyassachromis argyrosoma<br />
Nyassachromis eucynostomus<br />
Nyassachromis spp.<br />
Opsaridium microcephallus<br />
Opsaridium microlepis<br />
Oreochromis spp.<br />
Otopharynx argyrosoma<br />
Otopharynx auromarginatus<br />
Otopharynx brooksi<br />
Otopharynx 'productus'<br />
Otopharynx decorus<br />
Otopharynx speciosus<br />
Otopharynx spp.<br />
Pallidochromis tokolosh<br />
Placidochromis 'acuticeps'<br />
Placidochromis "flatjaws"<br />
Placidochromis 'hennydaviesae III'<br />
Placidochromis 'hennydaviesae IV'<br />
Placidochromis johnstonii<br />
Placidochromis long<br />
Placidochromis 'macrognathus'<br />
Placidochromis 'platyrhynchos'<br />
Placidochromis 'cf. subocularis'<br />
Placidochromis spp.<br />
Protomelas triaenodon<br />
Protomelas spilopterus<br />
Pseudotropheus elegans<br />
Pseudotropheus lanisticola<br />
Pseudotropheus livingstonii<br />
Pseudotropheus spp.<br />
Rhamphochromis spp.<br />
Sciaenochromis alhi<br />
Sciaenochromis benthicola<br />
Sciaenochromis psammophilus<br />
Sciaenochromis spp.<br />
Serranochromis robustus<br />
Stigmatochromis pholidophorus<br />
Stigmatochromis woodi<br />
Stigmatochromis 'guttatus'<br />
Synodontis njassae<br />
Taeniochromis holotaenia<br />
Taeniolethrinops furcicauda<br />
Taeniolethrinops laticeps<br />
Taeniolethrinops praeorbitalis<br />
Tramitichromis lituris<br />
Trematocranus brevirostris<br />
Trematocranus macrostoma<br />
Trematocranus placodon<br />
Unknown spp.
Appendix 3. Mean CPUE (kg / 20min pull) per depth for each species over the<br />
sampling period (July-1998 to May-1999).<br />
Species 10m 30m 50m 75m 100m 125m<br />
Alticorpus spp. - 0,2 0,1 1,0 0,9 1,2<br />
Alticorpus 'ge<strong>of</strong>freyi' - - 0,3 21,4 3,5 6,1<br />
Alticorpus macrocleithrum - - - 0,9 2,5 0,4<br />
Alticorpus mentale - 0,0 0,7 12,2 21,9 13,4<br />
Alticorpus pectinatum - - - 2,8 2,8 1,7<br />
Aristochromis christyi 0,1 0,0 - - - -<br />
Aulonocara 'cf. macrochir' 0,0 0,1 1,7 - - -<br />
Aulonocara spp. 0,2 - 0,2 0,5 0,0 1,1<br />
Aulonocara 'blue orange' 5,6 5,6 0,5 - - -<br />
Aulonocara 'copper' - - - 0,4 - -<br />
Aulonocara guentheri 0,9 0,1 - - - -<br />
Aulonocara 'long' 0,0 - 0,0 0,2 0,1 0,2<br />
Aulonocara 'minutus' - - - 1,4 0,9 1,7<br />
Aulonocara rostratum 0,0 - - - - -<br />
Aulonocara 'rostratum deep' - - 0,1 1,0 0,1 0,3<br />
Bagrus meridionalis 9,6 12,9 17,8 13,0 5,6 4,3<br />
Barbus eurystomus 0,0 0,1 - - - -<br />
Barbus johnstonii - 0,2 - - - -<br />
Barbus litamba - - 0,1 - - -<br />
Bathyclarias spp. 11,3 10,4 49,8 23,1 19,7 9,3<br />
Buccochromis lepturus 3,7 0,6 - - - -<br />
Buccochromis nototaenia 1,0 2,3 0,1 - - -<br />
Buccochromis rhoadesi 0,5 0,1 - - - -<br />
Buccochromis 'small' 0,0 - - - - -<br />
Caprichromis liemi - 0,0 0,0 - - -<br />
Champsochromis caeruleus 0,1 0,1 - - - -<br />
Chilotilapia rhoadesi 1,4 1,1 - - - -<br />
Copadichromis inornatus 0,1 - - - - -<br />
Copadichromis quadrimaculatus 0,9 2,6 1,1 0,1 - -<br />
Copadichromis spp. 0,1 0,0 - - - -<br />
Copadichromis trimaculatus - - - - - 0,0<br />
Copadichromis virginalis 0,7 16,7 47,7 - 0,1 -<br />
Corematodus taeniatus 0,0 0,0 0,0 0,0 - -<br />
Ctenopharynx nitidus 0,2 0,1 - - - -<br />
Ctenopharynx pictus - - 0,1 - - -<br />
Dimidiochromis sp. 0,0 - - - - -<br />
Diplotaxodon apogon - - - 5,0 5,4 4,0<br />
Diplotaxodon argenteus - - 1,0 4,4 2,9 2,2<br />
Diplotaxodon spp. - - - 0,3 0,5 0,5<br />
Diplotaxodon 'brevimaxillaris' - - 0,0 0,1 0,2 0,6<br />
Diplotaxodon greenwoodi - - - 0,1 0,3 0,2<br />
Diplotaxodon limnothrissa 0,1 - 9,7 13,4 9,3 2,7<br />
Diplotaxodon macrops - - - 7,3 18,9 16,0<br />
Diplotaxodon 'similis' - - - 0,0 - 0,1<br />
Docimodus johnstonii 0,1 0,0 0,3 - - -<br />
Engraulicypris sardella 0,0 0,0 - 0,0 0,0 -<br />
Exocochromis anagenis - - 0,0 - - -<br />
Haplochromis 'sp.' - - 0,0 - - -<br />
Hemitaeniochromis 'insignis' - - 0,0 0,1 0,0 0,1<br />
Hemitaeniochromis urotaenia 0,1 - 0,0 - - -<br />
Hemitilapia oxyrhynchus - - - - - -<br />
Lethrinops christyi 0,3 0,0 1,0 - - -<br />
Lethrinops 'matumbae' - 1,0 0,0 - - -<br />
Lethrinops 'deep water albus' - - 1,4 3,5 0,0 4,8
Species 10m 30m 50m 75m 100m 125m<br />
Lethrinops albus - - 0,2 0,0 - 0,6<br />
Lethrinops altus 0,2 2,6 2,1 1,8 1,4 4,6<br />
Lethrinops spp. 1,0 0,1 2,0 0,5 0,1 0,4<br />
Lethrinops 'blue orange' - 0,6 - - - -<br />
Lethrinops 'cf. auritus' 0,0 - - - - -<br />
Lethrinops dark 2,6 0,3 4,1 0,3 0,3 1,5<br />
Lethrinops 'deep water altus' - - - 1,0 4,7 2,2<br />
Lethrinops 'cf. furcifer' 1,1 0,1 - - - -<br />
Lethrinops gossei - - 0,2 32,0 40,0 34,4<br />
Lethrinops 'grey' - - - - 1,0 -<br />
Lethrinops lethrinus 0,2 - - - - -<br />
Lethrinops longimanus - 0,5 7,3 0,2 1,1 0,1<br />
Lethrinops argenteus 20,3 23,9 40,7 0,1 0,0 0,2<br />
Lethrinops macrochir 3,5 - - - - -<br />
Lethrinops 'macrostoma' - - - 0,0 - -<br />
Lethrinops microdon 1,0 - 0,1 0,0 0,0 -<br />
Lethrinops 'minutus' 0,0 - 3,5 - - -<br />
Lethrinops mylodon - 0,2 0,1 - 0,2 -<br />
Lethrinops 'oliveri' - - - 18,2 8,3 3,6<br />
Lethrinops 'cf. parvidens' 0,4 0,0 0,1 - - -<br />
Lethrinops 'pink head' 0,2 - - - - -<br />
Lethrinops polli - - - 7,0 1,2 0,2<br />
Lethrinops stridei - - - - 0,0 -<br />
Lethrinops 'yellow chin' - - 0,9 - - -<br />
Mormyrus longirostris - - - - - 0,1<br />
Mylochromis anaphyrmus 4,6 8,6 2,3 0,0 - -<br />
Mylochromis formosus 0,1 0,1 0,2 - - -<br />
Mylochromis gracilis - 0,2 0,2 0,5 - -<br />
Mylochromis spp. 0,2 0,1 - - - -<br />
Mylochromis melanonotus 0,3 0,2 - - - -<br />
Mylochromis sphaerodon 0,0 0,0 - - - -<br />
Mylochromis spilostichus 0,4 0,5 7,4 - - -<br />
Mylochromis 'torpedo' 0,0 - - - - -<br />
Nevochromis chrysogaster 0,0 - - - - -<br />
Nimbochromis livingstonii 0,1 0,0 0,2 0,1 - -<br />
Nimbochromis venustus 0,0 - - - - -<br />
Nyassachromis argyrosoma 28,6 31,7 0,9 - - -<br />
Nyassachromis spp. 0,5 0,3 - - - -<br />
Nyassachromis eucynostomus 0,5 0,1 - - - -<br />
Nimbochromis polystigma 0,0 - - - - -<br />
Opsaridium microcephallus - 0,0 - - - -<br />
Opsaridium microlepis - 0,0 0,7 0,2 - -<br />
Oreochromis spp. 27,7 1,1 7,8 0,1 - -<br />
Otopharynx argyrosoma 2,2 2,2 0,1 - - -<br />
Otopharynx auromarginatus - - - - - -<br />
Otopharynx brooksi - - - 0,5 0,0 0,0<br />
Otopharynx 'productus' 0,7 0,0 - - - -<br />
Otopharynx decorus 0,4 0,4 - - - -<br />
Otopharynx spp. 0,2 - - - - 0,0<br />
Otopharynx speciosus - 0,8 2,1 0,1 - -<br />
Pallidochromis tokolosh - - 0,1 1,8 0,6 2,9<br />
Placidochromis 'acuticeps' - - - - - 0,1<br />
Placidochromis "flatjaws" - - - 0,0 1,3 0,3<br />
Placidochromis spp. - - 0,0 0,3 0,0 -<br />
Placidochromis 'macrognathus' - 0,0 0,0 0,0 0,0 0,1<br />
Placidochromis 'hennydaviesae III' - - - - - 0,1<br />
Placidochromis 'hennydaviesae IV' - - - - - 0,1<br />
Placidochromis johnstonii - 0,0 - - - -
Species 10m 30m 50m 75m 100m 125m<br />
Placidochromis 'long' - 0,4 1,7 - - -<br />
Placidochromis 'platyrhynchos' - - - 0,0 1,1 4,1<br />
Placidochromis 'cf. subocularis' 0,1 0,0 - - - -<br />
Protomelas spilopterus 0,0 0,0 - - - -<br />
Protomelas triaenodon 0,0 - - - - -<br />
Pseudotropheus elegans 0,1 0,1 - - - -<br />
Pseudotropheus lanisticola - - - - - -<br />
Pseudotropheus livingstonii 1,1 0,1 - - - -<br />
Pseudotropheus spp. - 0,0 - - - -<br />
Rhamphochromis spp. 0,6 3,9 8,5 4,2 0,7 0,6<br />
Sciaenochromis spp. 0,1 0,0 0,0 - - -<br />
Sciaenochromis alhi 0,4 0,1 0,1 0,3 0,2 0,2<br />
Sciaenochromis benthicola 0,1 0,5 3,1 1,4 0,2 0,0<br />
Sciaenochromis psammophilus - - - 0,1 - -<br />
Serranochromis robustus 0,1 - - - - -<br />
Stigmatochromis pholidophorus 0,0 - - - - -<br />
Stigmatochromis woodi 0,0 0,0 0,1 0,0 - 0,0<br />
Stigmatochromis 'guttatus' 0,0 - 0,5 0,3 0,0 0,0<br />
Synodontis njassae 2,5 7,2 8,8 6,4 11,8 11,7<br />
Taeniochromis holotaenia 0,0 0,0 - - - -<br />
Taeniolethrinops furcicauda 1,3 0,0 - - - -<br />
Taeniolethrinops laticeps - 0,2 - - - -<br />
Taeniolethrinops praeorbitalis 1,1 0,3 - - - -<br />
Tramitichromis lituris 0,8 - - - - -<br />
Trematocranus brevirostris - 0,0 6,6 - - -<br />
Trematocranus macrostoma 0,0 - - - - -<br />
Trematocranus placodon 1,3 - - - - -<br />
Minimum number <strong>of</strong> species per depth 80 71 66 58 47 48