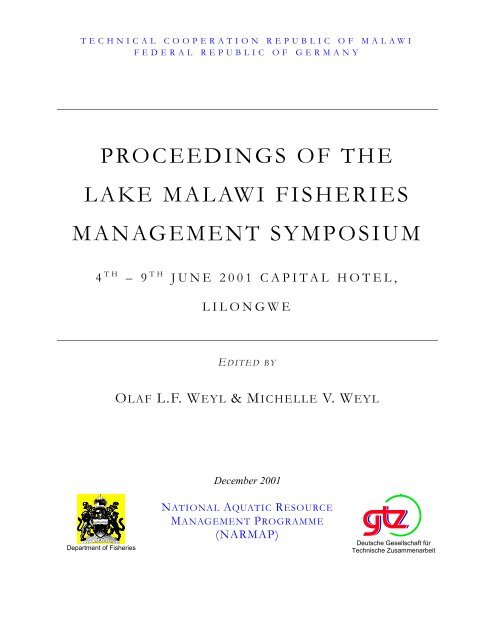
proceedings of the lake malawi fisheries management symposium
proceedings of the lake malawi fisheries management symposium
proceedings of the lake malawi fisheries management symposium

You also want an ePaper? Increase the reach of your titles
YUMPU automatically turns print PDFs into web optimized ePapers that Google loves.
TECHNICAL COOPERATION REPUBLIC OF MALAWI<br />
FEDERAL REPUBLIC OF GERMANY<br />
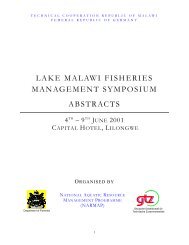
PROCEEDINGS OF THE<br />
LAKE MALAWI FISHERIES<br />
MANAGEMENT SYMPOSIUM<br />
4 TH – 9 TH JUNE 2001 CAPITAL HOTEL,<br />
Department <strong>of</strong> Fisheries<br />
LILONGWE<br />
E DITED BY<br />
OLAF L.F. WEYL & MICHELLE V. WEYL<br />
December 2001<br />
NATIONAL AQUATIC RESOURCE<br />
MANAGEMENT PROGRAMME<br />
(NARMAP)<br />
Deutsche Gesellschaft für<br />
Technische Zusammenarbeit
Table <strong>of</strong> contents<br />
Speech by <strong>the</strong> Minister <strong>of</strong> Natural Resources and Environmental Affairs, Hon, Harry I. Thomson, MP, at <strong>the</strong><br />
opening <strong>of</strong> <strong>the</strong> Lake Malawi Fisheries Management Symposium…………………….………………………... 1<br />
Speech by <strong>the</strong> Director <strong>of</strong> Fisheries, S.A. Mapila, at <strong>the</strong> opening <strong>of</strong> <strong>the</strong> Lake Malawi Fisheries Management<br />
Symposium…………………….…………………….…………………….……………………. 3<br />
The Role <strong>of</strong> <strong>the</strong> National Research Council <strong>of</strong> Malawi in protection , conservation and <strong>management</strong> <strong>of</strong><br />
<strong>fisheries</strong> resources in Malawi<br />
Frade K. Nyondo…………………….…………………….…………………….…………<br />
A general overview <strong>of</strong> <strong>fisheries</strong> research and development in Malawi<br />
O. M. Kachinjika…………………….…………………….………………………………. 11<br />
Economic security and sustainable programmes for <strong>the</strong> African Great Lakes<br />
Benjamin Ngatunga & Anthony Ribbink…………………….…………………….……………………………… 20<br />
The need to maintain maximum biodiversity in Lake Nyasa<br />
Benjamin P. Ngatunga………..……………….…………………………….……………… 27<br />
Fisheries <strong>management</strong>, biodiversity conservation and genetic stock structure<br />
George F. Turner…………………….…………………….…………………….………… 31<br />
Fisheries development, <strong>management</strong>, and <strong>the</strong> role <strong>of</strong> government<br />
Tony Seymour……………….…………………….…………………….………………… 42<br />
Seeking sustainability: streng<strong>the</strong>ning stakeholder involvement in <strong>fisheries</strong> <strong>management</strong> in Malawi<br />
Tracy A. Dobson & Aaron J. M. Russell…………………….…………………….………… 55<br />
Fisheries <strong>management</strong> and uncertainty: <strong>the</strong> causes and consequences <strong>of</strong> variability in inland <strong>fisheries</strong> in<br />
Africa, with special reference to Malawi<br />
Edward H. Allison, Frank Ellis, Peter M. Mvula & Laurence F. Mathieu………………………….. 66<br />
An overview <strong>of</strong> indigenous knowledge as applied to natural resources <strong>management</strong><br />
E.Y. Sambo & R. Woytek…………………….…………………….…………………….… 80<br />
Decentralised environmental <strong>management</strong> and <strong>the</strong> implications for <strong>fisheries</strong> co-<strong>management</strong> in Lake Malawi<br />
John D. Balarin…………………….…………………….………………………..…………………….…………… 85<br />
Status <strong>of</strong> <strong>the</strong> small scale fishery in Malawi.<br />
Mackson J.R. Ngochera …………………….…………………….……………..……….…………………….…… 95<br />
Effects <strong>of</strong> overfishing on reproductive potential <strong>of</strong> major cichlid fish species in sou<strong>the</strong>rn Lake Malombe<br />
(Malawi): Need for “Closed Area” strategy as a complementary <strong>management</strong> option?<br />
Collins Jambo & Tom Hecht…………………….…………………….……………………. 105<br />
Management recommendations for <strong>the</strong> nkacha net fishery <strong>of</strong> Lake Malombe<br />
Kissa R. Mwakiyongo & Olaf L.F. Weyl …………………….……..………………….……… 114<br />
Drifting long line, a potential fishing method for <strong>the</strong> nor<strong>the</strong>rn part <strong>of</strong> Lake Nyasa/Malawi/Niassa<br />
K.J. Kihedu, M.K.L.Mlay, J.A. Mwambungu & B.P. Ngatunga……………….………………… 121<br />
6
Gear and species selectivity <strong>of</strong> <strong>the</strong> chilimira kauni fishery in Lake Malawi<br />
Jacqueline Chisambo………….…………………….…………………….……………… 127<br />
Gear and species selectivity <strong>of</strong> <strong>the</strong> gill net fishery in Lake Malawi.<br />
Richard Dawson Sipawe…………………….…………………….……………………. 133<br />
Fisheries activities in nor<strong>the</strong>rn Lake Nyasa (Kyela District)<br />
John A. Mwambungu…………….…………………….…………………….…………… 142<br />
Hard choices for chambo <strong>management</strong> in area A <strong>of</strong> <strong>the</strong> sou<strong>the</strong>ast arm <strong>of</strong> Lake Malawi<br />
Olaf L.F. Weyl…………………….…………………….…………………….…………… 146<br />
The nkacha fishery in Lake Malombe and <strong>the</strong> sou<strong>the</strong>ast arm <strong>of</strong> Lake Malawi<br />
M<strong>of</strong>fat M. Manase…………………….…………………….………….………………… 156<br />
The state <strong>of</strong> <strong>the</strong> large scale commercial <strong>fisheries</strong> on Lake Malawi<br />
Moses Banda………………….……………………………………….………………... 163<br />
Spatial and temporal distribution <strong>of</strong> some commercially important fish species in <strong>the</strong> sou<strong>the</strong>ast arm <strong>of</strong> Lake<br />
Malawi: A Geostatistical Analysis.<br />
Ge<strong>of</strong>frey Z. Kanyerere & Anthony J. Booth…………………….…………………….………... 173<br />
Preliminary investigations <strong>of</strong> community level responses to benthic trawling in <strong>the</strong> demersal fish fauna <strong>of</strong><br />
Lake Malawi/Niassa, Africa.<br />
Will Darwall…………………….…………………….…………………….…………… 189<br />
Resource use overlaps between <strong>the</strong> pair trawl and small scale <strong>fisheries</strong> in <strong>the</strong> sou<strong>the</strong>ast arm <strong>of</strong> Lake Malawi<br />
Thomas E. Nyasulu…………………….…………………….…………………….…………………….…………... 195<br />
Population biology <strong>of</strong> <strong>the</strong> catfish Bagrus meridionalis from <strong>the</strong> sou<strong>the</strong>rn part <strong>of</strong> Lake Malawi.<br />
Moses Banda…………………………………….…………………….………………… 200<br />
Feeding habit and development <strong>of</strong> feeding-related morphological characters in Oreochromis shiranus<br />
(Boulenger, 1896) larvae and juveniles in Malawi<br />
Shinsuke Morioka and Daniel Sikawa…………………….…………………….…………………….…………… 215<br />
Otolith growth increments in three cyprinid species in Lake Malawi and information <strong>of</strong> <strong>the</strong>ir early growth<br />
Shinsuke Morioka & Emanuel Kaunda……………………………………………………………………………. 220<br />
Development <strong>of</strong> African catfish Clarias gariepinus larvae during <strong>the</strong> transitional phase between endogenous<br />
and exogenous energy intake.<br />
Seiji Matsumoto, Shinsuke Morioka & Sigeru Kumagai………………………………………………………… 227<br />
Effect <strong>of</strong> temperature on oocyte development <strong>of</strong> Oreochromis karongae (TREWAVAS)<br />
L.J. Kamanga, E. Kaunda, J.P. Mtimuni , A.O. Maluwa & M.W. Mfitilodz…………………………………. 233<br />
Effect <strong>of</strong> feeding density on survival <strong>of</strong> African catfish Clarias gariepinus.<br />
H.K. Zidana & A.O. Maluwa……………………………………………………………………………………….. 242<br />
Determination <strong>of</strong> biological reference points for Lake Malawi cichlids<br />
Anthony J. Booth…………………………………………………………………………………………………… 249<br />
Appendix I – Abstracts <strong>of</strong> papers not submitted for publication (with comments from floor)…………………... 260<br />
Appendix II – List <strong>of</strong> participants & Acknowledgements………………………………………………………... 270
1<br />
Lake Malawi Fisheries Management Symposium - Proceedings<br />
Speech by <strong>the</strong> Minister <strong>of</strong> Natural Resources and Environmental Affairs, Hon,<br />
Harry I. Thomson, MP, at <strong>the</strong> opening <strong>of</strong> <strong>the</strong> opening <strong>of</strong> <strong>the</strong> Lake Malawi Fisheries<br />
Management Symposium<br />
Read by <strong>the</strong> Deputy Secretary <strong>of</strong> <strong>the</strong> Ministry <strong>of</strong> Natural Resources and Environmental Affairs<br />
Mr. E.E. Lodzeni.<br />
The Director <strong>of</strong> Administration in <strong>the</strong> Ministry, The Director <strong>of</strong> Fisheries and all o<strong>the</strong>r <strong>fisheries</strong> staff,<br />
Representatives <strong>of</strong> Donor Agencies, Delegates to <strong>the</strong> Symposium, Representatives <strong>of</strong> Government Ministries and<br />
Departments, Members <strong>of</strong> <strong>the</strong> Press, Ladies and Gentlemen.<br />
It is a great honour and privilege for me to be with you today to <strong>of</strong>ficially open this International Symposium on <strong>the</strong><br />
Management <strong>of</strong> Lake Malawi and Lake Malombe <strong>fisheries</strong> resources. This is a very important <strong>symposium</strong> for<br />
Malawi, since it derives a variety <strong>of</strong> social and economic benefits from <strong>the</strong> resources <strong>the</strong>se <strong>lake</strong>s provide.<br />
First and foremost, I wish to extend a warm welcome to all participants to this <strong>symposium</strong>, in particular our<br />
international guests, who, despite <strong>the</strong>ir commitments at home have felt if very important that <strong>the</strong>y come and<br />
contribute towards <strong>the</strong> rational <strong>management</strong> <strong>of</strong> <strong>the</strong> <strong>fisheries</strong> in Malawi. To <strong>the</strong>m I would like to say ‘feel at home’.<br />
I have noted that <strong>the</strong> programme does not provide for a field trip. However, I would like to encourage participants<br />
who will have spare time after <strong>the</strong> conference, to take a tour <strong>of</strong> <strong>the</strong> countryside, especially along Lake Malawi,<br />
where in addition to having a field observation <strong>of</strong> <strong>the</strong> issues to be discussed here, will also be able to admire <strong>the</strong><br />
scenic beauty <strong>of</strong> some spots in <strong>the</strong> country, and have a feel <strong>of</strong> ‘Malawi <strong>the</strong> Warm Heart <strong>of</strong> Africa’.<br />
Ladies and Gentleman, I have been informed that this has been organised with a view to amalgamate all research<br />
results <strong>of</strong> previous work done on <strong>lake</strong> Malawi and Lake Malombe for purpose <strong>of</strong> formulating <strong>management</strong><br />
recommendations that would ensure sustainability <strong>of</strong> <strong>the</strong> <strong>fisheries</strong> resources. My reaction to this, is that this<br />
ga<strong>the</strong>ring has come at an opportune time when <strong>the</strong> Malawi Government is looking for ways and means that would<br />
provide for <strong>the</strong> sustainable <strong>management</strong> <strong>of</strong> its natural resources including fish stocks. Recent trends in <strong>the</strong> status <strong>of</strong><br />
our <strong>fisheries</strong> show that <strong>the</strong>re is need for more <strong>management</strong> guidelines to be put in place, if <strong>the</strong> fish stocks are to be<br />
sustained. Hence Government, through <strong>the</strong> Department <strong>of</strong> Fisheries, has recommended a number <strong>of</strong> strategies<br />
aimed at nurturing and promoting efficient <strong>management</strong> <strong>of</strong> <strong>the</strong> fish resources for <strong>the</strong> benefit <strong>of</strong> <strong>the</strong> present and future<br />
generations.<br />
Ladies and gentlemen, <strong>the</strong>se responsibilities should not be taken lightly, as fish is a vital source <strong>of</strong> animal protein in<br />
Malawi, contributing about 60-70% <strong>of</strong> <strong>the</strong> nation’s animal protein supply. In addition, <strong>the</strong> <strong>fisheries</strong> sector employs<br />
directly well over 50 000 full-time artisanal fishers and about 1 000 commercial fishers. Indirectly, it <strong>of</strong>fers<br />
employment to 250 000 individuals working in <strong>fisheries</strong> related activities such as processing, marketing and boat<br />
building. Therefore, <strong>the</strong> social and economic significance <strong>of</strong> <strong>the</strong> <strong>fisheries</strong> sector in Malawi is well recognised by<br />
Government.<br />
Fur<strong>the</strong>rmore, Malawi possesses rich aquatic resources notable <strong>of</strong> which are <strong>the</strong> diverse fish species that abound in<br />
<strong>the</strong> various water bodies, especially Lake Malawi. Malawi’s fish biodiversity is unparalleled anywhere else in <strong>the</strong><br />
World. It is documented that <strong>lake</strong> Malawi harbours more that 700 species <strong>of</strong> fish, which is more than any o<strong>the</strong>r <strong>lake</strong><br />
in <strong>the</strong> world. However, less than half are scientifically described.<br />
It is in recognition <strong>of</strong> this that <strong>the</strong> Fisheries Research Unit (FRU) was set up and has been carrying out research<br />
studies on Lake Malawi and o<strong>the</strong>r <strong>lake</strong>s and rivers. These are aimed at generating <strong>management</strong> guidelines for <strong>the</strong><br />
<strong>management</strong> and sustainable exploitation <strong>of</strong> our <strong>fisheries</strong> resources. Previous activities have centred on:<br />
1. Study <strong>of</strong> biological characteristics <strong>of</strong> fish with <strong>the</strong> aim <strong>of</strong> determining growth parameters, breeding behaviour,<br />
spawning behaviour, mortalities, feeding habits and nursery grounds;<br />
2. Stock assessment involving exploratory survey in shallow and deep waters with a view to identifying underutilised<br />
fish stocks, and monitoring <strong>of</strong> <strong>the</strong> status <strong>of</strong> fish stocks under exploitation especially in <strong>the</strong> sou<strong>the</strong>rn part<br />
<strong>of</strong> Lake Malawi.<br />
3. Studies on productivity <strong>of</strong> water and its influence on fish production; and
2<br />
Lake Malawi Fisheries Management Symposium - Proceedings<br />
4. Assessment <strong>of</strong> pollutants and habitat degrading activities, and <strong>the</strong>ir effects on aquatic ecosystem productivity;<br />
and bio-diversity surveys.<br />
The results generated from <strong>the</strong> various research activities have assisted <strong>the</strong> department in coming up with <strong>fisheries</strong><br />
resource <strong>management</strong> plans, which have contributed to <strong>the</strong> formulation <strong>of</strong> various <strong>fisheries</strong> regulations, such as<br />
closed seasons, gear restrictions and controlled allocation <strong>of</strong> fishing licences to <strong>the</strong> commercial trawl fishery<br />
Similar efforts have also been made by o<strong>the</strong>r organisations such as Chancellor College <strong>of</strong> <strong>the</strong> University <strong>of</strong> Malawi,<br />
which has recently concluded a project on <strong>the</strong> ecology <strong>of</strong> some Lake Malawi fishes.<br />
However, despite all <strong>the</strong> past efforts undertaken to control and manage <strong>the</strong> fish stocks, <strong>the</strong> <strong>fisheries</strong> sector is facing<br />
serious challenges <strong>of</strong> maintaining a balance between exploitation and conservation despite a number <strong>of</strong> research<br />
projects undertaken in <strong>the</strong> country.<br />
This is partly due to <strong>the</strong> fact that <strong>the</strong> majority <strong>of</strong> such projects were undertaken at different times without<br />
considering long-term sustainability. It has, <strong>the</strong>refore, been difficult for <strong>the</strong> Department <strong>of</strong> Fisheries to derive<br />
maximum benefit from <strong>the</strong> various recommendations made by <strong>the</strong> projects. The holding <strong>of</strong> this <strong>symposium</strong> is<br />
<strong>the</strong>refore, expected to rectify this anomaly by ensuring that all previous studies are presented, discussed and<br />
integrated into <strong>the</strong> various <strong>management</strong> guidelines that have been produced for <strong>the</strong> Lake Malawi and Malombe<br />
<strong>fisheries</strong>.<br />
Ladies and Gentlemen, I am fur<strong>the</strong>r informed that in addition to providing an opportunity to amalgamate recent<br />
scientific information on <strong>lake</strong> Malawi/Malombe <strong>fisheries</strong> complex, <strong>the</strong>re will also be discussions with various<br />
stakeholders in order to formulate <strong>management</strong> plans/recommendations. The holding <strong>of</strong> discussions with<br />
stakeholders is in line with <strong>the</strong> government’s policy <strong>of</strong> involving end users in <strong>the</strong> <strong>management</strong> <strong>of</strong> our natural<br />
resources such as fish. I <strong>the</strong>refore, wish to request all <strong>of</strong> you to actively participate in <strong>the</strong> discussion in an open and<br />
transparent manner.<br />
Distinguished Guests, Ladies and Gentlemen, <strong>the</strong> fact that <strong>the</strong> presentations to be made at this <strong>symposium</strong> include<br />
biodiversity, fish biology and ecology, <strong>fisheries</strong> assessment and <strong>management</strong>, social dimensions and economics <strong>of</strong><br />
<strong>fisheries</strong> <strong>management</strong> and <strong>fisheries</strong> co-<strong>management</strong> assures <strong>the</strong> Malawi Government that <strong>the</strong> <strong>symposium</strong> is <strong>of</strong> great<br />
benefit to <strong>the</strong> nation at large. Such a diversity <strong>of</strong> issues to be discussed in this <strong>symposium</strong> will definitely contribute<br />
towards <strong>the</strong> determination <strong>of</strong> <strong>management</strong> objectives and strategies for <strong>lake</strong> Malawi/ Malombe <strong>fisheries</strong> complex.<br />
Lastly, I would like to urge this forum to look at a positive way forward for <strong>the</strong> Malawi <strong>fisheries</strong> by adopting a<br />
holistic and multi-disciplinary research approach that would always be relevant in <strong>the</strong> formulation <strong>of</strong> <strong>management</strong><br />
guidelines and evolve with environment, equity and economics. Cognisance should also be taken <strong>of</strong> <strong>the</strong> fact that for<br />
<strong>fisheries</strong> research to be an effective tool for <strong>management</strong> it should have a reliable source <strong>of</strong> funding. Therefore, it is<br />
also my hope that <strong>the</strong> forum will identify alternative sources <strong>of</strong> funding for <strong>the</strong> research programmes being<br />
proposed.<br />
At this juncture, I would like to thank GTZ for sponsoring this Symposium. My special thanks also go to <strong>the</strong><br />
organisers and <strong>management</strong> <strong>of</strong> Capital Hotel for <strong>the</strong> excellent arrangements.<br />
Distinguished Delegates, Ladies and Gentlemen, now, it is my honour to declare <strong>the</strong> International Symposium on<br />
Sustainable Management <strong>of</strong> <strong>the</strong> Fisheries in Lake Malawi/Malombe <strong>of</strong>ficially open.<br />
I thank you for your attention.
3<br />
Lake Malawi Fisheries Management Symposium - Proceedings<br />
Speech by <strong>the</strong> Director <strong>of</strong> Fisheries, S.A. Mapila, at <strong>the</strong> opening <strong>of</strong> <strong>the</strong> Lake<br />
Malawi Fisheries Management Symposium<br />
The African Great Lakes are considered dynamically fragile ecosystems that are relatively resistant to changes with<br />
which <strong>the</strong>y have co-evolved for a million years. Lake Malawi is one <strong>of</strong> <strong>the</strong> largest fresh water <strong>lake</strong>s in <strong>the</strong> world <strong>of</strong><br />
its kind in <strong>the</strong> SADC region. The <strong>lake</strong> is rich in biodiversity, <strong>of</strong> which, <strong>fisheries</strong> are a major resource for <strong>the</strong> riparian<br />
communities. During <strong>the</strong> last two decades intensive non-selective <strong>fisheries</strong> in shallow waters, extreme changes in <strong>the</strong><br />
drainage basin and <strong>lake</strong> vegetation industrialisation, and agricultural developments, have impacted upon <strong>the</strong> <strong>lake</strong>.<br />
There is a need for sound <strong>fisheries</strong> <strong>management</strong> plan to be developed and implemented, through participatory<br />
approaches, a need for sustainable utilisation <strong>of</strong> <strong>the</strong> <strong>fisheries</strong> resource through proper resource monitoring, extension<br />
and enforcement; and to increase fish production through <strong>the</strong> availability <strong>of</strong> a credit scheme to <strong>the</strong> private sector, <strong>the</strong><br />
introduction <strong>of</strong> new technologies and <strong>the</strong> building <strong>of</strong> infrastructure.<br />
The environment is <strong>the</strong> foundation <strong>of</strong> economic activity for <strong>the</strong> majority <strong>of</strong> Malawians. The unsustainable<br />
exploitation, and underdeveloped potentials, <strong>of</strong> some <strong>of</strong> <strong>the</strong> natural resources in <strong>the</strong> Lake Malawi basin have<br />
continued unabated and are challenged by a complex interaction <strong>of</strong> several factors including population growth,<br />
widespread poverty, high dependency on smallholder rain fed agriculture, inconsistencies in macro economic<br />
policies and institutional weaknesses with national capacity. The impacts <strong>of</strong> competing and unsustainable uses <strong>of</strong><br />
land and water resources are partially understood, and widely manifested throughout <strong>the</strong> Lake Malawi basin. The<br />
annual costs <strong>of</strong> land related environmental degradation in Malawi have been estimated at US$ 243m or 12% <strong>of</strong><br />
GDP.<br />
Though guidelines are and will continue to be <strong>the</strong> backbone <strong>of</strong> Malawi’s economy, since <strong>the</strong> country is not well<br />
endowed with mineral resources, <strong>the</strong> fishing industry is set to take centre stage due to major shifts in <strong>the</strong> agricultural<br />
industry. This will thus involve boosting production from inland water resources, and a commitment on <strong>the</strong> part <strong>of</strong><br />
<strong>the</strong> authorities.<br />
Fishing is one <strong>of</strong> man’s oldest activities, and it remains one <strong>of</strong> <strong>the</strong> most important, especially in Malawi. Fish is a<br />
major source <strong>of</strong> high-grade protein, and fishing is <strong>the</strong> main employment in communities along <strong>the</strong> coast and around<br />
small <strong>lake</strong>s and rivers. It is obvious that <strong>the</strong> use <strong>of</strong> <strong>the</strong>se natural resources is bound to raise a range <strong>of</strong> environmental<br />
issues. Chief amongst <strong>the</strong>m is <strong>the</strong> conservation and <strong>management</strong> <strong>of</strong> <strong>the</strong> resources <strong>the</strong>mselves, but equally important<br />
is <strong>the</strong> problem <strong>of</strong> allocating resources amongst competing individuals and social groups. This is important because<br />
without proper allocation <strong>the</strong>re is usually an unrestricted activity, which can undermine <strong>management</strong> and<br />
conservation standards. The nature <strong>of</strong> <strong>the</strong> various environmental considerations will have to depend on <strong>the</strong> nature <strong>of</strong><br />
<strong>the</strong> biological resources, <strong>the</strong> fishing operations, and <strong>the</strong>ir social, economic and administrative contexts.<br />
Most <strong>of</strong> <strong>the</strong> fish resources in Malawi are shared with neighbouring countries. Regional collaboration on <strong>the</strong>se shared<br />
water resources is going to be essential if biodiversity and production from <strong>the</strong>se water resources is going to be<br />
sustainable. Within this context, smallholder fishermen form some <strong>of</strong> <strong>the</strong> largest constituency <strong>of</strong> <strong>the</strong> roughly 100<br />
million inhabitants <strong>of</strong> sou<strong>the</strong>rn Africa. For <strong>the</strong>se fisherman, <strong>the</strong>re is a direct and immediate cause and effect<br />
relationship between supply <strong>of</strong> fish and food availability.<br />
The results are widely demonstrated by <strong>the</strong> amount <strong>of</strong> fish consumption and trade in <strong>the</strong> region. The supply <strong>of</strong> fish<br />
suffers seriously from <strong>the</strong> cyclic fluctuations in catch mainly due to climatic conditions, although 40% <strong>of</strong> <strong>the</strong><br />
population and labour force relies on <strong>fisheries</strong> for subsistence as well as employment and income.<br />
Food security cannot be divorced from poverty. Lack <strong>of</strong> sustainable income generation, vulnerability to food<br />
variability and unequal accesses to resources are issues that trap <strong>the</strong> poverty prone in food insecure situations.<br />
Increased fish production and availability can significantly affect <strong>the</strong> national nutrition.<br />
Statistics indicate that aquatic production in terms <strong>of</strong> biomass on Lake Malawi has gone up, but fishermen’s catches<br />
have remained static or even gone down over <strong>the</strong> last 10 years due to a lack <strong>of</strong> innovative technology. The fishing<br />
industry has gone back ra<strong>the</strong>r than forwards due to amongst o<strong>the</strong>r things, structural measures. While a lot <strong>of</strong><br />
information is known about <strong>the</strong> <strong>fisheries</strong> potential <strong>of</strong> Lake Malawi, a lot still needs to be known about <strong>the</strong>ir<br />
limnology, biology, physio-chemistry, hydrology and socio-economic setting. It is however known that <strong>the</strong> <strong>lake</strong><br />
supports large biomass <strong>of</strong> fish in <strong>of</strong>fshore waters, which is not being exploited.
4<br />
Lake Malawi Fisheries Management Symposium - Proceedings<br />
Early aquatic resources development projects on Lake Malawi did not meet with <strong>the</strong> expected results. During <strong>the</strong><br />
early years after independence, our government invested heavily on infrastructure using foreign assistance.<br />
However, <strong>the</strong>se facilities were poorly maintained and functioned well below capacity. Some <strong>of</strong> <strong>the</strong> reasons were bad<br />
site selection; lack <strong>of</strong> government capacity to maintain operations; lack <strong>of</strong> planning and unclear objectives. Early<br />
projects were also oriented towards donor driven research projects and transfer <strong>of</strong> untested technology. Sustainable<br />
support systems, extension services and credit facilities were not established.<br />
Following <strong>the</strong> disappointing results <strong>of</strong> this donor driven period, <strong>the</strong> Government <strong>of</strong> Malawi would like to change its<br />
project priorities to a production-oriented approach. Priority will be given to <strong>the</strong> private sector targeting <strong>the</strong><br />
commercial and small-scale fisherman. The overall approach would be to promote fish production for <strong>the</strong> potential<br />
benefits <strong>of</strong> <strong>the</strong> population.<br />
Pilot projects undertaken during previous projects have identified an effective approach to aquatic resources<br />
development on Lake Malawi. Considerable information on aquatic resources use and user’s priorities exist.<br />
Research for <strong>the</strong> future should focus on meeting food production needs in Malawi in ways that are beneficial to <strong>the</strong><br />
populace and do not degrade <strong>the</strong> natural resource base. This will involve identifying <strong>the</strong> most appropriate<br />
technological and institutional changes and policies for sustainable and equitable <strong>fisheries</strong> production. Research<br />
attempts to identify appropriate policies for stressed <strong>fisheries</strong> should be given special emphasis. Never<strong>the</strong>less, most<br />
importantly, <strong>the</strong> research should also emphasise on extension and on property rights and collective action.<br />
It is important to note that <strong>the</strong> most important issue in capture <strong>fisheries</strong> is <strong>the</strong> need to match <strong>the</strong> catch and marketing<br />
capacity <strong>of</strong> <strong>the</strong> fishery to <strong>the</strong> productivity <strong>of</strong> <strong>the</strong> resource. But in most donor driven projects this issue has been<br />
ignored, and <strong>the</strong> reason why it has been ignored is that usually <strong>the</strong> people drawing up national policies, ei<strong>the</strong>r within<br />
government or aid agencies, are seldom <strong>the</strong>mselves <strong>fisheries</strong> specialists.<br />
Resource <strong>management</strong> issues dominate ecological concerns in most <strong>fisheries</strong>, except small bodies <strong>of</strong> water under<br />
sole ownership. There are in principle two sets <strong>of</strong> issues: maintaining <strong>the</strong> biological productivity, and making <strong>the</strong><br />
optimum use <strong>of</strong> it, in social and economic terms. The latter issues are <strong>of</strong>ten given higher priorities. The main aim <strong>of</strong><br />
<strong>the</strong> Department <strong>of</strong> Fisheries is to maintain biological productivity by making sure that <strong>the</strong> resource is allocated<br />
wisely between different resource users; i.e. pair trawlers, gill netters, and purse seiners. This will mean taking<br />
explicit decisions on allocation <strong>of</strong> resources. Difficulties do arise when <strong>the</strong> resource users are in conflict as to who<br />
owns what resource.<br />
The fishes <strong>of</strong> Lake Malawi are one <strong>of</strong> <strong>the</strong> most remarkably diverse and abundant groups in <strong>the</strong> world. Some changes<br />
in species composition on <strong>the</strong> Lake Malawi <strong>fisheries</strong> have been reported. Correct identifications are necessary if<br />
ecological changes, whe<strong>the</strong>r or not <strong>the</strong> result <strong>of</strong> human impact, are to be taken into account in <strong>management</strong> plans.<br />
However, <strong>the</strong> systematic knowledge <strong>of</strong> <strong>the</strong>se projects is very poor <strong>the</strong>reby obstructing fur<strong>the</strong>r biological research.<br />
Rich as it is in flora and fauna, Lake Malawi plays host to some <strong>of</strong> <strong>the</strong> poorest people in <strong>the</strong> region, an unfortunate<br />
paradox. From <strong>the</strong> Chitipa hills to its delta in Mozambique where it empties into <strong>the</strong> Zambezi River, it has made<br />
limited economic contribution to <strong>the</strong> lives <strong>of</strong> millions <strong>of</strong> Africans who live on its banks. Only subsistence survival<br />
from wetland and floodplain food resources, and building materials <strong>of</strong>fer a meagre existence.<br />
The <strong>lake</strong>shore communities depend heavily on natural resources for a living, <strong>the</strong> result <strong>of</strong> which is a high rate <strong>of</strong><br />
environmental degradation. Firewood is a major source <strong>of</strong> energy for <strong>the</strong> communities, contributing to increasing<br />
levels <strong>of</strong> deforestation. Its waters generate hundreds <strong>of</strong> megawatts <strong>of</strong> electricity downstream annually but none <strong>of</strong><br />
this power find its way into <strong>the</strong> homes <strong>of</strong> <strong>the</strong> local communities. The few social amenities like schools and clinics,<br />
which are thinly spread in <strong>the</strong> fishing villages, do not benefit from <strong>the</strong> hydroelectric power schemes through ei<strong>the</strong>r<br />
piped water or electricity. Most fishing communities do not have secondary schools or decent clinics. The people do<br />
not have a good gravel road, let alone a tarred one, or a fixed telephone network.<br />
Lake Malawi is <strong>the</strong> largest water body in <strong>the</strong> SADC region, and yet <strong>the</strong> water is inaccessible and most <strong>of</strong>ten not<br />
potable and <strong>the</strong> communities who inhabit it’s shore face severe water shortages each year owing to non-existent<br />
infrastructure. There has never been an attempt to draw water from this massive body for <strong>the</strong> local community’s<br />
consumption.
5<br />
Lake Malawi Fisheries Management Symposium - Proceedings<br />
The major economic activity on Lake Malawi is tourism, which is not fully exploited to reduce <strong>the</strong> poverty. Tourism<br />
generates substantial income for most <strong>of</strong> <strong>the</strong> countries in <strong>the</strong> SADC and is <strong>the</strong> economic mainstay <strong>of</strong> <strong>the</strong> Zambezi<br />
River basin. Top attractions include <strong>the</strong> <strong>lake</strong> itself, a unique blend <strong>of</strong> ecosystems that supports large animals,<br />
including elephant, hippo, lion, and hundreds <strong>of</strong> bird species and beautiful flora, and <strong>the</strong> colourful ornamental fishes.<br />
Communities in <strong>the</strong> Lake Malawi catchment are rated as poor in terms <strong>of</strong> monetary incomes but social scientists say<br />
<strong>the</strong>y could raise <strong>the</strong>ir economic status if <strong>the</strong>y fully exploited <strong>the</strong> fish resources and tourist dollars through sales <strong>of</strong><br />
local arts and crafts, and game viewing. And yet, no incentives are forthcoming to help Malawians realise this<br />
potential.<br />
The beautiful sandy beaches and impressive mixes <strong>of</strong> biodiversity are, in places, dotted with shanty dwellings,<br />
which are skilfully and shamefully tucked away amongst mansions, posh hotels and beautiful, but environmentally<br />
insensitive, leisure facilities. The large amounts <strong>of</strong> money that have been spent studying <strong>the</strong> science <strong>of</strong> <strong>the</strong> <strong>lake</strong> have<br />
not yielded much for <strong>the</strong> ordinary person who remains buried in deep poverty. The dilapidated <strong>lake</strong>shore towns<br />
exude a sense <strong>of</strong> lost opportunities. The <strong>lake</strong> slumbers with its mighty potential, impressive geography and endless<br />
variety. The <strong>lake</strong>shore situation can best be described as a mirror image <strong>of</strong> <strong>the</strong> rest <strong>of</strong> <strong>the</strong> region where many<br />
resource endowed communities wallow in poverty while <strong>the</strong>re is plenty on <strong>the</strong>ir doorstep.<br />
It is my contention that, science, strategic plans and <strong>management</strong> plans do have <strong>the</strong>ir place to play in <strong>the</strong> fishing<br />
industry, but it is now time that we should put more <strong>of</strong> our concern on <strong>the</strong> exploitation <strong>of</strong> <strong>the</strong> <strong>fisheries</strong> resources. We<br />
as a Department have done a lot in trying to promote this agenda, what we need now is a commitment. Government<br />
needs to come up and raise <strong>the</strong> portfolio <strong>of</strong> <strong>the</strong> fishing industry as a priority in Malawi.<br />
It is my hope that this <strong>symposium</strong> will go a long way in trying to resolve some <strong>of</strong> <strong>the</strong>se problems.<br />
With <strong>the</strong>se words I would like to declare this <strong>symposium</strong> open.<br />
Thank you
6<br />
Lake Malawi Fisheries Management Symposium - Proceedings<br />
The role <strong>of</strong> <strong>the</strong> National Research Council <strong>of</strong> Malawi in protection, conservation<br />
and <strong>management</strong> <strong>of</strong> <strong>fisheries</strong> resources in Malawi<br />
Frade K. Nyondo<br />
National Research Council Of Malawi, P. O. Box 30745, Lilongwe 3. Malawi<br />
Abstract<br />
The Malawi population directly depends on <strong>the</strong> genetic resources <strong>of</strong> fauna and flora for its survival in terms <strong>of</strong> food, medicines,<br />
aes<strong>the</strong>tic values and tourism. The <strong>fisheries</strong> resources contribute a significant proportion <strong>of</strong> Malawi’s genetic resources. The water<br />
ecosystem <strong>of</strong> Malawi comprises between 500 to 1 000 fish species most <strong>of</strong> which are endemic to Malawi making it an important<br />
living aquatic resource to <strong>the</strong> country. Fish contributes 4% to <strong>the</strong> GNP, 60-70% to <strong>the</strong> consumption <strong>of</strong> <strong>the</strong> nation’s animal protein<br />
and employs a considerable proportion <strong>of</strong> <strong>the</strong> population that is engaged in fishing, fish processing, marketing, boat building and<br />
repair, engine repair, and gear supply. In addition, a number <strong>of</strong> companies are involved in <strong>the</strong> export <strong>of</strong> aquarium fish. It is<br />
disheartening to note that despite <strong>the</strong> important role <strong>the</strong> <strong>fisheries</strong> resources play in <strong>the</strong> economy <strong>of</strong> Malawi, some unscrupulous<br />
individuals have collected and exported Malawi’s <strong>fisheries</strong> resource without following proper procedures. This has led to Malawian<br />
fish being bred outside <strong>the</strong> country, making Malawi loose economic benefits and much needed foreign exchange. This situation has<br />
called for <strong>the</strong> establishment <strong>of</strong> a mechanism that allows for sustainable utilisation <strong>of</strong> <strong>fisheries</strong> resources while at <strong>the</strong> same time<br />
ensuring equitable benefit sharing from such use.<br />
Malawi is a signatory to various protocols and agreements related to <strong>fisheries</strong> resources including Convention on Biological Diversity<br />
(CBD). Malawi does not currently have a coherent policy for <strong>the</strong> sustainable utilisation <strong>of</strong> genetic resources. Fur<strong>the</strong>rmore, following<br />
<strong>the</strong> decentralisation <strong>of</strong> research clearance for foreign scientists, <strong>the</strong> system has lent itself to such abuse that it has become ra<strong>the</strong>r<br />
open to over exploitation. To overcome <strong>the</strong>se problems, <strong>the</strong> National Research Council <strong>of</strong> Malawi (NCRM) through its Genetic<br />
Resources and Biotechnology Committee (GRBC) has developed procedures and guidelines for access and collection <strong>of</strong> genetic<br />
resources in Malawi which were <strong>of</strong>ficially launched in February, 2001. These guidelines were developed based on <strong>the</strong> notion <strong>of</strong><br />
controlled access which means promoting access to genetic materials and traditional knowledge while setting terms <strong>of</strong> access<br />
based upon development priorities. This leads to low to high utilisation and compensation. NCRM has also developed draft<br />
procedures and guidelines for <strong>the</strong> conduct <strong>of</strong> research in Malawi, contractual agreement forms and has formed a taskforce to draft a<br />
benefit sharing formula.<br />
Introduction<br />
The Malawi population directly depends on <strong>the</strong> genetic resources <strong>of</strong> fauna and flora for its survival in terms <strong>of</strong> food,<br />
medicines, aes<strong>the</strong>tic values and tourism. The <strong>fisheries</strong> resources contribute a significant proportion <strong>of</strong> Malawi’s<br />
genetic resources. The water ecosystem <strong>of</strong> Malawi comprises between 500 to 1 000 fish species most <strong>of</strong> which are<br />
endemic to Malawi making it an important living aquatic resource to <strong>the</strong> country. Fish contributes 4% to <strong>the</strong> GNP,<br />
60-70% to <strong>the</strong> consumption <strong>of</strong> <strong>the</strong> nation’s animal protein, 40% to <strong>the</strong> total protein consumption <strong>of</strong> <strong>the</strong> population.<br />
In addition, <strong>fisheries</strong> employ a considerable proportion <strong>of</strong> <strong>the</strong> population that is engaged in fishing, fish processing,<br />
marketing, boat building and repair, engine repair, and gear supply. A number <strong>of</strong> companies are involved in <strong>the</strong><br />
export <strong>of</strong> aquarium fish. It is disheartening to note that despite <strong>the</strong> important role <strong>the</strong> <strong>fisheries</strong> resources play in <strong>the</strong><br />
economy <strong>of</strong> Malawi, some unscrupulous individuals have collected and exported Malawi’s <strong>fisheries</strong> resource<br />
without following proper procedures. This has led to Malawian fish being bred outside <strong>the</strong> country, making Malawi<br />
loose economic benefits and much needed foreign exchange.<br />
To safeguard <strong>the</strong> over exploitation <strong>of</strong> <strong>the</strong> country’s <strong>fisheries</strong> resources and to ensure regulated access, conservation<br />
<strong>of</strong> <strong>the</strong> <strong>fisheries</strong> resources, sustainable use <strong>of</strong> <strong>the</strong>ir components, and fair and equitable sharing <strong>of</strong> benefits arising from<br />
<strong>the</strong>ir use, <strong>the</strong> Government through various Ministries and Departments have established various committees and<br />
working groups. These committees and working groups are looking at <strong>the</strong> policy, legislative and strategic<br />
frameworks that can ensure that <strong>the</strong> <strong>fisheries</strong> resources <strong>of</strong> Malawi are protected. Realising that most <strong>of</strong> <strong>the</strong> <strong>fisheries</strong><br />
resources collected from Malawi end up being used for research purposes in o<strong>the</strong>r countries, <strong>the</strong> Government has<br />
signed and ratified a number <strong>of</strong> international agreements that are aimed at protecting <strong>the</strong> <strong>fisheries</strong> resources from<br />
erosion.<br />
The paper aims at (1) itemising <strong>the</strong> national initiatives that have been undertaken in order to protect <strong>the</strong> country’s<br />
<strong>fisheries</strong> resources, (2) <strong>the</strong> paper highlights <strong>the</strong> international agreement that Malawi has signed and some <strong>of</strong> <strong>the</strong>ir<br />
provisions, (3) <strong>the</strong> paper looks at <strong>the</strong> contents <strong>of</strong> <strong>the</strong> procedures and guidelines for access and collection <strong>of</strong> genetic<br />
resources in Malawi, (4) <strong>the</strong> paper outlines <strong>the</strong> summary <strong>of</strong> <strong>the</strong> procedures and guidelines for <strong>the</strong> conduct <strong>of</strong> research<br />
in Malawi, (5) <strong>the</strong> paper looks at NCRM as a co-ordinator <strong>of</strong> research, science and technology, (6) it looks at <strong>the</strong><br />
way forward for Malawi.
7<br />
Lake Malawi Fisheries Management Symposium - Proceedings<br />
National initiatives towards <strong>the</strong> protection <strong>of</strong> genetic resources<br />
Several national initiatives have been undertaken in order to protect <strong>the</strong> <strong>fisheries</strong> resources <strong>of</strong> Malawi. There is <strong>the</strong><br />
Genetic Resources and Biotechnology Committee (GRBC) which falls under <strong>the</strong> National Research Council <strong>of</strong><br />
Malawi (NRCM). The Committee has <strong>the</strong> following Terms <strong>of</strong> Reference (TORs):<br />
• To institute measures harmonious with <strong>the</strong> relevant guidelines available in <strong>the</strong> country .<br />
• To ensure that collection <strong>of</strong> Malawi’s genetic materials does not lead to loss <strong>of</strong> biological diversity and/or<br />
Government Revenue.<br />
• To ensure that <strong>the</strong> importation <strong>of</strong> genetic resources (including genetically modified organisms) and<br />
germplasm does not adversely affect <strong>the</strong> conservation and sustainable use <strong>of</strong> biological diversity.<br />
• To ensure that exchange <strong>of</strong> genetic resources and germplasm is done in such a way that Malawi benefits<br />
economically from whatever is exported.<br />
• To encourage <strong>the</strong> establishment <strong>of</strong> gene banks and genetic data banks (in-situ and ex-situ) and formation <strong>of</strong><br />
strong linkages with banks including <strong>the</strong> SADC gene bank.<br />
• To advise <strong>the</strong> Government on which <strong>of</strong> <strong>the</strong> country’s genetic materials should be protected against<br />
detrimental use by researchers, collectors and traders.<br />
• To foster <strong>the</strong> dissemination <strong>of</strong> information on trends in biotechnology.<br />
• To keep abreast with <strong>the</strong> national, regional and global trends in intellectual property rights and trade.<br />
• To ensure that expatriate researchers work closely with competent Malawian researchers.<br />
• To encourage and promote endogenous development <strong>of</strong> biotechnology in areas where Malawi has<br />
comparative advantage.<br />
Secondly, <strong>the</strong> Government <strong>of</strong> Malawi developed a National Environmental Action Plan (NEAP) which was<br />
launched in December, 1994. In <strong>the</strong> NEAP, several factors that affect Fisheries resources were identified. Notable<br />
among <strong>the</strong>m were, water resource degradation, high population growth, threat to biological diversity, human habitat<br />
degradation, air pollution, climate change, and depletion <strong>of</strong> fish resources.<br />
The NEAP clearly spells out strategies and actions that need to be put in place in order to conserve, sustainably<br />
utilise and manage <strong>the</strong> <strong>fisheries</strong> resources <strong>of</strong> Malawi. Along with <strong>the</strong> NEAP, a number <strong>of</strong> policies have been put in<br />
place. Such policies include those that deal with population, <strong>fisheries</strong>, and tourism. The various policies have been<br />
enhanced through legislation to ensure that <strong>the</strong> genetic resources are protected by law. The all embracing legislation<br />
is <strong>the</strong> Environmental Management Act (EMA) which provides for <strong>the</strong>:<br />
• Identification <strong>of</strong> biological diversity.<br />
• Determination <strong>of</strong> threatened biodiversity.<br />
• Preparation and maintenance <strong>of</strong> inventory <strong>of</strong> biological diversity.<br />
• Putting in place measures for better protection and conservation <strong>of</strong> rare and endemic species <strong>of</strong> fauna and<br />
flora.<br />
• Determination <strong>of</strong> actual and potential threats to biological diversity <strong>of</strong> Malawi and devising measures that<br />
are necessary for preventing <strong>the</strong>ir loss.<br />
• Integration <strong>of</strong> conservation and sustainable use <strong>of</strong> biological diversity into sectoral or cross-sectoral plans,<br />
programmes and policies <strong>of</strong> Government, <strong>the</strong> private sector and <strong>the</strong> local communities.<br />
• Re-introduction <strong>of</strong> ex-situ species in native habitats and ecosystem provided that <strong>the</strong>y do not pose threat to<br />
in-situ species and habitats.<br />
• Establishment <strong>of</strong> regulations and guidelines to control or restrict access by any person to <strong>the</strong> genetic<br />
resources <strong>of</strong> Malawi including.<br />
• Prohibiting <strong>the</strong> exportation <strong>of</strong> germplasm except with government approval.<br />
• Providing for <strong>the</strong> sharing <strong>of</strong> benefits arising from <strong>the</strong> exploitation <strong>of</strong> germplasm originating from <strong>the</strong><br />
technology owner or <strong>the</strong> Government.<br />
• Providing for payment <strong>of</strong> fees and charges for access and export licence in respect <strong>of</strong> germplasm.<br />
• Promotion <strong>of</strong> such land use practices that are compatible with <strong>the</strong> conservation <strong>of</strong> biological diversity <strong>of</strong><br />
Malawi.<br />
• Selection and <strong>management</strong> <strong>of</strong> environmental protection areas for <strong>the</strong> conservation <strong>of</strong> various terrestrial and<br />
aquatic ecological systems <strong>of</strong> Malawi.<br />
• Establishment and <strong>management</strong> <strong>of</strong> buffer zones near environmental protection areas.<br />
• Prohibition and control <strong>of</strong> introduction <strong>of</strong> alien species.
8<br />
Lake Malawi Fisheries Management Symposium - Proceedings<br />
• Establishment and <strong>management</strong> <strong>of</strong> germplasm banks, botanical gardens, zoos, animal orphanages, and such<br />
o<strong>the</strong>r facilities as may be prescribed.<br />
• Identification and integration <strong>of</strong> traditional knowledge into <strong>the</strong> conservation and sustainable utilisation <strong>of</strong><br />
biological diversity.<br />
In addition to <strong>the</strong> all embracing EMA, <strong>the</strong>re are sectoral legislations that also impinge on <strong>the</strong> conservation,<br />
sustainable utilisation and protection <strong>of</strong> <strong>fisheries</strong> resources. Such Acts include <strong>the</strong> Fisheries Conservation and<br />
Management Act etc.<br />
The provisions <strong>of</strong> EMA formed <strong>the</strong> basis <strong>of</strong> <strong>the</strong> objectives <strong>of</strong> <strong>the</strong> National Biodiversity Strategy and Action Plan<br />
(NBSAP). The objectives include compiling <strong>of</strong> a complete inventory <strong>of</strong> Malawi’s biological diversity, building and<br />
enhancing capacity, creating awareness <strong>of</strong> <strong>the</strong> value <strong>of</strong> conservation and sustainable use, reviewing and harmonising<br />
existing legislation, documenting indigenous knowledge and setting up <strong>of</strong> a Malawi Biodiversity Secretariat.<br />
The Government <strong>of</strong> <strong>the</strong> Republic <strong>of</strong> Malawi, recognising <strong>the</strong> importance <strong>of</strong> biological diversity in <strong>the</strong> socioeconomic<br />
development, enshrined biodiversity conservation in <strong>the</strong> new constitution in 1994 (Chapter II), Section<br />
13(d). The constitution provides for <strong>the</strong> State to conserve and enhance biodiversity, prevent <strong>the</strong> degradation <strong>of</strong> <strong>the</strong><br />
environment, provide a healthy living and working environment for <strong>the</strong> people, and accord full recognition <strong>of</strong> rights<br />
<strong>of</strong> <strong>the</strong> future generations by means <strong>of</strong> environmental protection in order to achieve sustainable development.<br />
International instruments signed and ratified by Malawi<br />
Malawi is signatory to several international agreements that have a bearing on <strong>fisheries</strong> resources. Some <strong>of</strong> <strong>the</strong>se<br />
agreements are <strong>the</strong> Convention on Biological Diversity (CBD) which Malawi signed on 15 th June, 1992 and ratified<br />
it on 28 th February, 1994. O<strong>the</strong>r agreements Convention <strong>of</strong> Wetlands <strong>of</strong> Significant Importance, Convention on<br />
International Trade in Endangered Species <strong>of</strong> Wild Fauna and Flora, African Convention on <strong>the</strong> Conservation <strong>of</strong><br />
Nature and Natural Resources, United Nations Convention on Law <strong>of</strong> <strong>the</strong> Sea, Montreal Protocol for <strong>the</strong> Protection<br />
<strong>of</strong> <strong>the</strong> Ozone Layer, United Nations Framework Convention on Climate Change, and <strong>the</strong> Convention <strong>of</strong><br />
Desertification and Drought. The emphasis in this section will be on <strong>the</strong> provisions <strong>of</strong> <strong>the</strong> CBD.<br />
The CBD provides for sovereign rights over <strong>fisheries</strong> resources and calls for regulating access on mutually agreed<br />
terms with prior informed consent. Secondly, it allows member countries to create incentive measures that would<br />
promote conservation and sustainable utilisation <strong>of</strong> <strong>fisheries</strong> resources. Thirdly, it calls for fair and equitable sharing<br />
<strong>of</strong> benefits arising out <strong>of</strong> <strong>the</strong> use <strong>of</strong> <strong>fisheries</strong> resources.<br />
The member countries are under obligation by <strong>the</strong> CBD to create incentive measures that can promote conservation<br />
and sustainable use <strong>of</strong> <strong>fisheries</strong> resources, and create sovereign rights over <strong>fisheries</strong> resources. It obliges member<br />
countries to ensure fair and equitable sharing <strong>of</strong> benefits arising out <strong>of</strong> <strong>the</strong> utilisation <strong>of</strong> <strong>fisheries</strong> resources or out <strong>of</strong><br />
utilisation <strong>of</strong> knowledge, innovations and practices <strong>of</strong> indigenous and local communities. It requires <strong>the</strong>m to regulate<br />
access to <strong>fisheries</strong> resources and traditional knowledge based on mutually-agreed terms and upon prior informed<br />
consent, and to create a mechanism to facilitate access to technology (including that which is relevant to <strong>the</strong><br />
conservation and sustainable use <strong>of</strong> <strong>fisheries</strong> resources as well as biotechnology that makes use <strong>of</strong> <strong>the</strong>se resources).<br />
Finally, it requires member countries to encourage co-operation between <strong>the</strong> government authorities and <strong>the</strong> private<br />
sector in developing methods for sustainable use <strong>of</strong> <strong>the</strong>se resources (NCRM, 2000 and Ntupanyama, undated).<br />
Procedures and guidelines for access and collection <strong>of</strong> genetic resources in<br />
Malawi<br />
The NCRM through it GRBC has developed procedures and guidelines for access and collection <strong>of</strong> genetic<br />
resources in Malawi. The guidelines clearly stipulate <strong>the</strong> users, set out <strong>the</strong> objectives to be achieved by adhering to<br />
<strong>the</strong>m, define <strong>the</strong> categories <strong>of</strong> researchers, outline <strong>the</strong> procedures and requirements for application, assign<br />
responsibilities to affiliating and certifying institutions, prescribe conditions for research and material transfer<br />
agreements and circumstances under which <strong>the</strong> certificates can be withdrawn, and oblige researchers to follow a set<br />
standard on publications and data. The guidelines also give a list <strong>of</strong> certifying institutions and contain an application<br />
form.
9<br />
Lake Malawi Fisheries Management Symposium - Proceedings<br />
Procedures and guidelines for <strong>the</strong> conduct <strong>of</strong> research in Malawi<br />
The NCRM formed a taskforce that drafted <strong>the</strong> procedures and guidelines for <strong>the</strong> conduct <strong>of</strong> research in Malawi.<br />
The procedures are meant to enhance <strong>the</strong> quality <strong>of</strong> research in order to achieve competitiveness and relevance at<br />
national, regional and international levels. These procedures aim at assisting <strong>the</strong> NCRM and sectoral institutions to:<br />
• Appraise proposals for scientific, pr<strong>of</strong>essional and ethnical merits.<br />
• Provide mechanisms for monitoring and evaluation <strong>of</strong> research projects and activities.<br />
• Provide a framework for collaboration among researchers within <strong>the</strong> country and with international<br />
researchers.<br />
• Promote originality and complementarily in research in order to avoid unnecessary duplication.<br />
• Promote capacity building and encourage <strong>the</strong> development <strong>of</strong> sectoral programmes and research agenda.<br />
Ensure proper collection, acquisition, dissemination, storage and <strong>management</strong> <strong>of</strong><br />
research information<br />
The guidelines stipulate <strong>the</strong> need for affiliation and capacity building; provide for formats for review <strong>of</strong> research<br />
proposals, monitoring and evaluation, and dissemination <strong>of</strong> research outputs / results.<br />
NRCM as co-ordinator <strong>of</strong> research, science and technology<br />
NCRM has established several technical committees. The <strong>fisheries</strong> department is a member <strong>of</strong> committees such as<br />
<strong>the</strong> Agricultural Sciences Committee (ASC) and <strong>the</strong> Genetic Resources and Biotechnology Committee (GRBC).<br />
Likewise NRCM is a member <strong>of</strong> some committees that deal with <strong>fisheries</strong>. The NCRM in its quest to streamline <strong>the</strong><br />
research agenda in <strong>the</strong> agricultural and natural resources sector formulated <strong>the</strong> Malawi Agricultural and Natural<br />
Resources Research Master Plan. One <strong>of</strong> <strong>the</strong> taskforces that worked on <strong>the</strong> Master Plan was on <strong>fisheries</strong>. Through<br />
<strong>the</strong> Agricultural Services Project, <strong>the</strong> NCRM through <strong>the</strong> ASC funded research projects on <strong>fisheries</strong> which yielded<br />
some usable technologies under <strong>the</strong> Contract Research Programme.<br />
The way forward<br />
For Malawi to effectively conserve, protect and ensure sustainable utilisation <strong>of</strong> <strong>fisheries</strong> resources, <strong>the</strong>re a is need<br />
to do <strong>the</strong> following:<br />
• Document all <strong>the</strong> endemic and exotic <strong>fisheries</strong> resources that are in <strong>the</strong> country.<br />
• Put in place a strict monitoring system that will ensure that <strong>the</strong> purpose for <strong>the</strong> collection <strong>of</strong> <strong>the</strong> <strong>fisheries</strong><br />
resources collected is known. This means that <strong>the</strong> NCRM has to speed up <strong>the</strong> completion <strong>of</strong> <strong>the</strong> procedures<br />
and guidelines for <strong>the</strong> conduct <strong>of</strong> research in Malawi.<br />
• Ensure enforcement <strong>of</strong> <strong>the</strong> procedures and guidelines for access and collection <strong>of</strong> genetic resources in<br />
Malawi which requires building capacity in <strong>the</strong> various affiliating institutions, <strong>the</strong> NCRM and law enforces.<br />
• Create awareness on <strong>the</strong> various stakeholders on <strong>the</strong> value <strong>of</strong> Malawi’s <strong>fisheries</strong> resources and <strong>the</strong> need to<br />
protect <strong>the</strong>m. This will need to include <strong>the</strong> importance <strong>of</strong> adhering to guidelines and procedures as<br />
stipulated.<br />
• Involvement <strong>of</strong> <strong>the</strong> local communities in <strong>the</strong> protection, conservation and sustainable utilisation <strong>of</strong> <strong>fisheries</strong><br />
resources. Where this is already being done as shown in <strong>the</strong> paper, <strong>the</strong> system needs to be intensified and<br />
internalised.<br />
• Implement <strong>the</strong> recommendations.<br />
• Speed up <strong>the</strong> process <strong>of</strong> designing a benefit-sharing formula.<br />
• Adhere to international conventions and protocols that have a bearing on <strong>fisheries</strong> resources by<br />
implementing <strong>the</strong> provisions contained <strong>the</strong>rein.<br />
• Encourage <strong>the</strong> establishment <strong>of</strong> more protected areas for <strong>the</strong> conservation <strong>of</strong> <strong>fisheries</strong> resources.<br />
• Complete <strong>the</strong> formulation <strong>of</strong> contract agreement and prior informed consent forms.<br />
• Streng<strong>the</strong>n <strong>the</strong> technical arm <strong>of</strong> NRCM so that it can effectively play its co-ordination role.<br />
• Ano<strong>the</strong>r donor should be identified so that <strong>the</strong> Contract Research Programme is revitalised.<br />
Conclusion<br />
The paper has highlighted <strong>the</strong> importance <strong>of</strong> <strong>fisheries</strong> resources in Malawi in terms <strong>of</strong> food, income and tourism.<br />
Owing to <strong>the</strong> vital role <strong>the</strong>se <strong>fisheries</strong> resources play in <strong>the</strong> well being <strong>of</strong> <strong>the</strong> Malawi population, <strong>the</strong> need to
10<br />
Lake Malawi Fisheries Management Symposium - Proceedings<br />
conserve, protect and use <strong>the</strong>m sustainably cannot be over emphasised. Procedures and guidelines for access and<br />
collection <strong>of</strong> genetic resources in Malawi have been developed for use by various stakeholders and need to be<br />
adhered to in order to ensure that Malawi benefits from <strong>the</strong> use <strong>of</strong> its <strong>fisheries</strong> resources. Enforcement <strong>of</strong> regulations<br />
is key to protection <strong>of</strong> <strong>fisheries</strong> resources. There is a need for liaison among <strong>the</strong> various parties involved to ensure<br />
that all stakeholders understand what is required <strong>of</strong> <strong>the</strong>m.<br />
References<br />
National Research Council <strong>of</strong> Malawi, 2000. Policy Recommendation, Procedures and Guidelines on Access to Genetic<br />
Resources in Malawi : Incorporating Sustainable Utilisation <strong>of</strong> Genetic Resources into Biodiversity Management<br />
Planning. Report presented at a National Workshop on Plant Genetic Resources Conservation and Understanding<br />
International Instruments on Biodiversity Related Issues Held at Lilongwe Hotel , 10 th – 13 th January 2000.<br />
Ntupanyama, Y. M., Undated. Convention on Biological Diversity and Implementation in Malawi.
11<br />
Lake Malawi Fisheries Management Symposium - Proceedings<br />
A general overview <strong>of</strong> <strong>fisheries</strong> research and development in Malawi<br />
O. M. Kachinjika,<br />
Department <strong>of</strong> Fisheries, P. O. Box 593, Lilongwe, Malawi<br />
Abstract<br />
Historically, <strong>fisheries</strong> research and development in Malawi is strongly linked to Lake Malawi and <strong>the</strong> immense interest it has aroused<br />
to <strong>the</strong> outside world due to its sheer size (28 780 km²). Consequently, universal interest in <strong>the</strong> <strong>fisheries</strong> <strong>of</strong> Lake Malawi cropped up<br />
spontaneously, and has led to a number <strong>of</strong> research projects being commissioned, beginning with <strong>the</strong> surveys <strong>of</strong> 1939, although<br />
earlier attempts at taxonomic studies can be traced to over a century ago. The paper outlines major <strong>fisheries</strong> research projects that<br />
have been undertaken in Malawi. An attempt is made to outline how project results have influenced <strong>fisheries</strong> <strong>management</strong><br />
strategies and policies. In addition, <strong>the</strong> implications <strong>of</strong> <strong>management</strong> policy on research programs being undertaken is also<br />
highlighted. Current research programs and future plans are outlined and <strong>the</strong>ir relevance to <strong>fisheries</strong> <strong>management</strong> is evaluated<br />
Introduction<br />
Fisheries research and development in Malawi is strongly linked to Lake Malawi and <strong>the</strong> immense interest it has<br />
aroused to <strong>the</strong> outside world due to its sheer size (28 780 km 2 ), manifested by <strong>the</strong> fact that it is <strong>the</strong> third and ninth<br />
largest <strong>lake</strong> in Africa and <strong>the</strong> world, respectively. Consequently, universal interest in <strong>the</strong> <strong>fisheries</strong> <strong>of</strong> Lake Malawi<br />
can be traced to over a century ago when <strong>the</strong> first fish collections were taken by <strong>the</strong> early European explorers who<br />
came to this part <strong>of</strong> Africa, notably <strong>the</strong> early expeditions <strong>of</strong> Dr. David Livingstone (Tweddle, 1991). Specimens <strong>of</strong><br />
fish collected were deposited in natural history museums where early work was restricted to taxonomy.<br />
This paper outlines major episodes that have characterised <strong>the</strong> development <strong>of</strong> <strong>fisheries</strong> research and <strong>the</strong> <strong>fisheries</strong><br />
industry in Malawi by chronologically classifying to <strong>the</strong> present time <strong>the</strong> major projects that have taken place.<br />
These are classed as: (1) activities that took place during <strong>the</strong> period <strong>of</strong> limited or very low fishing effort; (2) projects<br />
that were aimed at maximising fish production; and (3) projects aimed at sustainability and conservation <strong>of</strong> fish and<br />
<strong>fisheries</strong> resources. For each research project, <strong>the</strong> funding agencies, objectives and major results or outputs are<br />
given in accordance with <strong>the</strong> <strong>fisheries</strong> policy and objectives prevailing at <strong>the</strong> particular time. This paper culminates<br />
in outlining currently running projects and a newly adopted approach to research project planning and development<br />
that is being advocated by <strong>the</strong> Department <strong>of</strong> Fisheries in Malawi. It <strong>the</strong>n concludes, by emphasising <strong>the</strong> need for<br />
continuous research to provide information required for effective and sustainable <strong>fisheries</strong> <strong>management</strong> measures.<br />
Phase 1- Period <strong>of</strong> limited or very low fishing effort (1939 – 1960)<br />
This is a time when <strong>the</strong> population in Malawi was small, <strong>the</strong> fishing effort was low, fishing gear was relatively<br />
ineffective and canoes could only fish in near-shore waters. This effectively meant that Malawi had large fish<br />
reserves in <strong>the</strong> areas that could not be fished. Fisheries research studies were initiated at this time, but most <strong>of</strong> it was<br />
taxonomic in nature, although some fish biology was undertaken. This period marks <strong>the</strong> first phase in <strong>fisheries</strong><br />
development.<br />
However, documented research works date just more than 50 years ago when Bertram, Borley and Trewavas<br />
conducted <strong>the</strong> first fishery surveys on Lake Malawi in 1939, and a report was produced in 1942 (Bertram et al.<br />
1942). This was followed by some biological research work on <strong>the</strong> chambo, Oreochromis spp. <strong>of</strong> <strong>the</strong> Sou<strong>the</strong>ast Arm<br />
<strong>of</strong> Lake Malawi, in 1945 – 1947, reported by Lowe (1952). These chambo studies started as a result <strong>of</strong> <strong>the</strong><br />
operations <strong>of</strong> purse seining, which were introduced into Lake Malawi in 1943, solely for <strong>the</strong> exploitation <strong>of</strong> this<br />
species group.<br />
A major breakthrough in <strong>fisheries</strong> research and development came in <strong>the</strong> mid-1950s with <strong>the</strong> formation <strong>of</strong> <strong>the</strong> Joint<br />
Fisheries Research Organisation (JFRO) in 1954. This was a research body that was shared by Malawi (<strong>the</strong>n<br />
Nyasaland) and Zambia (<strong>the</strong>n Nor<strong>the</strong>rn Rhodesia). In Malawi it had <strong>the</strong> mandate to carry out research work on Lake<br />
Malawi. The organisation set up its base at Nkhata Bay, where it carried out biological studies on some fish species,<br />
and major work on <strong>the</strong> inshore rock-dwelling fish species, locally known as ‘mbuna’. Summarily, <strong>the</strong> JFRO carried<br />
out taxonomic studies, descriptions <strong>of</strong> traditional fishing methods, experimental fishing, and also carried out limited<br />
limnological investigations. The report, by Jackson et al. (1963), covers information on hydrological data from <strong>the</strong><br />
<strong>lake</strong> and affluent rivers, invertebrate studies, a check-list on fishes and ecological zonations, biology <strong>of</strong><br />
commercially important species, experimental fishing and <strong>the</strong> traditional <strong>fisheries</strong>. The studies on mbuna, reported<br />
by Fryer (1959), contributed to evolutionary knowledge and formed a basis for subsequent studies and discussions<br />
on <strong>the</strong> topic.
12<br />
Lake Malawi Fisheries Management Symposium - Proceedings<br />
Phase 2- Maximisation <strong>of</strong> fish production (1961 –1996)<br />
The need to redirect <strong>fisheries</strong> research to comply to national food demands, and, <strong>fisheries</strong> development<br />
requirements, led to <strong>the</strong> research focus being shifted in 1962, to Monkey Bay, in <strong>the</strong> south <strong>of</strong> Lake Malawi where<br />
new laboratories had been constructed. This was necessitated by a number <strong>of</strong> reasons, which included <strong>the</strong> desire to<br />
understand <strong>the</strong> highly productive fishery that was being exploited by purse seines, and <strong>the</strong> ready availability <strong>of</strong><br />
communication and access facilities to <strong>the</strong> outside world. At first, <strong>the</strong> new station continued some <strong>of</strong> <strong>the</strong> work that<br />
was initiated in Nkhata Bay, which included physical limnology, fish taxonomy and biology, gradually focussing<br />
more on <strong>the</strong> biology <strong>of</strong> nchila, Labeo mesops and Kampango, Bagrus meridionalis, Tweddle (1991) and gill-netting<br />
trials.<br />
Projects<br />
Various projects were undertaken to respond to <strong>the</strong> increased demand for protein supplies to <strong>the</strong> Malawi population.<br />
The impetus for this phase began with <strong>the</strong> introduction <strong>of</strong> experimental trawling in <strong>the</strong> Sou<strong>the</strong>ast Arm <strong>of</strong> Lake<br />
Malawi in 1965, which led to <strong>the</strong> development <strong>of</strong> commercial trawling in 1968. This trawling targeted virgin stocks<br />
<strong>of</strong> cichlid species unknown to science. Consequently, research studies were initiated on <strong>the</strong> taxonomy and biology<br />
<strong>of</strong> <strong>the</strong>se cichlid fishes with <strong>the</strong> aim <strong>of</strong> establishing a <strong>management</strong> and monitoring regime for this new fishery.<br />
Preliminary data collected at this time was used in detailed stock assessment work which began in 1969, aiming at<br />
monitoring <strong>the</strong> effort being applied on <strong>the</strong> fish stocks and exploring <strong>the</strong> potential for trawl <strong>fisheries</strong> in o<strong>the</strong>r parts <strong>of</strong><br />
<strong>the</strong> <strong>lake</strong>. These surveys produced some punctuated series <strong>of</strong> biomass estimates for <strong>the</strong> demersal fish stocks, and are<br />
regarded as core trawl sampling programs <strong>of</strong> <strong>fisheries</strong> research on Lake Malawi.<br />
However, <strong>the</strong> first regular trawl surveys, were undertaken by <strong>the</strong> FAO Project on Integrated Fishery Development<br />
(FAO, 1976a). The main aim was to undertake studies on stock assessment to determine <strong>the</strong> optimum sustainable<br />
yield <strong>of</strong> <strong>the</strong> newly introduced mechanised trawl fishery in <strong>the</strong> sou<strong>the</strong>rn part <strong>of</strong> Lake Malawi. It operated on <strong>the</strong><br />
premise that <strong>the</strong> stocks being exploited by <strong>the</strong> trawl <strong>fisheries</strong> were limited and so, effort had to be monitored and<br />
<strong>management</strong> measures put in place, if sustainability was to be ensured. In addition to studies on <strong>the</strong> trawl <strong>fisheries</strong>,<br />
it also did analytical work in <strong>the</strong> artisanal <strong>fisheries</strong> <strong>of</strong> <strong>the</strong> SEA and SWA <strong>of</strong> <strong>the</strong> Lake Malawi. Management<br />
recommendations included restriction <strong>of</strong> <strong>the</strong> number <strong>of</strong> licenses to be issued in each demarcated area <strong>of</strong> sou<strong>the</strong>rn<br />
part <strong>of</strong> Lake Malawi and <strong>the</strong> setting <strong>of</strong> <strong>the</strong> a 38 mm minimum mesh size restriction for <strong>the</strong> trawl cod-end. A<br />
recording system for <strong>the</strong> traditional <strong>fisheries</strong> in <strong>the</strong> country, <strong>the</strong> Catch Assessment Surveys (CAS), was put in place,<br />
and is still being used with minor modifications except in <strong>the</strong> Mangochi Fisheries District area in <strong>the</strong> sou<strong>the</strong>rn part<br />
<strong>of</strong> Lake Malawi. When <strong>the</strong> regular surveys were discontinued, changes in exploited stocks were monitored through<br />
catch and effort data from <strong>the</strong> trawl <strong>fisheries</strong>. The results <strong>of</strong> <strong>the</strong> analysis <strong>of</strong> <strong>the</strong> catch and effort data showed that <strong>the</strong><br />
numerous demersal haplochromine species, that were being exploited, were sensitive to commercial fishing<br />
operations with <strong>the</strong> average size <strong>of</strong> fish being caught decreasing. It was also observed that <strong>the</strong>re was an increase in<br />
use <strong>of</strong> illegal mesh sizes and fishing in prohibited inshore areas.<br />
These observations led to <strong>the</strong> birth <strong>of</strong> <strong>the</strong> Demersal Fisheries Reassessment Project (ODA/FRAMS Project, 1992),<br />
which re-introduced regular fishing surveys that were carried out on a quarterly basis, using <strong>the</strong> same boat and<br />
methodology as before. Partially funded by an FAO Chambo Project, <strong>the</strong> aim was to repeat <strong>the</strong> experimental<br />
trawling surveys <strong>of</strong> <strong>the</strong> early 1970s to examine <strong>the</strong> current status <strong>of</strong> <strong>the</strong> stocks with a view to assess changes that had<br />
taken place in <strong>the</strong> fishery and to determine <strong>the</strong> effect <strong>of</strong> <strong>the</strong> 38 mm minimum mesh size. These surveys showed that<br />
<strong>the</strong> exploited biomass had declined in <strong>the</strong> heavily fished areas, and that <strong>the</strong> species composition <strong>of</strong> <strong>the</strong> catches had<br />
changed from being dominated by large cichlids to mainly small haplochromines. Consequently, it was conclude<br />
that <strong>the</strong> 38 mm <strong>of</strong> <strong>the</strong> cod end was ineffective in arresting this trend. In addition, <strong>the</strong> very low levels <strong>of</strong> biomass<br />
observed in Area A led to <strong>the</strong> prohibition <strong>of</strong> trawling in <strong>the</strong> area 1992.<br />
The quarterly stock assessment surveys were continued under an ICEIDA-funded project using <strong>the</strong> new powerful<br />
research vessel, <strong>the</strong> RV Ndunduma, Banda and Tomasson (1997). The findings indicated that <strong>the</strong>re was scope for<br />
expansion <strong>of</strong> <strong>the</strong> demersal <strong>fisheries</strong>, in <strong>the</strong> deep waters <strong>of</strong> <strong>the</strong> sou<strong>the</strong>rn part <strong>of</strong> <strong>the</strong> <strong>lake</strong>. This has resulted into <strong>the</strong><br />
development <strong>of</strong> <strong>the</strong> deepwater <strong>fisheries</strong> in <strong>the</strong> sou<strong>the</strong>ast arm <strong>of</strong> Lake Malawi, and <strong>the</strong>se are currently being exploited<br />
by three fishing vessels, viz: MV Kandwindwi, RV Ndunduma and <strong>the</strong> fishing vessel Chenga.<br />
In line with <strong>the</strong> <strong>fisheries</strong> development agenda <strong>of</strong> <strong>the</strong> 1970s, which focussed on maximising fish production from<br />
Lake Malawi and o<strong>the</strong>r water bodies in <strong>the</strong> country, a series <strong>of</strong> o<strong>the</strong>r research projects funded by donors were<br />
implemented. These include <strong>the</strong> UNDP/FAO Fishery Expansion Project (FAO, 1982a), which explored <strong>the</strong><br />
opportunities for <strong>fisheries</strong> development in <strong>the</strong> central and nor<strong>the</strong>rn parts <strong>of</strong> Lake Malawi. Recognising that inshore
13<br />
Lake Malawi Fisheries Management Symposium - Proceedings<br />
stocks were over-fished, <strong>the</strong> project concentrated on <strong>the</strong> biology <strong>of</strong> <strong>the</strong> deepwater fishes <strong>of</strong> usipa, utaka, ncheni,<br />
ndunduma, sanjika, and, studies on plankton and <strong>the</strong> physical environment. Results showed that <strong>the</strong> usipa stock was<br />
characterised by extreme differences in <strong>the</strong> abundance <strong>of</strong> year-classes, posing a problem for commercial<br />
exploitation. Acoustic surveys showed fish density to be much less than in <strong>the</strong> south. Subsequent trawling indicated<br />
a low potential catch rate and limited trawlable bottom in <strong>the</strong> North. It was summarily concluded that pelagic fish<br />
resources were not sufficient to support a mechanised commercial fishery. As a result, <strong>the</strong> recommendation was that<br />
long-term studies on all aspects <strong>of</strong> <strong>the</strong> pelagic zone limnology and ecology be undertaken. This recommendation<br />
gave way to <strong>the</strong> birth <strong>of</strong> <strong>the</strong> UK/SADC Project, which conducted comprehensive studies to assess <strong>the</strong> fishery<br />
potential <strong>of</strong> <strong>the</strong> pelagic zone (Menz, 1995).<br />
The UK/SADC Lake Malawi Pelagic Fisheries Assessment Project <strong>of</strong> 1991-1994, was a regional project between<br />
Malawi, Mozambique and Tanzania, which studied Lake Malawi as one ecosystem. The aim was to assess <strong>the</strong><br />
fishery potential <strong>of</strong> <strong>the</strong> pelagic zone, through various studies that included <strong>fisheries</strong> biology, stock assessment,<br />
aquatic ecosystem trophic relationships, and quantification and determination <strong>of</strong> economically sustainable yields<br />
from new <strong>fisheries</strong> targeted at pelagic fish species. An assessment <strong>of</strong> <strong>the</strong> standing biomass for <strong>the</strong> pelagic zone<br />
was made as well as its fishery potential. The <strong>lake</strong> fly was shown to be a component <strong>of</strong> <strong>the</strong> main energy<br />
pathways. Description <strong>of</strong> <strong>the</strong> physical and chemical characteristics <strong>of</strong> <strong>the</strong> <strong>lake</strong> provided baseline data for<br />
subsequent studies including monitoring <strong>of</strong> <strong>the</strong> <strong>lake</strong> environment.<br />
This project was followed by <strong>the</strong> GEF/SADC Lake Malawi/Nyasa Bio-diversity Conservation Project, which had a<br />
somewhat similar <strong>management</strong> arrangement to <strong>the</strong> above. The goal was to create <strong>the</strong> scientific, educational and<br />
policy basis for conserving <strong>the</strong> biological diversity <strong>of</strong> <strong>the</strong> <strong>lake</strong>, and to enable <strong>the</strong> riparian states to establish higher<br />
levels <strong>of</strong> sustainable production from <strong>the</strong> Lake’s resources consistent with preserving its bio-diversity and unique<br />
ecosystem. The outputs from <strong>the</strong> project include taxonomic reviews <strong>of</strong> certain taxa, documentation <strong>of</strong> benthic<br />
macro-invertebrates in <strong>the</strong> rocky near-shore zone <strong>of</strong> Lake Malawi/Nyasa, ecological and biological studies on<br />
selected species (Duponchelle, 2000), description <strong>of</strong> physical characteristics <strong>of</strong> <strong>the</strong> <strong>lake</strong>, and <strong>the</strong> development and<br />
execution <strong>of</strong> a Lake Malawi bio-diversity awareness program. It was <strong>the</strong>n recommended to continue monitoring<br />
<strong>the</strong> parameters that had been studied, and use <strong>the</strong> subsequent results to constitute an early warning system for <strong>the</strong><br />
changes taking place in <strong>the</strong> aquatic environment.<br />
O<strong>the</strong>r Projects<br />
Several o<strong>the</strong>r projects have been implemented, one <strong>of</strong> which is <strong>the</strong> Ornamental Fisheries Research Project (1980).<br />
This was a collaborative project, which was conducted by <strong>the</strong> Fisheries Research Unit and Rhodes University<br />
toge<strong>the</strong>r with o<strong>the</strong>r scientific collaborators. The aim was to provide a sound understanding <strong>of</strong> <strong>the</strong> techniques <strong>of</strong> this<br />
trade, potential, sustainability and threats to <strong>the</strong> stocks, toge<strong>the</strong>r with problems <strong>of</strong> escape and relocation <strong>of</strong> <strong>the</strong><br />
species in <strong>the</strong> <strong>lake</strong>. It resulted in <strong>the</strong> provision <strong>of</strong> <strong>management</strong> guidelines for <strong>the</strong> government to regulate <strong>the</strong> trade.<br />
It was generally observed that <strong>the</strong> ornamental fish business was self-regulating, because <strong>of</strong> market limitations.<br />
Never<strong>the</strong>less, <strong>the</strong> project increased <strong>the</strong> knowledge <strong>of</strong> <strong>the</strong> ecology <strong>of</strong> <strong>the</strong> inshore fish stocks and widened <strong>the</strong><br />
knowledge for <strong>management</strong> <strong>of</strong> <strong>the</strong> numerous mbuna fish species, and also contributed to advancements in<br />
conservation and tourism. With such information at its disposal, <strong>the</strong> project assisted in <strong>the</strong> early planning and<br />
development <strong>of</strong> <strong>the</strong> Lake Malawi National Park, which is <strong>the</strong> first <strong>lake</strong> underwater reserve in Africa. It also<br />
increased <strong>the</strong> worldwide attention in freshwater science and generated considerable awareness <strong>of</strong> Lake Malawi<br />
natural resources.<br />
Ano<strong>the</strong>r important study was carried out by <strong>the</strong> Chambo Fisheries Research Project, which aimed to carry out<br />
biological, stock assessment and socio-economic research to provide a <strong>management</strong> plan for <strong>the</strong> chambo <strong>fisheries</strong> <strong>of</strong><br />
<strong>the</strong> Sou<strong>the</strong>ast arm <strong>of</strong> Lake Malawi, <strong>the</strong> Upper Shire River and Lake Malombe. This was in response to mounting<br />
fishing pressure in <strong>the</strong> 1980s that had caused <strong>the</strong> stocks in each fishery to be fully or over exploited.<br />
Studies centred on <strong>the</strong> elucidation <strong>of</strong> <strong>the</strong> life histories <strong>of</strong> <strong>the</strong> three chambo species in <strong>the</strong> area. These included<br />
breeding, feeding, growth, distribution and migration; description <strong>of</strong> artisanal gears and, commercial and industrial<br />
<strong>fisheries</strong> including socio-economics; quantification <strong>of</strong> contributions <strong>of</strong> fish stocks o<strong>the</strong>r than chambo; and modelling<br />
<strong>of</strong> resource exploitation patterns. The <strong>management</strong> recommendations included licensing, gear use and<br />
specifications, closed seasons and future-monitoring regimes.<br />
The project findings brought to light <strong>the</strong> crash <strong>of</strong> <strong>the</strong> chambo stocks in Lake Malombe and <strong>the</strong>ir serious depletion in<br />
<strong>the</strong> Sou<strong>the</strong>ast arm <strong>of</strong> Lake Malawi (FAO, 1993). Initially, <strong>the</strong> project aim was to study <strong>the</strong> Oreochromis spp., <strong>the</strong>
14<br />
Lake Malawi Fisheries Management Symposium - Proceedings<br />
most economically valuable component in <strong>the</strong> Malawi <strong>fisheries</strong>, but ironically it concluded in a situation where<br />
smaller, haplochromine species were taking over as <strong>the</strong> important fishery. In Lake Malombe, chambo declined to<br />
only 6% <strong>of</strong> <strong>the</strong> total catch from 90% in 1976. The results <strong>of</strong> <strong>the</strong> Chambo Project confirmed <strong>the</strong> observations <strong>of</strong> <strong>the</strong><br />
fishing industry, which was reporting declining chambo catches and an increase in small-sized fish species as<br />
observed in Lake Malombe. These observations confirmed <strong>the</strong> fact that <strong>the</strong> <strong>fisheries</strong> sector was facing serious<br />
challenges in maintaining a balance between exploitation and conservation to achieve optimal utilisation without<br />
impairing long-term sustainability. In view <strong>of</strong> this, it was recognised that <strong>the</strong>re was a need to put in place an<br />
effective <strong>fisheries</strong> <strong>management</strong> regime that would ensure <strong>the</strong> sustainability <strong>of</strong> <strong>the</strong> fish stocks. Hence, it was<br />
recommended that national core research programmes be formulated to focus on identification <strong>of</strong> new unexploited<br />
stocks as well as <strong>the</strong> <strong>management</strong> <strong>of</strong> those stocks that are under heavy exploitation in order to sustain <strong>the</strong>ir<br />
production potentials and, where necessary, lead to a recovery <strong>of</strong> <strong>the</strong> stocks.<br />
In support <strong>of</strong> <strong>the</strong> objective <strong>of</strong> creating an effective <strong>management</strong> system while maximising production, an FAO<br />
Technical Consultation Paper (TCP) on data recording systems was commissioned under <strong>the</strong> Chambo Fisheries<br />
Research Project. This developed a gear-based, computerised data handling and analysis system, <strong>the</strong> Malawi<br />
Traditional Fisheries (MTF) for statistics in <strong>the</strong> Sou<strong>the</strong>ast arm <strong>of</strong> Lake Malawi, <strong>the</strong> Upper Shire and Lake Malombe<br />
(Alimoso et al. 1990). An evaluation <strong>of</strong> MTF and <strong>the</strong> comparison with <strong>the</strong> prevailing data collection system CAS<br />
led to <strong>the</strong> recommendation that MTF be adopted throughout <strong>the</strong> country . However, MTF proved to be costly, so<br />
that it is only carried out in <strong>the</strong> south <strong>of</strong> Lake Malawi in Mangochi District. However, Coulter (1993), referring to<br />
<strong>the</strong> need to review data collection systems, noted that statistical data is very important for monitoring purposes, and<br />
recommended a recording system that is sufficiently sensitive to detect changes in effort and CPUE, while saving<br />
costs.<br />
In response to <strong>the</strong> need to develop <strong>the</strong> <strong>fisheries</strong> industry, <strong>the</strong> WB/IDA-Fisheries Development Project was<br />
commissioned, and aimed at institutional building. The main objective was to assist Malawi to realise more fully<br />
<strong>the</strong> potential contribution <strong>of</strong> <strong>the</strong> fishery sector to <strong>the</strong> economy, while ensuring that <strong>of</strong>f-take did not exceed<br />
sustainable yields. This was to be achieved through increasing fish production, generating additional <strong>of</strong>f-farm<br />
employment and income, conservation <strong>of</strong> <strong>the</strong> natural resource and prevention <strong>of</strong> environmental degradation and<br />
improving institutional capacity for <strong>fisheries</strong> sector policy formulation, research planning, monitoring and<br />
control. Work <strong>of</strong> <strong>the</strong> research component <strong>of</strong> <strong>the</strong> project confirmed <strong>the</strong> presence <strong>of</strong> deepwater fish stocks reported<br />
in earlier studies and led to <strong>the</strong> development <strong>of</strong> <strong>the</strong> deep water <strong>fisheries</strong> which are now being exploited by newly<br />
introduced stern trawlers. In addition, determinations and assessments were made <strong>of</strong> biomass indices and species<br />
composition <strong>of</strong> <strong>the</strong> demersal fish stocks in both heavily and lightly exploited areas, resilience <strong>of</strong> <strong>the</strong> demersal fish<br />
stocks to exploitation, and economic viability <strong>of</strong> using a big fishing vessel.<br />
O<strong>the</strong>r major studies that have been undertaken on Lake Malawi include <strong>the</strong> Project on <strong>the</strong> Comprehensive Study <strong>of</strong><br />
Lake Malawi Ecology for Sustainable Development, which concentrated on <strong>the</strong> ecological aspects <strong>of</strong> <strong>fisheries</strong>. The<br />
goal <strong>of</strong> <strong>the</strong> project was to develop a research system and accumulate scientific knowledge on Lake Malawi and its<br />
surroundings for use by researchers, local communities and policy makers. The specific objectives were to: (1)<br />
streng<strong>the</strong>n ecological research and human capacity for sustainable utilisation and proper <strong>management</strong> <strong>of</strong> natural<br />
resources on Lake Malawi; (2) develop comprehensive research methods for sustainable utilisation <strong>of</strong> fish resources<br />
and; (3) establish bilateral research partnership, between Japan and Malawi (Lake Malawi Ecology Project, 1999).<br />
The project trained Malawians through postgraduate training, technician level training, and counterpart visits. It<br />
also established <strong>the</strong> Molecular Biology and Ecology Research Unit (MBERU) in <strong>the</strong> Biology Department <strong>of</strong> <strong>the</strong><br />
University <strong>of</strong> Malawi, and a field station at Cape Maclear.<br />
Environmental problems have also been addressed in <strong>the</strong> <strong>fisheries</strong> sector, one <strong>of</strong> which is <strong>the</strong> elimination <strong>of</strong> nuisance<br />
aquatic weeds. The Malawi National Water Hyacinth Control Project was set up with <strong>the</strong> aim <strong>of</strong> controlling <strong>the</strong><br />
spread <strong>of</strong> water hyacinth in Malawi’s water bodies beginning with <strong>the</strong> problems in <strong>the</strong> Shire River system. The<br />
objectives <strong>of</strong> <strong>the</strong> project are: (1) identification and development <strong>of</strong> biological control agents; (2) assessment <strong>of</strong> <strong>the</strong><br />
effects <strong>of</strong> water hyacinth on fish and invertebrate abundance and bio-diversity; (3) assessment <strong>of</strong> <strong>the</strong> impact on<br />
riparian communities; (4) establishment <strong>of</strong> a capacity to carry out limited spot chemical treatment <strong>of</strong> water<br />
hyacinth; (5) informing <strong>of</strong> local communities and <strong>the</strong> general public <strong>of</strong> <strong>the</strong> dangers <strong>of</strong> <strong>the</strong> weed and (6) support to<br />
research activities on <strong>the</strong> economic utilisation <strong>of</strong> water hyacinth. So far, <strong>the</strong> project has been able to establish<br />
breeding sites for biological control agents at Makhanga and Mangochi and rearing and distribution <strong>of</strong> <strong>the</strong><br />
biological agents is in progress. Creation <strong>of</strong> community awareness is ongoing in different districts.
15<br />
Lake Malawi Fisheries Management Symposium - Proceedings<br />
Several o<strong>the</strong>r projects have been carried out on Lake Malawi and in various ways have contributed to <strong>the</strong> knowledge<br />
and understanding <strong>of</strong> <strong>the</strong> status <strong>of</strong> <strong>the</strong> <strong>fisheries</strong>, and recommended various effective and sustainable strategies for<br />
exploitation and <strong>management</strong> (Appendix 1). These include <strong>the</strong> Traditional Fisheries Assessment Project, which<br />
carried out a revision and development <strong>of</strong> monitoring and assessment systems for traditional <strong>fisheries</strong>, and made<br />
recommendations for modification <strong>of</strong> <strong>the</strong> existing <strong>fisheries</strong> regulations at <strong>the</strong> time. The Fisheries Research and<br />
Management Support (FRAMS) Project aimed at streng<strong>the</strong>ning <strong>the</strong> capacity <strong>of</strong> <strong>the</strong> Department <strong>of</strong> Fisheries in<br />
development <strong>of</strong> research and formulation <strong>of</strong> policy, and this resulted in <strong>the</strong> review <strong>of</strong> <strong>management</strong> and policy<br />
options <strong>of</strong> <strong>the</strong> <strong>fisheries</strong> sector. Research under <strong>the</strong> FRAMS Project, investigated <strong>the</strong> distribution and ecology <strong>of</strong> <strong>the</strong><br />
principal fish species <strong>of</strong> economic importance, involving investigations <strong>of</strong> catches in all parts <strong>of</strong> <strong>the</strong> <strong>lake</strong> in all<br />
habitats. Consequently, results <strong>of</strong> <strong>the</strong> FRAMS Project plus consultations with <strong>the</strong> fishing communities, led to <strong>the</strong><br />
establishment <strong>of</strong> <strong>the</strong> 19 mm mesh size restriction for <strong>the</strong> Nkacha net which exploits small haplochromines.<br />
Since 1966, research projects have been undertaken in o<strong>the</strong>r smaller water bodies with varying degrees <strong>of</strong><br />
importance in <strong>fisheries</strong> ranging from significance at national level, to local significance to <strong>the</strong> communities in <strong>the</strong><br />
riparian areas. The water bodies <strong>of</strong> significance are Lakes Malombe, Chirwa, Chiuta and <strong>the</strong> Lower Shire River<br />
system, which in total contribute about 30% <strong>of</strong> <strong>the</strong> total fish catch in Malawi. In general, <strong>the</strong> aim was to carry out<br />
occasional studies <strong>of</strong> salient aspects as opportunity and time permitted. The projects recommended <strong>the</strong><br />
establishment <strong>of</strong> regular catch monitoring programs, improvement <strong>of</strong> fish processing techniques and establishment<br />
<strong>of</strong> effective communication and access to <strong>the</strong>se <strong>fisheries</strong>. In perspective, it was visualised that <strong>the</strong> problems in <strong>the</strong>se<br />
water bodies would encompass environmental and socio-economic aspects, emanating from <strong>the</strong> increased use <strong>of</strong><br />
seine nets, which could lead to weed removal and a reduction in habitat diversity and exposure <strong>of</strong> fish stocks to<br />
over-fishing (Tweddle, 1983, 1991). Social-economically, it was visualised that an increase in population around<br />
<strong>the</strong>se water bodies would lead to increased pressure on <strong>the</strong> stocks, so that, coupled with any large natural<br />
fluctuations in <strong>the</strong> fishery, <strong>the</strong> riparian communities would face dire social and economic problems.<br />
Research by o<strong>the</strong>r organisations<br />
Various research programs on <strong>the</strong> <strong>fisheries</strong> <strong>of</strong> Malawi are also being undertaken by o<strong>the</strong>r organisations, and <strong>the</strong>se<br />
include <strong>the</strong> University <strong>of</strong> Malawi through its constituent colleges <strong>of</strong> Bunda College <strong>of</strong> Agriculture, Chancellor<br />
College and <strong>the</strong> Centre for Social Research. Some <strong>of</strong> <strong>the</strong> work done at Bunda College <strong>of</strong> Agriculture covers <strong>the</strong><br />
ecology <strong>of</strong> <strong>the</strong> catfish, Bathyclarias spp. and cichlid species <strong>of</strong> Lake Malombe. Chancellor College has recently<br />
concluded a research project on <strong>the</strong> ‘Comprehensive Study <strong>of</strong> <strong>the</strong> Lake Malawi Ecology for Sustainable Utilisation<br />
<strong>of</strong> <strong>the</strong> Lake Environment’ and it continues <strong>the</strong> genetic classification <strong>of</strong> Malawi fishes using <strong>the</strong> facilities at <strong>the</strong><br />
Molecular Biology and Ecology Research Unit. The Centre for Social Research is carrying out collaborative studies<br />
with <strong>the</strong> University <strong>of</strong> East Anglia, on <strong>the</strong> socio-economic aspects <strong>of</strong> <strong>fisheries</strong> and fishing communities. Rhodes<br />
University and <strong>the</strong> JLB Smith Institute <strong>of</strong> Ichthyology have collaborated with a number <strong>of</strong> institutions in Malawi and<br />
have priously participated in studies on <strong>the</strong> ornamental <strong>fisheries</strong> <strong>of</strong> Lake Malawi. In some cases, individual<br />
scientists have been able to undertake research on Lake Malawi after obtaining grants from research institutions,<br />
ei<strong>the</strong>r in <strong>the</strong>ir own capacity or as students.<br />
Phase 3 - Fisheries resource <strong>management</strong>, sustainability and conservation (1997<br />
– to <strong>the</strong> present)<br />
Despite <strong>the</strong> implementation <strong>of</strong> <strong>the</strong> various research projects in Lake Malawi and o<strong>the</strong>r water bodies, fish catches<br />
have been declining. Notable is <strong>the</strong> situation in Lake Malombe, where annual fish landings declined to less than<br />
3 000 tons in <strong>the</strong> 1990s from an average <strong>of</strong> more than 10 000 tons in <strong>the</strong> 1980s (Bulirani et al. 1999). These<br />
observations were mainly attributed to overfishing although environmental problems are also reported to be taking<br />
ground.<br />
However, <strong>the</strong> ineffectiveness <strong>of</strong> past <strong>management</strong> regulations, emanating from past research and development<br />
efforts has given important lessons to be considered in any future plans. These include:<br />
• Limited spatial coverage <strong>of</strong> research programs.<br />
• Need for a continuous review <strong>of</strong> <strong>fisheries</strong> <strong>management</strong> regulations.<br />
• Resource exploitation should conform to <strong>the</strong> objectives <strong>of</strong> sustainable <strong>management</strong> and conservation <strong>of</strong><br />
bio-diversity Research on Malawi’s water bodies should be systematic and based on <strong>the</strong>mes.<br />
• Management guidelines for <strong>the</strong> <strong>management</strong> <strong>of</strong> Lake Malawi to be formulated based on broad stakeholder<br />
consultation.<br />
• Management recommendations have to be adhered to if <strong>the</strong> goal <strong>of</strong> sustainable utilisation and conservation<br />
<strong>of</strong> biodiversity is to be achieved.
16<br />
Lake Malawi Fisheries Management Symposium - Proceedings<br />
In view <strong>of</strong> <strong>the</strong>se experiences, <strong>the</strong> Department <strong>of</strong> Fisheries, with <strong>the</strong> assistance <strong>of</strong> <strong>the</strong> GTZ-funded National Aquatic<br />
Resource Management Program (NARMAP), has reviewed <strong>the</strong> <strong>fisheries</strong> policy and developed <strong>the</strong> Fisheries and<br />
Aquaculture Policy (1999), and a new Fisheries Conservation and Management Act (1997). These are now acting as<br />
a guiding torch for <strong>fisheries</strong> research and development in Malawi. Consequently, <strong>the</strong> mission <strong>of</strong> <strong>the</strong> Department <strong>of</strong><br />
Fisheries has been reviewed, as ‘to provide optimal framework conditions and excellent services to enable national<br />
<strong>fisheries</strong> industry to satisfy local demand for fish and increase incomes <strong>of</strong> people dependent on fish’. This is with<br />
<strong>the</strong> overall objective <strong>of</strong> enhancing <strong>the</strong> quality <strong>of</strong> life for fishing communities by increasing harvests within<br />
sustainable yields and promoting aquaculture as a source <strong>of</strong> income and to supplement fish supply from natural<br />
waters’.<br />
To achieve this policy objective, <strong>the</strong> Department <strong>of</strong> Fisheries recognises <strong>the</strong> fact that harvesting <strong>of</strong> fish stocks should<br />
be based on established sustainable yields <strong>of</strong> different species/stocks and that opportunities have to be identified to<br />
expand existing and/or new aquatic resources. Therefore, <strong>the</strong> research mission is ‘to provide information necessary<br />
for sustainable exploitation, <strong>management</strong>, conservation <strong>of</strong> bio-diversity and investment in <strong>the</strong> <strong>fisheries</strong> sector<br />
through appropriate biological, technological, socio-economic and environmental research programs’. The<br />
objectives are:<br />
• Accumulate comprehensive data on all <strong>fisheries</strong> resources for all major water bodies <strong>of</strong> Malawi.<br />
• Provide information on <strong>management</strong> <strong>of</strong> <strong>fisheries</strong> resources and aquatic environment.<br />
• Provide information on viable investment opportunities in <strong>the</strong> <strong>fisheries</strong> sector<br />
• Provide information necessary for <strong>the</strong> maintenance <strong>of</strong> aquatic biodiversity<br />
• Establish a fully operational taxonomy section by <strong>the</strong> year 2003<br />
Current and future research programs <strong>of</strong> <strong>the</strong> <strong>fisheries</strong> research unit<br />
The Department <strong>of</strong> Fisheries relies heavily on scientific information for <strong>the</strong> development <strong>of</strong> protocols and plans with<br />
which to manage Malawi’s <strong>fisheries</strong>. Essentially, sustainable <strong>management</strong> is dependent on <strong>the</strong> ability <strong>of</strong> <strong>fisheries</strong><br />
managers to determine at what levels <strong>of</strong> fishing effort, and at which gear selectivity scenarios <strong>the</strong> catch <strong>of</strong> a target<br />
species is sustainable and <strong>the</strong> spawning stock remains adequate. Therefore, <strong>the</strong> main role <strong>of</strong> <strong>the</strong> Malawi’s<br />
Government’s Fisheries Research Unit (FRU) is to provide <strong>the</strong> Department <strong>of</strong> Fisheries with such information based<br />
on understanding <strong>of</strong> <strong>the</strong> biology, life history and distribution <strong>of</strong> <strong>the</strong> target species as well as an understanding <strong>of</strong> <strong>the</strong><br />
harvesting <strong>fisheries</strong>. To achieve this, <strong>the</strong> FRU has adopted a holistic approach whereby research activities are<br />
geared towards <strong>the</strong> ultimate formulation <strong>of</strong> a <strong>management</strong> strategy for Malawi’s <strong>fisheries</strong>. This is depicted in Figure<br />
1.<br />
Therefore, current research programs have been formulated in a way that <strong>the</strong>y are aimed at addressing <strong>the</strong> immediate<br />
need <strong>of</strong> formulating strategies for <strong>the</strong> <strong>management</strong> <strong>of</strong> <strong>the</strong> fish stocks facing heavy exploitation pressure, while at <strong>the</strong><br />
same time exploring opportunities to expand existing and/or develop new <strong>fisheries</strong> resources. Such an approach is<br />
clearly illustrated in <strong>the</strong> activities that have been planned for <strong>the</strong> July 2000 – June 2001 financial year (Table 1),<br />
where <strong>the</strong>y have also been given a priority ranking depending on <strong>the</strong> state <strong>of</strong> <strong>the</strong> <strong>fisheries</strong> and <strong>the</strong> urgency with<br />
which, <strong>management</strong> information should be acquired. In this program, <strong>the</strong> research activities fall under <strong>the</strong> five<br />
categories that have been shown in Figure 1, namely gear selectivity, utilisation trends, biological surveys,<br />
population dynamics and social and economic research.
17<br />
Lake Malawi Fisheries Management Symposium - Proceedings<br />
Table 1. Research projects planned for implementation in <strong>the</strong> year 2000/2001 (after Banda et al. 2001).<br />
Project Title Priority<br />
Biological <strong>management</strong> parameters for target species in Lake Malawi 1<br />
Monitoring <strong>of</strong> catch and effort in artisenal <strong>fisheries</strong> 1<br />
Demersal monitoring surveys 1<br />
Kauni Fishery selectivity survey. 2<br />
Chilimira fishery selectivity. 2<br />
Gillnet selectivity surveys. 2<br />
Handline catch assessment and gear selectivity. 2<br />
Traditional gear selectivity surveys (Nor<strong>the</strong>rn Lake Malawi) 2<br />
A preliminary study <strong>of</strong> <strong>the</strong> effectiveness <strong>of</strong> mon<strong>of</strong>ilament gillnets in Lake Malawi 2<br />
Lake Malombe assessment programmes 2<br />
Lake Chiuta assessment programmes 2<br />
Commercial pair trawl selectivity 3<br />
Trawl net selectivity survey 3<br />
The economics <strong>of</strong> processing and distribution <strong>of</strong> small scale fishing in Lake<br />
3<br />
Malawi<br />
Demersal exploratory surveys 3<br />
Pelagic exploratory surveys 3<br />
Limnological Surveys 3<br />
Aquatic ecology and <strong>fisheries</strong> <strong>of</strong> Lake Chikukutu 4<br />
The research plans presented can be classified as ei<strong>the</strong>r discrete or long term monitoring. Discrete surveys such as<br />
<strong>the</strong> determination <strong>of</strong> species and size selectivity <strong>of</strong> <strong>the</strong> chilimira, kauni, gill net and trawl <strong>fisheries</strong> in Lake Malawi,<br />
<strong>the</strong> determination <strong>of</strong> biological parameters for major target species or rapid stock assessment <strong>of</strong> small <strong>lake</strong>s are<br />
surveys with outcomes achievable during short-term research programs (1-5) years. Long-term monitoring<br />
programs, such as catch and effort surveys and trawl surveys can only yield <strong>management</strong> information if <strong>the</strong>y are<br />
sustained over long periods (20 years). The classification <strong>of</strong> research programs on <strong>the</strong>se criteria has major<br />
implications on sources <strong>of</strong> funding. This is because while <strong>the</strong> funding for discrete surveys could be secured on an ad<br />
hoc basis from a variety <strong>of</strong> sources, <strong>the</strong> sustainability <strong>of</strong> long-term monitoring programs can only be ensured if <strong>the</strong>y<br />
are budgeted from within <strong>the</strong> Department <strong>of</strong> Fisheries. As a result, all <strong>the</strong> long-term research programs are being<br />
sponsored by a Fisheries Research Fund (FRF) that was set up under <strong>the</strong> Fisheries Conservation and Management<br />
Act (1997), while <strong>the</strong> majority <strong>of</strong> <strong>the</strong> discrete surveys are currently financed by NARMAP.<br />
Species biology<br />
• Size at maturity.<br />
• Reproductive periodicity.<br />
• Reproductive behaviour<br />
• Fecundity.<br />
• Distribution.<br />
• Age & growth.<br />
Population dynamics<br />
• Stock size.<br />
• Population structure.<br />
• Mortality rates.<br />
Determine target<br />
species<br />
Identify potential<br />
over-utilisation<br />
Predictive<br />
modelling<br />
Identify biological<br />
<strong>management</strong><br />
targets<br />
Identify<br />
implementation<br />
constraints<br />
MANAGEMENT STRATEGY<br />
Gear selectivity<br />
• Species selectivity<br />
• Size selectivity<br />
Utilisation trends<br />
• Catch rates<br />
• Effort levels<br />
Social & Economic inputs<br />
• Fishing economics.<br />
• Marketing structures.<br />
• Traditional <strong>management</strong> systems.<br />
• Stakeholders & ownership.<br />
• Migration.<br />
• Social dimensions.<br />
Figure 1. Input requirements for <strong>the</strong> formulation <strong>of</strong> a <strong>management</strong> strategy for Malawi’s <strong>fisheries</strong> (after<br />
Banda et al. 2001).
18<br />
Lake Malawi Fisheries Management Symposium - Proceedings<br />
Conclusion<br />
Summarily, Fisheries Research and Management in Malawi has undergone an evolution process dictated by <strong>the</strong><br />
prevailing social and economic demands <strong>of</strong> each period in time. The first fish specimens were collected by<br />
enthusiasts based on interest during <strong>the</strong> early years <strong>of</strong> contact with Europeans. At that time <strong>the</strong> population in<br />
Malawi was small, <strong>the</strong> fishing effort was low, fishing gear was relatively ineffective, and canoes could only fish in<br />
near-shore waters. This effectively meant that Malawi had large fish reserves in <strong>the</strong> areas that were unable to be<br />
fished. Most <strong>of</strong> <strong>the</strong> biological research at this time was taxonomic in nature, although some fish biology was<br />
undertaken.<br />
The next phase focussed on expanding <strong>the</strong> fishery, increasing fish production, and attempts to improve resource<br />
<strong>management</strong> to ensure sustainability. This period saw <strong>the</strong> introduction <strong>of</strong> motorisation and <strong>the</strong> establishment <strong>of</strong> <strong>the</strong><br />
commercial sector, which meant that fishing was now possible in previously unfished areas. The research moved<br />
towards exploratory fishing for unutilised stocks, predicting effects <strong>of</strong> intensified effort, monitoring fish stocks,<br />
refining <strong>management</strong> regulations and seeking to understand <strong>the</strong> biological basis <strong>of</strong> sustainability. Consequently,<br />
research has tended to be event-driven and reactive and has followed <strong>the</strong> occurrence <strong>of</strong> certain <strong>fisheries</strong> production<br />
efforts, which might have seriously affected <strong>the</strong> fish in a sudden manner. These events have usually been due to<br />
sudden increase and unsustainable pressure <strong>of</strong> exploitation <strong>of</strong> a finite resource. The approach was always postmortem<br />
and focussed on finding out what had gone wrong and <strong>the</strong>n working out corrective measures.<br />
In view <strong>of</strong> <strong>the</strong> failure <strong>of</strong> previous efforts to fishery <strong>management</strong> approaches such as mesh size restrictions, closed<br />
seasons etc. <strong>the</strong> Department <strong>of</strong> Fisheries is now aiming at providing information necessary for sustainable<br />
exploitation, <strong>management</strong>, conservation <strong>of</strong> bio-diversity and investment in <strong>the</strong> <strong>fisheries</strong> sector through appropriate<br />
research studies. It is also strongly promoting <strong>the</strong> participation <strong>of</strong> <strong>the</strong> fishing communities in resource <strong>management</strong>.<br />
This means that <strong>the</strong>re is a dire need for research to be undertaken to address <strong>the</strong> following:<br />
• A review <strong>of</strong> old <strong>fisheries</strong> <strong>management</strong> regulations.<br />
• While <strong>fisheries</strong> research should respond to <strong>the</strong> immediate needs <strong>of</strong> <strong>the</strong> fishing industry, due regard should<br />
be given to sustainable <strong>management</strong> and conservation <strong>of</strong> bio-diversity.<br />
• Research on Malawi’s water bodies should be systematic and based on <strong>the</strong>mes.<br />
• Management guidelines for <strong>the</strong> <strong>management</strong> <strong>of</strong> Lake Malawi to be formulated based on broad stakeholder<br />
consultation.<br />
• Management recommendations have to be taken up by responsible authorities if our <strong>fisheries</strong> resources are<br />
to be sustained through time.<br />
To ensure orderly and systematic conduct <strong>of</strong> research in Malawi, that ensures that <strong>the</strong> country benefits from its<br />
natural resources, <strong>the</strong> Malawi Government has, through <strong>the</strong> National Research Council <strong>of</strong> Malawi, launched <strong>the</strong><br />
‘Procedures and Guidelines for Access and Collection <strong>of</strong> Genetic Resources in Malawi’. This is to be followed by<br />
all those intending to carry out research on genetic resources <strong>of</strong> Malawi.<br />
All in all, it should be concluded that <strong>fisheries</strong> research should lead to <strong>the</strong> establishment <strong>of</strong> appropriate <strong>fisheries</strong><br />
<strong>management</strong> regimes that ensure sustainable exploitation <strong>of</strong> fish stocks, protection <strong>of</strong> aquatic ecosystem integrity’<br />
and conservation <strong>of</strong> bio-diversity.<br />
References<br />
Lake Malawi Ecology Project, 1999. First Annual Report, May, 1998 – April, 1999. Department <strong>of</strong> Biology, University <strong>of</strong><br />
Malawi, 50p.<br />
Menz, A. (ed.) (1995). The Fishery Potential and Productivity <strong>of</strong> <strong>the</strong> Pelagic Zone Of Lake Malawi/Niassa. Chatham, UK:<br />
Natural Resources Institute.<br />
Bulirani, A.E., Banda, M.C., Palsson, O.K., Weyl, O.L.F., Kanyerere, G.Z., Manase, M.M. & Sipawe, R.D., 1999. Fish Stocks<br />
and Fisheries <strong>of</strong> Malawian Waters: Resource Report. Government <strong>of</strong> Malawi, Fisheries Department, Fisheries Research<br />
Unit.54pp.<br />
Ribbink, A.J. (1980). The ornamental fish project: report and recommendations<br />
Ricardo Bertram, C.K., H.J.H. Borley and E. Trewavas (1942). Report on <strong>the</strong> fish and <strong>fisheries</strong> <strong>of</strong> Lake Nyasa. London, Crown<br />
Agents, 181 p.<br />
Tweddle, D. (1983). The fish and <strong>fisheries</strong> <strong>of</strong> Lake Chiuta. Luso:J.Sci.Tech.(Malawi), 4(2):55-83.<br />
Tweddle, D. (1991). Twenty years <strong>of</strong> <strong>fisheries</strong> research in Malawi. Fisheries Bulletin No. 7, Fisheries Department, Ministry <strong>of</strong><br />
Forestry and Natural Resources, Malawi.<br />
Tweddle, D. and B.J. Mkoko (1986). A limnological bibliography <strong>of</strong> Malawi. CIFA Occ.Pap., 13:75 p.<br />
Duponchelle, F. (ed.) (2000). Fish Ecology Report: SADC /GEF Lake Malawi/Nyasa Biodiversity Conservation Project;<br />
Ministry <strong>of</strong> Natural Resources and Environmental Affairs, Lilongwe, Malawi.
19<br />
Lake Malawi Fisheries Management Symposium - Proceedings<br />
FAO (1982a). Fishery Expansion Project: findings and recommendations. Rome, FAO, FI:DP/MLW/75/019 Technical Report,<br />
21 p.<br />
Resource Report (1999). Fish stocks and Fisheries <strong>of</strong> Malawian Waters. Fisheries Research Unit, Fisheries Department, Malawi<br />
Fryer, G. (1959). The tropic interrelationships and ecology <strong>of</strong> some littoral communities <strong>of</strong> Lake Nyasa with especial reference<br />
to <strong>the</strong> fishes, and a discussion <strong>of</strong> <strong>the</strong> evolution <strong>of</strong> a group <strong>of</strong> rock-frequenting Cichlidae. Proc.Zool.Soc.Lond.,<br />
132(2):153-281<br />
Coulter, G. W. (1993). Report on Fisheries Research and Management Strategies. ODA/FRAMS Project, Malawi, 58p<br />
Banda , M. C. and T. Tomason, 1997. Demersal fish stocks in sou<strong>the</strong>rn Lake Malawi: Stock assessment and exploitation.<br />
Fisheries Bulletin No. 35, Fisheries Department, Malawi. 39pp.<br />
Banda, M.C., Chisambo, J., Sipawe, R.D., Mwakiyongo, K.R. & Weyl, O.L.F. 2001. Fisheries Research Unit, research plan:<br />
2000 & 2001. Fisheries Bulletin No. 44.<br />
FAO (1976a). Promotion <strong>of</strong> Integrated Fishery Development, Malawi: Project findings and recommendations. Rome, FAO,<br />
Terminal Report, 36 p.<br />
Jackson, P.B.N., T.D. Iles, D. Harding and G. fryer (1963). Report on <strong>the</strong> survey <strong>of</strong> Nor<strong>the</strong>rn Lake Nyasa 1954-55. Zomba,<br />
Government, 171 p.<br />
ODA/FRAMS Project (1992). Demersal Fisheries Reassessment Project, Preliminary Project Report (November, 1987 – May,<br />
1992)<br />
Lowe, R.H. (1952). Report on <strong>the</strong> Tilapia and o<strong>the</strong>r fish and <strong>fisheries</strong> <strong>of</strong> Lake Nyasa 1945-47. Part 2<br />
Fish.Publ.Colon.Off.Lond., 1(2): 126 p.<br />
Alimoso, S. B., Seisay, M. D. B. & Van Zalinge, N. P. 1990. An efficient method for catch-sampling <strong>of</strong> <strong>the</strong> artisanal chambo<br />
<strong>fisheries</strong> <strong>of</strong> <strong>the</strong> Sou<strong>the</strong>ast Arm <strong>of</strong> Lake Malawi, <strong>the</strong> Upper Shire River and Lake Malombe. FI: DP/MLW/86/013 Field<br />
Document 6.<br />
FAO (1993). Fisheries <strong>management</strong> in <strong>the</strong> sou<strong>the</strong>ast arm <strong>of</strong> Lake Malawi, <strong>the</strong> Upper Shire River and Lake Malombe, with<br />
particular reference to <strong>the</strong> <strong>fisheries</strong> on chambo (Oreochromis spp). CIFA Technical Paper, No. 21. Rome, FAO, 113p.
20<br />
Lake Malawi Fisheries Management Symposium - Proceedings<br />
Economic Security and Sustainable Programmes for <strong>the</strong> African Great Lakes<br />
Benjamin P. Ngatunga 1 & Anthony Ribbink 2<br />
1 Senior Research Officer (Ichthyology), Tanzania Fisheries Research Institute, Kyela Centre, P.O. Box 98, Kyela, Mbeya Region,<br />
East Africa, [bpngatunga@hotmail.com; tafiriki@africaonline.co.tz].<br />
2 Senior Specialist Scientist, JLB Smith Institute <strong>of</strong> Ichthyology, Somerset Street, Private Bag 1015, Grahamstown 6140, South<br />
Africa, [A.Ribbink@ru.ac.za].<br />
Abstract<br />
Unquestionably, <strong>the</strong> responsibility for research, <strong>management</strong> and conservation <strong>of</strong> <strong>the</strong> aquatic resources <strong>of</strong> any nation reside with<br />
that nation. If resources are shared, such as is <strong>the</strong> case where different countries border on a single <strong>lake</strong> or river, <strong>the</strong>n <strong>the</strong><br />
responsibility is shared and co-<strong>management</strong> is required. In much <strong>of</strong> Africa, full responsibility for national resources has not been<br />
achieved. During post-colonial eras work on aquatic resources remained disproportionately in <strong>the</strong> hands <strong>of</strong> foreign workers. Initially<br />
this was due largely to both <strong>the</strong> lack <strong>of</strong> skilled capacity in Africa and to <strong>the</strong> economic inability <strong>of</strong> <strong>the</strong> new governments to meet <strong>the</strong><br />
costs <strong>of</strong> this work. While <strong>the</strong> capacity in African countries has grown, despite attrition through <strong>the</strong> “brain drain” <strong>of</strong> marketable<br />
graduates, <strong>the</strong> economies have not improved to <strong>the</strong> extent where <strong>the</strong> countries can be independent <strong>of</strong> donor participation. A series<br />
<strong>of</strong> donor-driven, short-term projects, <strong>of</strong>ten delivered in stop-start cycles, have led to situations where sustainable programmes<br />
cannot be implemented, and long-term goals cannot be set nor achieved. The most pressing step is to provide financial security to<br />
research stations or conservation units to enable <strong>the</strong>m to develop and progress towards <strong>the</strong> achievement <strong>of</strong> long-term visions. This<br />
step requires independent funding that so reduces reliance on <strong>the</strong>ir own and donor governments that financial security is obtained.<br />
Offshore investments that earn interest provide vehicles for such independence and could take <strong>the</strong> form <strong>of</strong> endowment trusts,<br />
section 21 companies or similar secure endeavours. Such funding, in addition to that <strong>of</strong> <strong>the</strong> government, would provide <strong>the</strong> firm<br />
foundation on which to launch sustainable programmes and around which to organise o<strong>the</strong>r, separately or jointly funded projects.<br />
Jointly funded projects are envisaged as partnerships between <strong>the</strong> national facility and donors or research organisations. The<br />
mechanisms for establishing endowment funds will be discussed and several examples <strong>of</strong> successful schemes will be given. Most<br />
donors and aid organisations are not favourably disposed towards making contributions to such funds, preferring ra<strong>the</strong>r to maintain<br />
<strong>the</strong> stop-start cycle <strong>of</strong> donor managed projects. It is questioned whe<strong>the</strong>r this approach is in <strong>the</strong> long-term interest <strong>of</strong> <strong>the</strong> countries<br />
receiving <strong>the</strong> support or whe<strong>the</strong>r it might be both advantageous and effective to persuade donors to think afresh. These issues are<br />
debated. It is concluded that long-term research, monitoring programmes and <strong>the</strong> achievement <strong>of</strong> conservation objectives are so<br />
dependent upon programmes that are driven by <strong>the</strong> nationals <strong>of</strong> <strong>the</strong> countries concerned, and funded in a secure manner for as long<br />
as funding is required, that it is necessary for those donors that are opposed to <strong>the</strong> establishment <strong>of</strong> investment funds to re-examine<br />
<strong>the</strong> situation and reconsider <strong>the</strong>ir policies. Ideally, to understand and manage <strong>the</strong> <strong>lake</strong>s, <strong>the</strong> programmes should have perspectives<br />
that embody <strong>the</strong> phrase “in perpetuity”. And this phrase should be applied to both <strong>the</strong> nature <strong>of</strong> <strong>the</strong> work and <strong>the</strong> financial resources<br />
that support it.<br />
Introduction<br />
As long ago as 1962, Rachel Carson pointed out that: “It is our responsibility to safeguard our genetic heritage,<br />
which we received as a fit (in trust) from <strong>the</strong> past … to hold and to manage (in trust) for <strong>the</strong> next generation.”<br />
Conservation, <strong>the</strong>refore, is a matter <strong>of</strong> trust; previous generations entrusted us with a responsibility to future<br />
generations. Although this concept has been used in numerous publications, it has not really taken hold in practical<br />
sense, partly because our role as trustees is too loose. As trusts or endowments or similar do focus attention on<br />
responsibilities and duties, and as <strong>the</strong>y do provide one <strong>of</strong> <strong>the</strong> solutions to solving problems <strong>of</strong> achieving financial<br />
security for long-term programmes, we shall explore with you <strong>the</strong> value <strong>of</strong> trusts.<br />
Although we shall refer to trusts and endowments in this paper, we do so in <strong>the</strong> knowledge that <strong>the</strong>y are not <strong>the</strong> only<br />
way to go, but also in <strong>the</strong> knowledge that <strong>the</strong>re is a history <strong>of</strong> success and a legal foundation for <strong>the</strong>ir use. Indeed,<br />
<strong>the</strong> legal basis for trusts originated in Roman times and have since evolved to be a potentially powerful tool in<br />
environmental <strong>management</strong>.<br />
We shall be dealing with trust in two forms:<br />
Our responsibilities or duties as trustees charged with caring for <strong>the</strong> environment (intergenerational moral trust), and<br />
The manner in which trustees can have <strong>the</strong> financial resources to meet <strong>the</strong>ir responsibilities (financial or endowment<br />
trust).<br />
Intergenerational trusts<br />
In <strong>the</strong> intergenerational “moral” trust it is <strong>the</strong> duty <strong>of</strong> <strong>the</strong> present generation to care for biodiversity and<br />
environmental processes so responsibly that <strong>the</strong>y do not compromise <strong>the</strong> capacity <strong>of</strong> <strong>the</strong> next generation to enjoy <strong>the</strong><br />
benefits <strong>of</strong> natural resources. This or similar statements appear regularly in communications regarding conservation<br />
<strong>of</strong> resources, but have little impact in terms <strong>of</strong> <strong>the</strong> way <strong>the</strong> general public live, except perhaps to tweak <strong>the</strong><br />
conscience <strong>of</strong> a few. Part <strong>of</strong> <strong>the</strong> reason for this is that <strong>the</strong>re is no formal trust relationship that individuals have with<br />
<strong>the</strong> environment, despite general laws or commitments in many countries that are purported to serve <strong>the</strong>se ends.
21<br />
Lake Malawi Fisheries Management Symposium - Proceedings<br />
However, <strong>the</strong> concepts and legal framework do come into play with regard to <strong>the</strong> use <strong>of</strong> resources that are governed<br />
by governments or o<strong>the</strong>r authoritative bodies. The essence <strong>of</strong> <strong>the</strong> intergenerational trust is that <strong>the</strong> present generation<br />
should harvest <strong>the</strong> resource so that <strong>the</strong> capital or principal is not compromised to <strong>the</strong> point where <strong>the</strong> next generation<br />
would be compromised. For example in a fishery, <strong>the</strong> <strong>of</strong>f-take or catch should not be so great that <strong>the</strong> remaining<br />
population will be unable to recover to meet <strong>the</strong> needs <strong>of</strong> <strong>the</strong> future generations. In general humans are in<br />
competition with each o<strong>the</strong>r to acquire a greater proportion <strong>of</strong> <strong>the</strong> environment for <strong>the</strong>mselves, paying little regard to<br />
<strong>the</strong> needs <strong>of</strong> o<strong>the</strong>rs. If altruism between individuals is not a feature <strong>of</strong> <strong>the</strong> present generation, it is unlikely that<br />
individuals <strong>of</strong> this generation are likely to meet moral responsibilities to <strong>the</strong> next generation. Therefore, until<br />
educational programmes and <strong>the</strong> poverty issues <strong>of</strong> current generations are such that individuals can afford to be<br />
altruistic, formal bodies have to assume responsibility for maintaining <strong>the</strong> environmental capital in trust for <strong>the</strong> next<br />
generation. At present this responsibility resides with central government in much <strong>of</strong> Africa, but <strong>the</strong>re is a growing<br />
movement towards decentralisation, in which departments and organisations and even communities are taking<br />
responsibility for managing <strong>the</strong> resources. Each <strong>of</strong> <strong>the</strong>se <strong>the</strong>refore has <strong>the</strong> moral responsibility <strong>of</strong> caring for <strong>the</strong><br />
resources <strong>of</strong> this generation with <strong>the</strong> eye on providing for <strong>the</strong> next generation. In Africa, many <strong>of</strong> <strong>the</strong> organisations<br />
or institutes are unable to fulfil <strong>the</strong>ir obligations, as <strong>the</strong>y do not have <strong>the</strong> financial resources or human capacity to<br />
do so. One solution is for endowment trusts to be developed that do have finances so that institutions have longterm,<br />
sustainable support. These can include village trusts where communities are charged with <strong>the</strong> responsibility <strong>of</strong><br />
managing resources with an intergenerational perspective in mind.<br />
The legal structures and a wealth <strong>of</strong> experience exists to provide trusts that have <strong>the</strong> responsibility to provide for<br />
future generations. Interestingly, <strong>the</strong> legal structures also exist in which subsequent generations can sue previous<br />
generations for stealing <strong>the</strong>ir heritage and resources if later generations are <strong>of</strong> <strong>the</strong> opinion that <strong>the</strong> resources were<br />
inadequately cared for and that <strong>the</strong>y are suffering as a consequence. This underscores <strong>the</strong> need to guard <strong>the</strong> capital<br />
carefully.<br />
Trusts, endowments and similar<br />
The problem<br />
As indicated in an outline <strong>of</strong> <strong>the</strong> <strong>the</strong>me <strong>of</strong> this meeting, poverty in Africa has led to donor driven research and<br />
conservation initiatives that are subject to stop-start cycles <strong>of</strong> sporadic funding and are consequently short-term in<br />
nature. It impedes <strong>the</strong> career paths <strong>of</strong> individuals and promotes <strong>the</strong> brain drain from countries that should retain<br />
trained capacity. This has led to situations where sustainable programmes cannot be implemented, and long-term<br />
goals cannot be set nor achieved.<br />
Needs to solve problems<br />
The most pressing step is to provide financial security to research stations or conservation units and to communities<br />
to enable <strong>the</strong>m to develop and progress towards <strong>the</strong> achievement <strong>of</strong> long-term visions. This step requires<br />
independent funding that so reduces reliance on <strong>the</strong>ir own and donor governments that financial security is obtained.<br />
Endowment trusts, or similar secure endeavours <strong>of</strong>fer possible solutions. Such funding, in addition to that <strong>of</strong><br />
governments, could provide <strong>the</strong> firm foundation on which to launch sustainable programmes and around which to<br />
organise o<strong>the</strong>r, separately or jointly funded projects. Jointly funded projects are envisaged as partnerships between<br />
<strong>the</strong> national facility and donors or research organisations or communities.<br />
Trust funds <strong>of</strong>fer one solution<br />
The Trust Fund mechanism <strong>of</strong>fers one solution. Trust funds can guarantee a degree <strong>of</strong> permanent income, and have<br />
<strong>the</strong> potential to contribute significantly to <strong>the</strong> country’s development through supporting institutional development<br />
and community initiatives, as well as assisting in <strong>the</strong> planning and development <strong>of</strong> income generating activities such<br />
as eco-tourism.<br />
What is a Trust Fund?<br />
As outlined by Barry Spergel (WWF, 1993), a “Trust Fund” is a fairly loose and general term to indicate a sum <strong>of</strong><br />
money that is legally stricted to being used for a specified purpose, separate from o<strong>the</strong>r funds such as a<br />
government’s general budget, and is managed by a board <strong>of</strong> trustees, which holds legal title to <strong>the</strong> funds. The legal<br />
form that a trust may take varies. Most <strong>of</strong> <strong>the</strong> trust funds that WWF has worked on have been “endowments”,<br />
meaning that only <strong>the</strong> interest income is spent each year and not <strong>the</strong> principal, which remains invested. However,<br />
<strong>the</strong>re are o<strong>the</strong>r forms that a trust fund may take: <strong>the</strong> entire principal may be used over a fixed number <strong>of</strong> years, or it<br />
may be set up as a “revolving fund”, so that resources come into <strong>the</strong> trust as existing funds are spent .
ENDOWMENT TRUST<br />
INTEREST<br />
CAPITAL<br />
OR<br />
PRINCIPAL<br />
CAPITAL<br />
OR<br />
PRINCIPAL<br />
May be used by present generation<br />
(biodiversity or financial)<br />
To be conserved/harvested to generate useable<br />
<strong>of</strong>f-take/interest for future generations.<br />
In perpetuity if well managed by<br />
(board <strong>of</strong>) trustees. This is sustainable<br />
DIMINISHING TRUST<br />
A grant invested in which interest plus<br />
capital or principal are used by trustees for<br />
as long as <strong>the</strong> diminishing resource lasts.<br />
This is not sustainable<br />
LIMITED LIFE EXPECTANCY<br />
22<br />
Lake Malawi Fisheries Management Symposium - Proceedings<br />
An endowment trust can have <strong>the</strong> specific goals <strong>of</strong> serving <strong>the</strong> developmental, research, conservation, educational<br />
needs <strong>of</strong> a particular institution, in which case it is ra<strong>the</strong>r like a long-term project. This is an Institutional Trust.<br />
Alternatively it may provide <strong>the</strong> financial basis for a foundation that supports a variety <strong>of</strong> environmental projects <strong>of</strong><br />
o<strong>the</strong>r organisations, acting ra<strong>the</strong>r like a donor . For <strong>the</strong> parks and research stations around <strong>the</strong> <strong>lake</strong>, <strong>the</strong> institutional<br />
endowment trust is favoured, but a foundational approach may also be desirable to ‘encourage communities’<br />
participation and provide <strong>the</strong>m with a sense <strong>of</strong> “ownership” <strong>of</strong> <strong>the</strong> responsibility to conservation. Thus, in certain<br />
circumstances we would encourage a mixture <strong>of</strong> both <strong>the</strong> institutional and foundational approach.<br />
Use <strong>of</strong> trust funds for environmental programmes is not entirely new<br />
National level trust funds for environmental or conservation purposes are an innovative financing mechanism being<br />
used by more than thirty countries. Also important are international transborder Trust initiatives (e.g. Transfrontier<br />
Natural Resource Management Areas, Trans Frontier Conservation Areas).<br />
According to a recent report commissioned by <strong>the</strong> UNDP/GEF, between 1990 and 1995 over US$50 million has<br />
been committed to environmental trust funds. A number <strong>of</strong> donors, including USAID consider an endowed<br />
foundation as potentially a better way to provide development assistance, WWF has been instrumental in <strong>the</strong><br />
development <strong>of</strong> conservation trust funds in more than 10 countries world-wide, and in part <strong>of</strong> an international forum<br />
to promote such initiatives in a wider range <strong>of</strong> countries.<br />
Environmental Trusts are used mainly to cover recurrent costs <strong>of</strong> parks and protected areas and research institutions<br />
to support <strong>the</strong> overall goal <strong>of</strong> conserving/managing biological diversity, to reduce air and water pollution, to<br />
streng<strong>the</strong>n local environmental institutions, to promote sustainable development, to promote education, community<br />
participation and public awareness, to promote projects that address problems <strong>of</strong> poverty alleviation. The emphasis<br />
has been on supporting integration <strong>of</strong> conservation and human development needs.<br />
Most such funds are independent <strong>of</strong> government in terms <strong>of</strong> <strong>the</strong>ir <strong>management</strong> (though government may be <strong>the</strong> main<br />
source <strong>of</strong> funds), and most include on <strong>the</strong>ir governing board, <strong>of</strong>ten in a major way, representatives <strong>of</strong> nongovernmental<br />
organisations (NGOs) as well as government representatives.<br />
Goals are to provide in <strong>the</strong> long-term, preferably in perpetuity intergenerational, secure financial capital that<br />
provides sufficient interest to enable <strong>the</strong> conservation <strong>of</strong> environmental capital to be achieved by nationals <strong>of</strong> <strong>the</strong><br />
country. There are numerous subsidiary goals, <strong>of</strong>ten specific to <strong>the</strong> circumstances <strong>of</strong> <strong>the</strong> area being conserved and<br />
<strong>the</strong> needs <strong>of</strong> <strong>the</strong> institution managing <strong>the</strong> trust.<br />
Advantages<br />
Environmental trust funds and foundations hold <strong>the</strong> potential to meet many needs <strong>of</strong> both donors and recipients.<br />
They are attractive in that <strong>the</strong>y provide stable financing for many activities that could not be met by national budgets<br />
or by short-term projects using donor funding. This long-term stability in funding provides a degree <strong>of</strong> insulation by
23<br />
Lake Malawi Fisheries Management Symposium - Proceedings<br />
ensuring a dependable flow <strong>of</strong> money not affected by fluctuations in international donor money or government<br />
allocations.<br />
When <strong>the</strong>y involve domestic <strong>management</strong> <strong>of</strong> assets, <strong>the</strong>se funds instil a sense <strong>of</strong> ownership and responsibility for<br />
environmental conservation, build local capacity for financial <strong>management</strong>, and reduce <strong>the</strong> dependence on outside<br />
experts and international organisations.<br />
By providing assurance <strong>of</strong> funds in perpetuity or over a long period <strong>of</strong> time, <strong>the</strong>y enable long-term planning. And<br />
<strong>the</strong>y give individuals building careers in such fields some assurance that jobs will be available. When tied to longterm<br />
environmental action plans, funds help donors identify priority areas for funding and avoid inadvertent<br />
duplication <strong>of</strong> efforts. By including a range <strong>of</strong> stakeholders in <strong>the</strong> governance and <strong>management</strong>, funds promote<br />
democracy, strong civil societies, accountability, and consensus building, and <strong>the</strong>y build national capacity for<br />
moving towards sustainable development.<br />
Importantly too, in an intergenerational sense, all trustees are forced to focus on long-term conservation goals, are<br />
driven by <strong>the</strong> need to achieve <strong>the</strong>se and by <strong>the</strong> fact that trustees are accountable for <strong>the</strong> success or failure <strong>of</strong> such<br />
programmes. In essence, trusts <strong>of</strong> this nature powerfully underscore this generation’s commitment to meeting <strong>the</strong><br />
needs <strong>of</strong> subsequent generations by imposing duties on trustees.<br />
There are several additional reasons too why local stakeholders can fur<strong>the</strong>r benefit from nationally managed<br />
endowment trusts.<br />
Disadvantages<br />
A concern <strong>of</strong> some donors, especially when setting up an endowment is <strong>the</strong> need to release a sizeable amount <strong>of</strong><br />
money at <strong>the</strong> start <strong>of</strong> a project ra<strong>the</strong>r <strong>the</strong>n disbursing over time. A series <strong>of</strong> smaller appropriations could be a<br />
solution. However, making a large grant at <strong>the</strong> beginning could be viewed positively by donors as a way <strong>of</strong> reducing<br />
administrative costs and assuring programme continuity. In some respects, making a series <strong>of</strong> appropriations defeats<br />
<strong>the</strong> purpose <strong>of</strong> <strong>the</strong> endowment as a large sum needs to be invested for at least a year to earn <strong>the</strong> interest that drives<br />
<strong>the</strong> programme.<br />
O<strong>the</strong>r disadvantages can arise if <strong>the</strong> government departments see <strong>the</strong> trusts as competition ra<strong>the</strong>r than support.<br />
Similarly, if <strong>the</strong> communities are not included <strong>the</strong>y may be opposed to <strong>the</strong> trust that could be seen as governmental<br />
not <strong>the</strong>irs. Trusts can be caught between <strong>the</strong> two: government perceives <strong>the</strong>m to be too independent: communities<br />
perceive <strong>the</strong>m to be too governmental. It is essential, <strong>the</strong>refore, to have adequate buy-in from all stakeholders.<br />
One <strong>of</strong> <strong>the</strong> biggest problems facing Africa is that many donors do not believe that certain countries at least have <strong>the</strong><br />
capacity to manage trusts. Ra<strong>the</strong>r than help develop that capacity and to learn from experience elsewhere, such<br />
donors simply close <strong>the</strong> door on trusts and continue to opt for short-term projects that <strong>the</strong>y dominate. There are<br />
lessons from elsewhere from which everyone can benefit.<br />
Experience from elsewhere<br />
If trusts <strong>of</strong>fer attractive alternatives to donor driven, stop-start project cycles for <strong>the</strong> African Great Lakes <strong>the</strong>n it<br />
would be prudent to examine experience from elsewhere and be guided by <strong>the</strong> lessons o<strong>the</strong>rs learned. Several case<br />
histories indicate that all are different from one ano<strong>the</strong>r, some have had problems in gaining momentum and<br />
acceptance, but all seem to be on successful trajectories and as far as can be ascertained from <strong>the</strong> sample available,<br />
none has failed.<br />
Belize’s Protected Areas Conservation Trust (PACT) uses an innovative method <strong>of</strong> raising funds for <strong>the</strong><br />
conservation and <strong>management</strong> <strong>of</strong> protected areas: a conservation fee charged to all foreign tourists as <strong>the</strong>y leave <strong>the</strong><br />
country. This type <strong>of</strong> free can serve as a model for o<strong>the</strong>r countries, because it has been successful in generating<br />
revenue even at a time <strong>of</strong> sever budgetary constraints and declining international aid. Since tourism is now <strong>the</strong><br />
world’s largest industry, charging tourists even a modest conservation fee has <strong>the</strong> potential to generate large sums<br />
for <strong>management</strong> <strong>of</strong> protected areas.<br />
In addition to innovation, an equally noteworthy feature <strong>of</strong> PACT is that money generated by <strong>the</strong> conservation fee,<br />
which is essentially a tax, goes to an independent legal entity outside <strong>of</strong> Government (i.e. <strong>the</strong> TRUST). PACT is
24<br />
Lake Malawi Fisheries Management Symposium - Proceedings<br />
managed by a Board <strong>of</strong> Directors (TRUSTEES) with an equal number <strong>of</strong> members from Government and from nongovernmental<br />
organisations. This represents a new kind <strong>of</strong> partnership between Government and civil society.<br />
Ecuador is regarded as one <strong>of</strong> <strong>the</strong> richest reserves <strong>of</strong> biodiversity on <strong>the</strong> planet, and is internationally known for<br />
being host to some <strong>of</strong> <strong>the</strong> world’s most precious ecosystems, located in its tropical, Andean, and coastal regions, and<br />
<strong>the</strong> Galapagos natural park and marine reserve. There are currently no active specialised facilities to finance <strong>the</strong><br />
tremendous need for environmental <strong>management</strong> in <strong>the</strong> country. A national environmental fund, still idle, has<br />
recently been established. The creation <strong>of</strong> this fund, <strong>the</strong> Fondo Ambiental Nacional (FAN), presents an interesting<br />
case study for two reasons.<br />
One is <strong>the</strong> participatory nature <strong>of</strong> <strong>the</strong> fund’s conception process, intimately linked to innovative ideas for<br />
environmental financing. The second is those novel sources <strong>of</strong> financing <strong>the</strong>mselves. The FAN is <strong>the</strong> result <strong>of</strong><br />
initiative and work by key private and public-sector agents to grasp a historical opportunity for mobilisation <strong>of</strong><br />
significant amounts <strong>of</strong> domestic resources toward environmental <strong>management</strong>.<br />
Given Ecuador’s unique political and economic conditions in <strong>the</strong> period from 1994 to mid-1996, including<br />
economic adjustment, armed conflict with Peru, political scandals, and presidential and congressional elections, <strong>the</strong><br />
future <strong>of</strong> <strong>the</strong> fund is still uncertain, but its bases have been strongly established. This case study describes <strong>the</strong> fund’s<br />
various stages <strong>of</strong> creation, and <strong>the</strong> hurdles faced by its initiators, with <strong>the</strong> intention <strong>of</strong> placing <strong>the</strong> FAN’s experience<br />
in a real context.<br />
The idea <strong>of</strong> mobilising funds for <strong>the</strong> environment from <strong>the</strong> proceeds <strong>of</strong> State de-investment and privatisation<br />
occurred to FAN’s proponents as something almost obvious. Similarly, <strong>the</strong> idea <strong>of</strong> mobilising for <strong>the</strong> environment<br />
royalties and o<strong>the</strong>r proceeds from <strong>the</strong> exploitation <strong>of</strong> non-renewable natural resources (oil) – particularly when <strong>the</strong><br />
exploitation takes place within fragile ecosystems – also seemed ra<strong>the</strong>r obvious to a broad community <strong>of</strong> concerned<br />
individuals in academia, NGOs, <strong>the</strong> productive sector, and Government. Implementing those “obvious” ideas,<br />
putting <strong>the</strong>m into practice, is a different story. The critical mass <strong>of</strong> individuals who propelled FAN into being is<br />
aware <strong>of</strong> <strong>the</strong> resistance and difficulties that <strong>the</strong> idea will still need to overcome. However, <strong>the</strong>y felt confident that <strong>the</strong><br />
ample endorsement secured by <strong>the</strong> participatory process <strong>of</strong> creation will render both FAN and its proposed funding<br />
scheme viable for implementation under any in-coming Government.<br />
Jamaica has two National Environmental Funds. The Environmental Foundation <strong>of</strong> Jamaica (EFJ) was founded in<br />
1993. This fund began under <strong>the</strong> U.S. Government’s Enterprise for <strong>the</strong> Americans Initiative. The fund is supported<br />
exclusively by payments from <strong>the</strong> Jamaican Government, representing interest on rescheduled and reduced bilateral<br />
debt owed by Jamaica to <strong>the</strong> United States. In addition to receiving direct payment from <strong>the</strong> Government <strong>of</strong> Jamaica<br />
(GoJ), <strong>the</strong> fund is able to take advantage <strong>of</strong> <strong>the</strong> high interest rate regime in Jamaica to earn substantial interest on its<br />
capital. The EFJ’s resources, resulting from payments on reduced PL-480 and USAID debt, as well as investment<br />
earnings, are used for grants to NGOs for projects in environment and child welfare.<br />
The Jamaica National Parks Trust Fund (JNPT) was legally registered in January 1991 and capitalised with <strong>the</strong><br />
proceeds <strong>of</strong> Jamaica’s first (and <strong>the</strong> Caribbean’s second) debt-for-nature swap, on Earth Day 1992. The fund is<br />
managed primarily as an endowment and makes grants from investment income, its principal remaining untouched.<br />
The Government’s Green Paper on National Parks for Jamaica indicates that <strong>the</strong> JNPT should be <strong>the</strong> major vehicle<br />
for channelling eligible funds (<strong>of</strong> public <strong>of</strong> private origin) to <strong>the</strong> part system. To this end, <strong>the</strong> JNPT allows for<br />
donations to be tied to specific projects, parks, or geographical areas. The Government <strong>of</strong> Jamaica is expected to<br />
make annual contributions to <strong>the</strong> Fund. The Government will also help to develop proposals to bilateral and<br />
multilateral funding sources.<br />
Both funds were established through <strong>the</strong> close co-operation <strong>of</strong> <strong>the</strong> Governments <strong>of</strong> Jamaica and <strong>the</strong> United States<br />
and <strong>the</strong> Jamaica Conservation and Development Trust (JCDT), <strong>the</strong> island’s leading conservation NGO. This case<br />
study focuses on <strong>the</strong> National Parks Trust Fund, although occasionally making comparisons with <strong>the</strong> EFJ.<br />
In 1992, <strong>the</strong> Government <strong>of</strong> Peru passed legislation creating <strong>the</strong> National Trust Fund for Protected Areas<br />
(FONANPE) to assure long-term funding for <strong>the</strong> country’s protected areas. At <strong>the</strong> same time, <strong>the</strong> Government<br />
created PROFONANPE as a private, non-pr<strong>of</strong>it organization to administer <strong>the</strong> fund. Because <strong>of</strong> <strong>the</strong> timing <strong>of</strong> its<br />
creation, <strong>the</strong> new national environmental fund faced a complex panorama in terms <strong>of</strong> its potential to capture largescale<br />
national resources.<br />
On <strong>the</strong> one hand, <strong>the</strong> possibility <strong>of</strong> direct Government disbursements into FONANPE was and continues to be<br />
almost non-existent. Since <strong>the</strong> election <strong>of</strong> President Alberto Fujimori in 1990, <strong>the</strong> Government has followed a policy
25<br />
Lake Malawi Fisheries Management Symposium - Proceedings<br />
<strong>of</strong> strict fiscal austerity and has cut spending in almost every branch <strong>of</strong> Government. Today <strong>the</strong> policy is being<br />
reaffirmed in a soon-to-be signed IMF Letter <strong>of</strong> Intent in which <strong>the</strong> Government <strong>of</strong> Peru (GOP) commits to cut<br />
spending in order to increase its primary fiscal surplus, increase domestic saving, and fend <strong>of</strong>f a potential balance <strong>of</strong><br />
payments crisis. The Government has also committed to increased tax collection, but this additional income will go<br />
to covering <strong>the</strong> lean state budget and servicing <strong>the</strong> $26 billion foreign debt.<br />
As for non-governmental sources <strong>of</strong> national funding, Peruvians have no tradition <strong>of</strong> charitable giving to<br />
environmental or o<strong>the</strong>r non-pr<strong>of</strong>it organisations and, despite increased economic stability, most Peruvians still<br />
endure great economic hardship and have little cash to spare for donations.<br />
But alongside this grim scenario, <strong>the</strong>re is a bright spot in terms <strong>of</strong> national resource mobilisation. Since 1990, <strong>the</strong><br />
GOP has been engaged in an all-out effort to “reinsert” Peru into <strong>the</strong> international financial community. A key<br />
component <strong>of</strong> this effort has been <strong>the</strong> negotiation <strong>of</strong> Peru’s foreign debt, heavily in arrears since <strong>the</strong> early 1980’s,<br />
with multilateral, bilateral, and commercial lenders. The Government’s determination to restore Peru’s<br />
creditworthiness through <strong>the</strong>se negotiations has provided one <strong>of</strong> <strong>the</strong> most important sources <strong>of</strong> funds to FONANPE,<br />
which has received more than $10 million in debt donations to date.<br />
Negotiating debt swaps, while not PROFONANPE’s only line <strong>of</strong> effort is and will continue to be <strong>the</strong> organisation’s<br />
primary focus and best hope for reaching its goal <strong>of</strong> a trust fund totalling $80 million. O<strong>the</strong>r countries that face tight<br />
budgets and extensive debt negotiations may find in Peru’s experience a useful example <strong>of</strong> how a bleak economic<br />
panorama may in fact hide a more hopeful scenario for <strong>the</strong> creation <strong>of</strong> a national environmental fund.<br />
Developing trusts<br />
Given that <strong>the</strong> advantages <strong>of</strong> environmental endowment trust out-weigh <strong>the</strong> disadvantages, and, given that <strong>the</strong>re are<br />
precedents <strong>of</strong> successful environmental trusts from which one can learn, <strong>the</strong>re seem to be compelling reasons to<br />
develop trust for <strong>lake</strong> conservation and research, particularly in developing countries. One <strong>of</strong> <strong>the</strong> first steps is to<br />
persuade donors and governments, which are reluctant to follow this route, <strong>of</strong> its great benefits. To do this, it is<br />
essential to be very well prepared in terms <strong>of</strong> defining visions, goals, modus operandi and, in every respect,<br />
complete thoroughly that <strong>the</strong> homework has been done. Also buy-in by stakeholders, particularly <strong>the</strong> village<br />
communities and sceptical governments, is an essential prerequisite to success.<br />
How to fund environmental endowments<br />
Funding can be derived from a variety <strong>of</strong> different sources. In many cases in which trusts have been formed <strong>the</strong><br />
national government has shown strong commitment by funding directly or indirectly part or all <strong>of</strong> <strong>the</strong> trust.<br />
Probably, it is worthwhile in all cases for national governments to make a partial contribution as this is an indication<br />
<strong>of</strong> sincerity and commitment that would provide additional leverage for fundraisers to use when encouraging o<strong>the</strong>rs<br />
to support <strong>the</strong> initiative. Even <strong>the</strong> poorest <strong>of</strong> governments can make contributions as <strong>the</strong>y certainly represent an<br />
investment in <strong>the</strong> future <strong>of</strong> its people and <strong>the</strong> sustainability <strong>of</strong> <strong>the</strong> resources on which <strong>the</strong>y depend.<br />
There is a broad spectrum <strong>of</strong> donors that might fund trusts (major bilateral and multilateral donor agencies), USAID<br />
and <strong>the</strong> World Bank/Global Environmental Facility, philanthropic donors such as <strong>the</strong> MacArthur Foundation and<br />
international conservation organisations including The Nature Conservancy and WWF. Though some <strong>of</strong> those that<br />
did so in <strong>the</strong> past are no longer keen on this route, favouring instead a return to stop-start projects over which <strong>the</strong>y<br />
can exercise greater donor control.<br />
How to manage environmental endowments: Investing capital<br />
The financial rationale <strong>of</strong> an endowment is to protect <strong>the</strong> value <strong>of</strong> assets while generating income from investments.<br />
Private donor organizations and bilateral and multilateral aid agencies tend to focus on short-term projects whose<br />
impact <strong>of</strong>ten dwindles after <strong>the</strong> money runs out. For <strong>the</strong>se agencies, endowments <strong>of</strong>fer a way to sustain commitment<br />
to long-term goals insulated from budgetary and political fluctuations. Operating an endowment, however,<br />
necessitates acquiring and managing assets in a way that maintains <strong>the</strong>ir value and produces income. Ideally, both<br />
<strong>the</strong> capital and <strong>the</strong> interest should grow over time if well managed, so that inflationary trends and growing needs are<br />
met. Many trusts have grown substantially since <strong>the</strong>ir initiation .<br />
Management in perpetuity<br />
Regardless <strong>of</strong> conditions in local financial markets, building a financial <strong>management</strong> capacity will pay <strong>of</strong>f when <strong>the</strong><br />
financial markets develop to <strong>the</strong> point that an endowment can be managed in perpetuity. An endowment’s financial
26<br />
Lake Malawi Fisheries Management Symposium - Proceedings<br />
managers should anticipate <strong>the</strong> various constraints on <strong>the</strong> handling <strong>of</strong> an endowment’s assets, including gift<br />
restriction imposed by donors, reporting requirements <strong>of</strong> national governments and donors, and <strong>the</strong> need for<br />
transparency and for avoiding conflicts <strong>of</strong> interest in asset <strong>management</strong> decisions. An endowment that proves able to<br />
deal with <strong>the</strong>se constraints will be attractive to potential donors.<br />
The issue <strong>of</strong> investing within <strong>the</strong> nation in which <strong>the</strong> trust is to be launched, or <strong>of</strong>fshore, or in both, has to be<br />
assessed for each case. Returns on interest are <strong>of</strong>ten better in African nations, but <strong>the</strong> devaluation <strong>of</strong> currencies and<br />
<strong>the</strong> potential for political instability, even in what are apparently strong economies (vide recent events in Zimbabwe)<br />
has to be carefully analysed by <strong>the</strong> investment house employed to manage <strong>the</strong> finances so that <strong>the</strong> trustees are wisely<br />
informed.<br />
It is an advantage for <strong>the</strong> fund to be independent and outside <strong>of</strong> government. This increases donor confidence that<br />
<strong>the</strong> funds will not be used inefficiently or redirected to o<strong>the</strong>r government concerns. It also makes <strong>the</strong> fund<br />
independent <strong>of</strong> political changes as when an election has taken place. Some donors, for example USAID, can only<br />
give funds to independent non-governmental organisations, or to funds where <strong>the</strong> <strong>management</strong> board has a majority<br />
<strong>of</strong> NGO representatives. However, <strong>the</strong> Trust needs to have a good relationship with government and be in line with<br />
government policy in order to solicit <strong>the</strong> political good will to make <strong>the</strong> fund functional. It is also clear that <strong>the</strong> fund<br />
cannot replace <strong>the</strong> government’s normal budgetary commitment to environmental conservation activities, but must<br />
support <strong>the</strong>m.<br />
Long-term investments for nature, research, education<br />
Endowments are defined as assets that are invested to earn income to be used in support <strong>of</strong> a defined purpose.<br />
Funds can take several different forms (a trust set up by special legislation, a foundation, a common law trust, a nonpr<strong>of</strong>it<br />
corporation) but nearly all take <strong>the</strong> form <strong>of</strong> an endowment.<br />
Answerability and accountability<br />
Appointment <strong>of</strong> <strong>the</strong> board <strong>of</strong> trustees should follow <strong>the</strong> legally established procedures and should benefit from <strong>the</strong><br />
wealth <strong>of</strong> experience that exists already (see case histories). Importantly, <strong>the</strong> trustees have to be fully accountable for<br />
<strong>the</strong>ir performance in both <strong>the</strong> achievement <strong>of</strong> environmental goals and in financial <strong>management</strong> <strong>of</strong> <strong>the</strong> capital and<br />
interest, preferably showing an annual growth <strong>of</strong> both.<br />
Conclusion<br />
Long-term research and monitoring programmes and <strong>the</strong> achievement <strong>of</strong> conservation objectives are so dependent<br />
upon programmes that are driven by <strong>the</strong> nationals <strong>of</strong> <strong>the</strong> countries concerned, and funded in a secure manner for as<br />
long as funding is required, that <strong>the</strong> establishment <strong>of</strong> trust funds or similar forms <strong>of</strong> sustainable secure funding<br />
presents an attractive option. Perhaps is it is necessary for those donors that are opposed to <strong>the</strong> establishment <strong>of</strong><br />
investment funds to re-examine <strong>the</strong> situation and reconsider <strong>the</strong>ir policies. Ideally, to understand and manage <strong>the</strong><br />
<strong>lake</strong>s, <strong>the</strong> programmes should have perspectives that embody <strong>the</strong> phrase “in perpetuity”. And this phrase should be<br />
applied to both <strong>the</strong> nature <strong>of</strong> <strong>the</strong> work and <strong>the</strong> financial resources that support it. Whe<strong>the</strong>r in <strong>the</strong> context <strong>of</strong> <strong>lake</strong><br />
Malawi/Niassa/Nyasa each station or park, such as a Kyela, Metangula, <strong>the</strong> <strong>lake</strong> Malawi National Park, Senga Bay<br />
and o<strong>the</strong>rs should have independent trusts, each managed by <strong>the</strong>ir own trustees, or whe<strong>the</strong>r <strong>the</strong>re should be a multinational<br />
Trust for <strong>the</strong> entire <strong>lake</strong> are issues that need not be debated in this paper. What is clear is that trusts<br />
managed in perpetuity do <strong>of</strong>fer a compelling alternative to <strong>the</strong> stop-start cycles <strong>of</strong> donor projects.
27<br />
Lake Malawi Fisheries Management Symposium - Proceedings<br />
The need to maintain Maximum Biodiversity in Lake Nyasa<br />
Benjamin Peter Ngatunga<br />
Senior Research Officer (Ichthyology), Tanzania Fisheries Research Institute, Kyela Centre, P.O. Box 98, Kyela, Mbeya, Tanzania,<br />
East Africa<br />
Abstract<br />
Lake Nyasa fish fauna comprises more than 1 000 species, mainly cichlids, and is thus unique among freshwater <strong>lake</strong>s. But tension<br />
exists between motives ei<strong>the</strong>r to conserve or exploit <strong>the</strong> fish resource. In Lake Nyasa small scale fishery exploits <strong>the</strong> inshore<br />
resources, principal fish taken are mainly cichlids which comprise up to 90% <strong>of</strong> <strong>the</strong> total landings. Cichlids have low fecundity and<br />
are k-selected <strong>the</strong>refore have low rates <strong>of</strong> recovery in face <strong>of</strong> stock collapse. Thus what is happening today in Lake Nyasa has great<br />
consequences for tomorrow. Such a scenario provides <strong>the</strong> motive and desire for conservation <strong>of</strong> <strong>the</strong> Lake Nyasa fish fauna. We<br />
care about biodiversity and we wish to maintain or conserve it because we see value in biodiversity. The term, biodiversity has<br />
become so much <strong>of</strong> a buzzword dominated global environmental debate, that it is <strong>of</strong>ten difficult to focus on <strong>the</strong> critical issues that<br />
face society. The six categories <strong>of</strong> biodiversity values relevant to Lake Nyasa are presented and discussed and <strong>the</strong> need to maintain<br />
biodiversity in Lake Nyasa is deliberated using a poverty degradation feed-back cycle.<br />
Introduction<br />
Biodiversity – a new gimmick?<br />
According to Ghilarov (1996), <strong>the</strong> term biodiversity appeared in ecological literature in <strong>the</strong> middle <strong>of</strong> <strong>the</strong> 1980s and<br />
in less than 10 years it became so popular that for <strong>the</strong> external observer <strong>the</strong> whole situation looks like a successful<br />
breakthrough in some new field <strong>of</strong> science. Today biodiversity has become an everyday word not just for ecologists<br />
but for politicians, <strong>the</strong> media and <strong>the</strong> general public too. It seems, however, that <strong>the</strong> real reason for this burst in<br />
interest in biodiversity (or ra<strong>the</strong>r this rapid increase in <strong>the</strong> usage <strong>of</strong> <strong>the</strong> term ‘biodiversity’) lies outside <strong>the</strong> sphere <strong>of</strong><br />
science. To many pr<strong>of</strong>essional ecologists, perhaps it sounds <strong>of</strong>fensive, yet I shall dare to claim that <strong>the</strong> term<br />
‘biodiversity’ became so popular, primarily because it’s usage facilitates greater access to research funding. So we<br />
might consider ‘biodiversity’ as a useful fad that helps many ecologists to survive doing science.<br />
The term ‘Biodiversity’ has become so much part <strong>of</strong> <strong>the</strong> buzzword dominated global environmental debate that it is<br />
<strong>of</strong>ten difficult to focus on critical issues that face <strong>the</strong> society. Biodiversity can be defined in its narrow sense as:<br />
“The variety and variability among living organisms and <strong>the</strong> ecological complexities in which <strong>the</strong>y occur” (FAO,<br />
1994). Biodiversity can be measured in terms <strong>of</strong> ecosystems, species and genes (Whittaker, 1972, Harper &<br />
Hawksworth, 1994).<br />
But a more relevant view <strong>of</strong> biodiversity, especially to African societies comes from its larger resource oriented<br />
sense. “In Africa biodiversity is a matter <strong>of</strong> survival, it is critical for life at grass root level. It is a total variety <strong>of</strong><br />
living matter on which society depends. It provides ecosystem resilience, to allow both people and natural<br />
communities to cope with periodic environmental stress” (FAO, 1994).<br />
Why care about biodiversity?<br />
We care about biodiversity and we wish to maintain or conserve biodiversity because we see value in biodiversity.<br />
This brings us back to <strong>the</strong> starting point <strong>of</strong> value to which part <strong>of</strong> <strong>the</strong> society. The debate on biodiversity revolves<br />
around two opposite poles <strong>of</strong> <strong>the</strong> society.<br />
At one end is <strong>the</strong> developed western world interested in global values and <strong>the</strong> options values <strong>of</strong> biodiversity. It was<br />
<strong>the</strong> western world, which devised <strong>the</strong> funding mechanism such as <strong>the</strong> GEF to address <strong>the</strong>se global values. At <strong>the</strong><br />
o<strong>the</strong>r end are <strong>the</strong> local communities in <strong>the</strong> developing world, who depend on <strong>the</strong> biological resources <strong>of</strong> natural and<br />
man modified ecosystems for <strong>the</strong>ir livelihood.<br />
We thus have polarisation <strong>of</strong> North versus South, Central government versus local government and western<br />
protectionism versus local utilisation.<br />
Conservation International stresses that <strong>the</strong>re are mainly five categories <strong>of</strong> biodiversity values.<br />
1. Major ecosystem functions (catchment, soil formation, nutrient cycling).<br />
2. International export values (timber, beeswax, tourist spectacles, and medicines).<br />
3. Regional and local market values (food, poles and medicine).<br />
4. Household use values (food, cultural, construction, and fuel).
5. Global intangible values (carbon sequestration, science).<br />
28<br />
Lake Malawi Fisheries Management Symposium - Proceedings<br />
These values are, however, not all mutually exclusive, for example ‘mbuna’ stocks maintained for international<br />
export value will also provide global benefit. For developing countries like Malawi, Mozambique and Tanzania,<br />
emphasis for conserving <strong>the</strong> stocks <strong>of</strong> ‘mbuna’ is based on <strong>the</strong>ir utilitarian export values, not <strong>the</strong>ir long lists <strong>of</strong> Latin<br />
names <strong>of</strong> endemic species.<br />
Lake Nyasa, a biodiversity ‘hot-spot’<br />
The global water reserves comprise <strong>of</strong> 97.5% salt water and 2.5% fresh water. Surprisingly, only a tiny percentage<br />
(less than 0.01%) <strong>of</strong> <strong>the</strong> global total water reserve is comprised <strong>of</strong> rivers and <strong>lake</strong>s. The remainder is ground water,<br />
glacier and permanent snow and soil moisture, permafrost and swamp water. Yet this tiny percentage holds a<br />
tremendous diversity <strong>of</strong> life. Of <strong>the</strong> 20 000+ species <strong>of</strong> fishes described so far by scientists (and many more remain<br />
to be described), 40% live in freshwater. In o<strong>the</strong>r words, almost half <strong>of</strong> <strong>the</strong> fish biodiversity is contained within a<br />
very vulnerable 0.01% <strong>of</strong> <strong>the</strong> earth’s water.<br />
GLOBAL WATER<br />
RESERVES<br />
FRESH<br />
(2.5%)<br />
SALT<br />
(97.5%)<br />
2.5%<br />
0.9%<br />
Soil moisture,<br />
permafrost, swamp<br />
water<br />
69%<br />
Glaciers and<br />
permanent snow<br />
cover<br />
0.3%<br />
Rivers and <strong>lake</strong>s<br />
(
29<br />
Lake Malawi Fisheries Management Symposium - Proceedings<br />
The importance <strong>of</strong> Lake Malawi cichlids as a source <strong>of</strong> protein cannot be over emphasised; <strong>the</strong>y are a crucial<br />
resource both as natural populations and subjects <strong>of</strong> fish aquaculture. Most <strong>of</strong> Lake Malawi cichlids are small and<br />
<strong>the</strong>refore can easily be dried in <strong>the</strong> sun for upcountry markets.<br />
Under <strong>the</strong> circumstances <strong>of</strong> hunger and poverty, fish conservation is both exhilarating and controversial.<br />
Exhilarating because those fishers bear <strong>the</strong> collective wisdom, wit and will to control <strong>the</strong>ir resource <strong>the</strong>y depend on<br />
for survival. Controversial because <strong>the</strong> need to survive drives <strong>the</strong>m to fish to <strong>the</strong> last fish! Thus what is happening<br />
today in Lake Nyasa has great consequences for tomorrow.<br />
Threats to Lake Nyasa fish biodiversity<br />
Habitat variability within <strong>the</strong> <strong>lake</strong> must have played an important role in sustaining <strong>the</strong> diversity <strong>of</strong> fish and<br />
<strong>the</strong>refore, preserving <strong>the</strong> fish biodiversity <strong>of</strong> Lake Nyasa is not possible without habitat protection <strong>of</strong> those areas <strong>of</strong><br />
<strong>the</strong> <strong>lake</strong> where most species depends on. The most important and also most delicate habitats are <strong>the</strong> littoral zones <strong>of</strong><br />
<strong>the</strong> rocky habitats, <strong>the</strong> shallow water zones associated with river mouths – swamps, submerged macrophyte beds,<br />
lagoons are important for spawning and nursery grounds <strong>of</strong> many fish species.<br />
The main threat to <strong>the</strong> existence <strong>of</strong> high diversity <strong>of</strong> life in Lake Nyasa comes from human activities on <strong>the</strong> adjacent<br />
land. The root causes <strong>of</strong> <strong>the</strong> <strong>lake</strong>’s environmental damage that can result in biodiversity loss are <strong>of</strong> two categories:<br />
1. Land based causes/sources and activities affecting <strong>the</strong> quality and uses <strong>of</strong> <strong>the</strong> <strong>lake</strong> (poverty, poorly<br />
managed social and economic development programs and unsustainable consumption patterns).<br />
2. Of <strong>the</strong> land based activities I consider <strong>the</strong> effect <strong>of</strong> fishing, both direct and indirect to be <strong>of</strong> highest priority<br />
comparable to that <strong>of</strong> <strong>the</strong> most serious land-based threats.<br />
ENVIRONMENTAL<br />
DEGRADATION<br />
LONG-TERM EFFECTS<br />
Loss <strong>of</strong>:<br />
Biodiversity<br />
Habitat<br />
Ecological<br />
Functioning<br />
Agricultural Land<br />
Fishing Potential<br />
Tourism Potential<br />
Opportunity:<br />
REDUCED<br />
CAPACITY<br />
FACILITATE DIVERSIFICATION:<br />
e.g.: TOURISM<br />
Poverty / Degradation Feedback Cycle<br />
INCREASED<br />
POVERTY<br />
SHORT-TERM EFFECTS<br />
Deforestation<br />
Overgrazing<br />
Overhunting<br />
Overfishing<br />
Pollution<br />
Erosion<br />
River Siltation<br />
Increased Flooding<br />
FEEDBACK<br />
ROOT CAUSES<br />
Alternative Cycle<br />
REDUCE<br />
INCREASE DIVERSIFICATION<br />
& RESOURCE RETURNS<br />
Poverty<br />
&<br />
hardship<br />
POVERTY<br />
BEGIN<br />
HERE<br />
Not enough<br />
Capacity<br />
Reduced<br />
sustainability<br />
Increased impacts on<br />
environment<br />
Opportunity:<br />
DEVELOP CAPACITY<br />
IMPROVED RESOURCE<br />
MANAGEMENT<br />
Strategy<br />
Indeed <strong>the</strong> need to maintain maximum biodiversity is surely greatest as <strong>the</strong> rates <strong>of</strong> environmental change increases.<br />
The strategy to maintain maximum biodiversity <strong>of</strong> this fish resource that <strong>the</strong> local population mainly depends on
30<br />
Lake Malawi Fisheries Management Symposium - Proceedings<br />
should be advocated toge<strong>the</strong>r with <strong>the</strong> strategy to alleviate poverty and hunger. An example in this case is <strong>the</strong><br />
provision <strong>of</strong> an alternative source <strong>of</strong> cheap protein.<br />
References<br />
FAO, 1994. Biodiversity. News letter, East African Biodiversity Project: UNO/RAF/006/GEF.<br />
Stiassny, M.L.J., 1993. What is a Cichlid? Tropical Fish Hobbyist (TFH, November, 1993), 141-146.<br />
Ghilarov, A. 1996. What does ‘biodiversity’ mean – Scientific problem or convenient myth? Trends in Ecology and Evolution<br />
Vol. II, 304-306.<br />
Harper, J.L & Hawsworth, D.L. 1994. Biodiversity: measurement and estimation. Philos. Trans. R. Soc. London. Ser. B 345, 5-<br />
12.<br />
Marcel, A., Brechignac, F. & Thibault, P. 1994. Biodiversity in model ecosystems. Nature 371, 565.<br />
Ngatunga, B.P. 2000. A taxonomic revision <strong>of</strong> <strong>the</strong> shallow-water species <strong>of</strong> <strong>the</strong> genera Lethrinops, Tramitichromis and<br />
Taeniolethrinops (Teleostei, Cichlidae) from Lake Malawi/Nyasa/Niassa (East Africa). PhD <strong>the</strong>sis, University <strong>of</strong><br />
Rhodes, South Africa, 293pg.<br />
Stiassny, M.L.J. 1993. What is a Cichlid? Tropical Fish Hobbyist (TFH, November, 1993), 141-146.<br />
Whittaker, R.H. 1972. Evolution and measurement <strong>of</strong> species diversity. Taxon 21, 213-251.
31<br />
Lake Malawi Fisheries Management Symposium - Proceedings<br />
Fisheries Management, Biodiversity Conservation and Genetic Stock Structure<br />
George F. Turner<br />
Department <strong>of</strong> Biological Sciences, University <strong>of</strong> Hull, HU6 7RX, United Kingdom, E-mail: g.f.turner@biosci.hull.ac.uk<br />
Abstract<br />
Given <strong>the</strong> immense difficulties <strong>of</strong> assessing and managing <strong>fisheries</strong> on Lake Malawi/ Nyasa, it seems likely that <strong>the</strong> present<br />
approach <strong>of</strong> using intuition and rules <strong>of</strong> thumb to derive <strong>management</strong> approaches is likely to continue. It is important that <strong>the</strong> rules <strong>of</strong><br />
thumb employed are as accurate as possible. At present, almost nothing is known <strong>of</strong> <strong>the</strong> migration patterns and movements <strong>of</strong> <strong>the</strong><br />
major fish stocks in <strong>the</strong> <strong>lake</strong>. Both <strong>the</strong> collection <strong>of</strong> data and <strong>the</strong> setting <strong>of</strong> effort limits are presently based on ra<strong>the</strong>r arbitrary fishing<br />
areas. Local <strong>fisheries</strong> <strong>management</strong> will be largely irrelevant if carried out on wide-ranging stocks that are exploited elsewhere.<br />
Analysis <strong>of</strong> population structure provides an effective tool for <strong>the</strong> assessment <strong>of</strong> fish movement patterns. Tagging is likely to be<br />
impractical for most <strong>lake</strong> fish stocks. Species identification is important, but on its own, provides limited geographical resolution <strong>of</strong><br />
stock structure. Molecular approaches using microsatellite DNA are powerful, but are critically dependent on accurate species<br />
identification. Examples are given <strong>of</strong> studies implemented on Lake Malawi. A critical advantage <strong>of</strong> this kind <strong>of</strong> study is that <strong>the</strong><br />
information it provides need not be updated by regular monitoring, but can be used to inform <strong>management</strong> decisions indefinitely.<br />
Introduction<br />
Assessment and <strong>management</strong> <strong>of</strong> fishery resources on Lake Malawi/Nyasa is not easy, and <strong>the</strong>re have been few<br />
success stories to date. Difficulties arise from (among o<strong>the</strong>r things) <strong>the</strong> sheer size <strong>of</strong> <strong>the</strong> <strong>lake</strong>, <strong>the</strong> huge number <strong>of</strong><br />
species exploited, <strong>the</strong> lack <strong>of</strong> knowledge <strong>of</strong> fish biology and identification, <strong>the</strong> diversity and decentralisation <strong>of</strong><br />
fishing activities, <strong>the</strong> lack <strong>of</strong> knowledge about <strong>the</strong> factors influencing fisher behaviour and lack <strong>of</strong> funding. Little is<br />
presently known about <strong>the</strong> movements <strong>of</strong> fish within <strong>the</strong> <strong>lake</strong>, which makes it difficult to define <strong>the</strong> geographical<br />
extent <strong>of</strong> stocks for <strong>the</strong> purposes <strong>of</strong> assessment and <strong>management</strong>. This raises major practical problems in <strong>the</strong> light <strong>of</strong><br />
decentralisation <strong>of</strong> responsibility for <strong>management</strong> <strong>of</strong> fish stocks, with political authority devolving to district levels<br />
and with increasing emphasis on local co-<strong>management</strong> through beach village committees. A fur<strong>the</strong>r problem lies in<br />
<strong>the</strong> assessment <strong>of</strong> gear and fleet interactions. This is likely to become a more pressing problem, as <strong>the</strong>re are pressure<br />
to grant more trawl licenses at <strong>the</strong> same time as artisanal fishers are increasing <strong>the</strong> use <strong>of</strong> chilimira nets to target<br />
<strong>of</strong>fshore benthic species such as chambo (‘kauni’ fishery).<br />
A ‘stock’ is what <strong>fisheries</strong> managers try to manage. A group <strong>of</strong> organisms can be treated as a stock if possible<br />
differences within <strong>the</strong> group and interchanges with o<strong>the</strong>r groups can ignored without making <strong>the</strong> conclusions<br />
reached invalid (Sparre et al. 1989). Why should fishery managers care about stock definition? If a stock is<br />
overexploited, managers will wish to decrease fishing effort on that stock. This would be <strong>of</strong> limited use if ano<strong>the</strong>r<br />
fishing fleet continues to increase its rate <strong>of</strong> exploitation <strong>of</strong> <strong>the</strong> same stock. Is <strong>the</strong>re any point in <strong>the</strong> allocation <strong>of</strong><br />
property rights to a local community to enable participatory <strong>management</strong> <strong>of</strong> a stock in one area, if rampant<br />
overexploitation <strong>of</strong> <strong>the</strong> same stock is going on somewhere else, or going on in <strong>the</strong> same area using a different<br />
method? Equally, if a stock is underexploited, this may be because it is difficult to exploit economically in part <strong>of</strong> its<br />
range. If such a stock shows a high degree <strong>of</strong> migration over its whole range, it might be worth permitting extremely<br />
heavy exploitation in <strong>the</strong> areas where it can be economically exploited, in <strong>the</strong> knowledge that local depletion <strong>of</strong> <strong>the</strong><br />
population can be compensated by immigration from <strong>the</strong> rest <strong>of</strong> <strong>the</strong> range. Knowledge <strong>of</strong> stock limits and gear<br />
interactions is also critical in stock assessment, particular using catch and effort data. For example, <strong>the</strong>re is no point<br />
in carrying out separate assessments for Salima and Nkhotakota districts if all <strong>the</strong> main fish species move freely<br />
between <strong>the</strong> two areas. If this were <strong>the</strong> case, <strong>the</strong> catch and effort data could be pooled and this might not only allow<br />
more accurate assessment, but might even allow for a reduction in data ga<strong>the</strong>ring effort, allowing valuable resources<br />
to be reallocated elsewhere. Thus, definition <strong>of</strong> <strong>the</strong> major fish stocks in Lake Malawi is an essential stage in <strong>the</strong><br />
development <strong>of</strong> a rationally-based sustainable <strong>fisheries</strong> <strong>management</strong> programme.<br />
Studies <strong>of</strong> population structure can also provide critical information for conservation biologists. If a local population<br />
in a reserve area exchanges few migrants with neighbouring populations, its protection is more important for two<br />
reasons. Firstly, it is likely that if <strong>the</strong> local population is reduced or goes extinct, immigration from elsewhere will<br />
do little to help <strong>the</strong> population recover. Fur<strong>the</strong>r, it is likely that if migration rates are extremely low, <strong>the</strong> local<br />
population may contain unique genetic variants that will not exist in o<strong>the</strong>r populations. These variants may include<br />
genotypes specifically adapted to <strong>the</strong> local habitat, and if so, immigrants from elsewhere may never become as<br />
successfully established as <strong>the</strong> former residents. This can also be critical if restocking is attempted using source<br />
populations from o<strong>the</strong>r localities.
32<br />
Lake Malawi Fisheries Management Symposium - Proceedings<br />
The present paper is aimed at summarising <strong>the</strong> uses <strong>of</strong> molecular methods in defining exploited stocks for <strong>fisheries</strong><br />
<strong>management</strong>. I will also briefly discuss <strong>the</strong> uses <strong>of</strong> molecular methods in conservation biology, and discuss o<strong>the</strong>r<br />
methods which might be used to study population structure.<br />
The basics <strong>of</strong> molecular ecology<br />
DNA<br />
Living organisms are constructed from recipes coded in <strong>the</strong>ir genes, made from DNA molecules, passed on from<br />
<strong>the</strong>ir parents. DNA is made up <strong>of</strong> various subsidiary molecules linked toge<strong>the</strong>r, but <strong>the</strong> ‘message’ is spelled out in<br />
<strong>the</strong> sequence <strong>of</strong> 4 different kinds <strong>of</strong> molecules called ‘bases’, labelled A,C,T and G. An important feature <strong>of</strong> DNA is<br />
that it can make copies <strong>of</strong> itself, with <strong>the</strong> help <strong>of</strong> <strong>the</strong> enzyme DNA polymerase, which is itself made from <strong>the</strong> DNA.<br />
The messages in DNA are translated into RNA, which is in turn translated into proteins, which build bodies and<br />
transmit information around <strong>the</strong> body. In <strong>the</strong> course <strong>of</strong> sequencing <strong>the</strong> human genome (<strong>the</strong> genome is <strong>the</strong> total<br />
complement <strong>of</strong> DNA in an organism), it has been discovered that more than 95% <strong>of</strong> our DNA is not in fact used to<br />
make proteins, and indeed is not used for anything at all (International Human Genome Sequencing Consortium<br />
2001). Much <strong>of</strong> this ‘junk’ DNA is mainly made up <strong>of</strong> bits that are good at making copies <strong>of</strong> <strong>the</strong>mselves and getting<br />
<strong>the</strong>m stuck into o<strong>the</strong>r parts <strong>of</strong> <strong>the</strong> genome. As long as <strong>the</strong>y do not interfere with <strong>the</strong> workings <strong>of</strong> <strong>the</strong> useful bits <strong>of</strong><br />
DNA, <strong>the</strong>y tend to hang around as a sort <strong>of</strong> harmless parasite. This is not really as surprising at it sounds, because<br />
organisms are not ‘designed’ to be efficient, <strong>the</strong>y have merely proved better than <strong>the</strong>ir rivals at surviving and<br />
reproducing over billions <strong>of</strong> years <strong>of</strong> evolution by natural selection.<br />
The discipline <strong>of</strong> Molecular Ecology, <strong>of</strong> which Molecular Fish Stock Discrimination is a subdiscipline, is largely<br />
based on <strong>the</strong> analysis <strong>of</strong> this ‘junk’ DNA. Most commonly, molecular ecologists try to look at <strong>the</strong> same bit <strong>of</strong> DNA<br />
(a ‘locus’, plural ‘loci’, meaning ‘place’) in a number <strong>of</strong> different individuals. There will <strong>of</strong>ten be slight differences<br />
between individuals in <strong>the</strong> sequences <strong>of</strong> <strong>the</strong> DNA at <strong>the</strong> same locus- <strong>the</strong>se different forms are called ‘alleles’. And<br />
because each individual has two equivalent chromosomes each containing <strong>the</strong> same set <strong>of</strong> loci (ignoring exceptions<br />
like <strong>the</strong> sex chromosomes and mitochondrial DNA), <strong>the</strong>n each individual can have two different alleles (in which<br />
case it is said to be ‘heterozygous’) or two copies <strong>of</strong> <strong>the</strong> same allele (‘homozygous’). The trick is to find <strong>the</strong> same<br />
locus in each individual in <strong>the</strong> study. To do this, special ‘primers’ are used to latch on to unique sequences <strong>of</strong> DNA<br />
on ei<strong>the</strong>r side <strong>of</strong> <strong>the</strong> region <strong>of</strong> interest. From <strong>the</strong>se, chemical reactions (PCR or polymerase chain reactions) are<br />
carried out to make lots <strong>of</strong> copies <strong>of</strong> <strong>the</strong> bit <strong>of</strong> DNA that lies in between <strong>the</strong>se primers, until <strong>the</strong>re is enough material<br />
to analyse. The next step is <strong>of</strong>ten to work out <strong>the</strong> sequence <strong>of</strong> letters in <strong>the</strong> target locus, by smashing up <strong>the</strong> molecule<br />
into lots <strong>of</strong> little bits and <strong>the</strong>n adding a different fluorescent marker onto <strong>the</strong> end according to which ‘letter’ is <strong>the</strong><br />
last one. By working out <strong>the</strong> size <strong>of</strong> all <strong>the</strong> bits you can work out <strong>the</strong> whole DNA sequence. Alternatively, <strong>the</strong> target<br />
locus might consist <strong>of</strong> a very repetitive message (such as GTGTGTGTGTGT… and so on), in which case it is better<br />
just to see how long <strong>the</strong> message is. These procedures are increasingly carried out using automated DNA<br />
sequencers.<br />
Genetic divergence <strong>of</strong> populations<br />
If any groups <strong>of</strong> sexually reproducing organisms stop interbreeding with each o<strong>the</strong>r, <strong>the</strong>y will begin to diverge<br />
genetically. There are three possible causes for this: selection, mutation and genetic drift (Avise 1994). In recently<br />
separated populations, drift is likely to be <strong>the</strong> major force, particularly when populations are small. Genetic drift<br />
results from <strong>the</strong> random process <strong>of</strong> chance differences in survival and reproductive success <strong>of</strong> individuals with<br />
different genotypes. This can happen even if <strong>the</strong>se genotypes are equally good at surviving and breeding. Molecular<br />
estimates <strong>of</strong> migration rate assume that differences between populations are not due to natural selection. This seems<br />
a robust assumption for most populations which have become separated fairly recently (hundreds or thousands <strong>of</strong><br />
years), but to be more sure <strong>of</strong> this, it is best to examine several different molecular markers which are selectively<br />
neutral and unlinked. By selectively neutral, it is meant that <strong>the</strong> locus is not involved in making anything useful, like<br />
a protein molecule. But, <strong>the</strong>re is always <strong>the</strong> risk that <strong>the</strong> locus is next door (‘linked’) to something that is useful and<br />
has recently been subjected to strong natural selection. The risk <strong>of</strong> this can be minimised by looking at several<br />
different loci for each individual, which carries <strong>the</strong> extra advantage <strong>of</strong> allowing you to get statistically independent<br />
estimates <strong>of</strong> migration that can be averaged over to make <strong>the</strong> results more accurate. Thus, estimates <strong>of</strong> migration and<br />
population structure are based on statistical estimates <strong>of</strong> allele frequencies in different loci in many individuals from<br />
different populations.
33<br />
Lake Malawi Fisheries Management Symposium - Proceedings<br />
Microsatellites<br />
Many different molecular marker types exist, such as allozymes, mitochondrial DNA, RAPDs, AFLPs,<br />
minisatellites etc. Most have been used in studies <strong>of</strong> population structure. The advantages and disadvantages <strong>of</strong><br />
different kinds <strong>of</strong> molecular markers are discussed in many excellent review articles and books (e.g. Avise 1994;<br />
Jarne & Lagoda 1996; Carvalho & Hauser 1998; Mueller & Wolfenbarger 1999; Sunnucks 2000). For studies <strong>of</strong><br />
population structure <strong>the</strong> general consensus is that <strong>the</strong> method <strong>of</strong> choice is analysis <strong>of</strong> microsatellite DNA.<br />
Microsatellites are also sometimes called SSRs or Simple Sequence Repeats (e.g. Markert et al 1999; 2001) or,<br />
along with o<strong>the</strong>r larger repeats such as ‘minisatellites’ <strong>the</strong>y are classed as VNTRs or Variable Number Tandem<br />
Repeats (Majerus et al. 1996). Microsatellites include <strong>the</strong> monotonous 2-letter repeats already mentioned (GTGTGT<br />
etc), although sometimes a motif can be as long as 6 letters (ACTGATACTGAT etc), and o<strong>the</strong>rs can be a bit more<br />
complex with interruptions <strong>of</strong> <strong>the</strong> repeat by non-repetitive sequences (ATATATCGATATATAT etc). It seems that<br />
<strong>the</strong> short repeat motifs are difficult to copy accurately, and extra repeats are frequently inserted. Thus,<br />
microsatellites tend to evolve rapidly (and generally grow in length). This rapid mutation rate, coupled with <strong>the</strong>ir<br />
selective neutrality means that microsatellites tend to be incredibly variable and thus can provide good material for<br />
statistical comparisons between populations.<br />
Statistical assessment <strong>of</strong> population structure<br />
Most estimates <strong>of</strong> population structure employ variants <strong>of</strong> <strong>the</strong> F-statistics first developed in <strong>the</strong> 1950s (Wright 1951,<br />
see, for example Avise, 1994, for an explanation). For population structure, <strong>the</strong> key measure is FST, which is <strong>the</strong><br />
variance in allele frequencies among populations, standardised as a proportion <strong>of</strong> <strong>the</strong> maximum possible for <strong>the</strong><br />
given range <strong>of</strong> allele frequencies. Basically, it is a measure <strong>of</strong> <strong>the</strong> differences between populations in comparison to<br />
<strong>the</strong> overall amount <strong>of</strong> differences between individuals, including <strong>the</strong> differences between individuals within <strong>the</strong><br />
same population. FST can range from 0 to 1. A high FST indicates a high degree <strong>of</strong> genetic differentiation between<br />
populations, and thus a low level <strong>of</strong> migration. Taking several assumptions into account, it is possible to estimate <strong>the</strong><br />
number <strong>of</strong> successfully breeding migrants moving between populations per generation (Nm). This figure can also be<br />
estimated from <strong>the</strong> number <strong>of</strong> unique alleles in each population, adjusted for sample size (<strong>the</strong> ‘Private Alleles<br />
Method’: Slatkin 1985). Ra<strong>the</strong>r surprisingly at first sight, <strong>the</strong>se methods give an estimate <strong>of</strong> <strong>the</strong> number <strong>of</strong> individual<br />
migrants, not <strong>the</strong> proportion migrating. There are a number <strong>of</strong> s<strong>of</strong>tware packages to calculate FST, Nm and o<strong>the</strong>r<br />
parameters from raw data on microsatellite allele frequencies: most are readily available over <strong>the</strong> internet. A good<br />
starting point is <strong>the</strong> molecular ecology web site at <strong>the</strong> University <strong>of</strong> Hull.<br />
http://www.hull.ac.uk/molecol/nonmol.htm#s<strong>of</strong>tware<br />
Molecular stock structure analysis and species identification<br />
Genetic analysis <strong>of</strong> stock structure is incredibly sensitive to correct species identification. This is rarely mentioned in<br />
<strong>the</strong> literature on <strong>the</strong> subject, but <strong>the</strong>n in most <strong>of</strong> <strong>the</strong> world apart from Lake Malawi and Lake Victoria, it is quite easy<br />
to identify species <strong>of</strong> fish, so <strong>the</strong> question rarely arises. Confusion <strong>of</strong> closely-related species is just as dangerous as<br />
confusion <strong>of</strong> distantly-related ones. No studies <strong>of</strong> population structure using molecular methods are <strong>of</strong> any value if<br />
<strong>the</strong>re is a risk that species might have been confused. The most likely result is that different proportions <strong>of</strong> different<br />
species will have been collected in different populations. The consequence <strong>of</strong> this would be to inflate <strong>the</strong> estimates<br />
<strong>of</strong> genetic differentiation between populations, and to give <strong>the</strong> impression that migrations levels were lower than<br />
<strong>the</strong>y actually are. Recent studies have indicated that Lake Malawi cichlid fish cannot be told to <strong>the</strong> level <strong>of</strong> species<br />
on <strong>the</strong> basis <strong>of</strong> unique genetic markers (Parker & Kornfield 1997; Turner et al. 2000). So, <strong>the</strong>re is no point in hoping<br />
that genetic studies in <strong>the</strong> laboratory can sort out mistaken species identification during sample collection. Properly<br />
labelled voucher specimens are thus a vital for any molecular ecology study where <strong>the</strong>re might be <strong>the</strong> slightest doubt<br />
over species identification.<br />
Protocols for sample collection for microsatellite studies<br />
Table 1 gives a suggested protocol for sample collection for microsatellite studies <strong>of</strong> Lake Malawi fishes. It is<br />
assumed that <strong>the</strong>re may be some uncertainty over species identification. In practice, it would be advisable to consult<br />
with leading experts in species identification prior to undertaking <strong>the</strong> study. This might be helpful in deciding<br />
whe<strong>the</strong>r to focus <strong>the</strong> collection <strong>of</strong> ripe males, or whe<strong>the</strong>r any stage <strong>of</strong> fish would do.<br />
Making labels<br />
A major cause <strong>of</strong> problems can lie in labelling <strong>of</strong> whole fish specimens. Probably <strong>the</strong> best method is make labels<br />
from Dymo tape (www.dymo.com). From <strong>the</strong> manufacturers, a basic manual dymo printer costs $6.80 with spare<br />
12-foot long tapes costing $6.29 for 3. A single tape is enough to label dozens or even hundreds <strong>of</strong> individual fish.<br />
Dymo tapes and printers are sometimes available in Malawi. The more sophisticated electronic dymo printers are
34<br />
Lake Malawi Fisheries Management Symposium - Proceedings<br />
inferior for this purpose, as <strong>the</strong> labels are not so strong. A greatly inferior substitute is to use relatively rigid card,<br />
such as sold for file card boxes, and write labels using alcohol-resistant ink, such as is used in <strong>the</strong> Rotring<br />
Rapidograph ink drawing pen, http://www.rotring.de/www.rotring.com/index.html. The next problem is to<br />
attach <strong>the</strong> label to <strong>the</strong> specimen. The best method is to use a purpose-made fish-tagging gun loaded with T-bar tags.<br />
Information on fish tagging materials can be found at http://www.hafro.is/catag/. The best known supplier is<br />
Floytag, at http://www.halcyon.com/floytag/. The labels can be individually numbered or coded, but this is a lot<br />
more expensive, and it is probably better to make Dymo labels. Fish tagging guns will have a sharp hollow spike,<br />
designed to be pushed though fish muscle. To attach a Dymo label to a tag, <strong>the</strong> spike is simply pushed through <strong>the</strong><br />
label before being pushed through <strong>the</strong> fish. A click on <strong>the</strong> trigger, and a strong plastic tag is inserted through <strong>the</strong><br />
fish, held in place by <strong>the</strong> T-bar, which springs open on <strong>the</strong> underside. Tags are probably best inserted through <strong>the</strong><br />
caudal peduncle above <strong>the</strong> lateral line (in case counts <strong>of</strong> lateral line scales are a useful taxonomic feature). In smaller<br />
fish, tags might have to be inserted through <strong>the</strong> main body <strong>of</strong> <strong>the</strong> fish above <strong>the</strong> lateral lines, to avoid breaking <strong>the</strong><br />
caudal peduncle. If a tagging gun is not available, string or fine mon<strong>of</strong>ilament twine may be used to tie labels firmly<br />
round <strong>the</strong> caudal peduncle, or it can be threaded through <strong>the</strong> operculum and out <strong>the</strong> mouth with both ends tied<br />
toge<strong>the</strong>r. Nei<strong>the</strong>r solution is ideal, as string tends to break and mon<strong>of</strong>ilament knots <strong>of</strong>ten come undone. Ei<strong>the</strong>r can<br />
get caught among <strong>the</strong> fins and opercula <strong>of</strong> o<strong>the</strong>r fish. This can cause string to break, or <strong>the</strong> label to get sheared <strong>of</strong>f,<br />
as fish are put in and out <strong>of</strong> <strong>the</strong> storage barrel. If <strong>the</strong> label has to tied on, it is wise to insert a duplicate label into <strong>the</strong><br />
fish’s mouth and perhaps even ano<strong>the</strong>r under one <strong>of</strong> <strong>the</strong> opercula. The alternative to trying to attach labels is to place<br />
each fish into a separate plastic bag or jar, which also contains a label. Use <strong>of</strong> jars is usually impractical in <strong>the</strong> field.<br />
If plastic bags are used <strong>the</strong>y should be well filled with preservative, for o<strong>the</strong>rwise <strong>the</strong> fish may not get enough<br />
contact with <strong>the</strong> formalin for proper preservation.<br />
Table 1. Suggested protocol for sample collection for microsatellite DNA.<br />
Step Procedure Notes<br />
1. Select populations for study. The sample area at each site<br />
should be as small as<br />
possible, given <strong>the</strong> need to<br />
collect sufficient samples<br />
2. Aim to collect a minimum <strong>of</strong> 50 live or recently killed individuals from<br />
each site.<br />
3. Cut <strong>of</strong>f a piece <strong>of</strong> a fin and wash <strong>of</strong>f any excess scales and blood (which<br />
might be from different fish). Place in a vial <strong>of</strong> 90-100% ethanol. Wash<br />
scissors before taking next sample.<br />
4. Label <strong>the</strong> vial, using alcohol-resistant ink. Best <strong>of</strong> all, as well as labelling<br />
<strong>the</strong> vial, put <strong>the</strong>m into vial boxes where <strong>the</strong> rows and column are<br />
already labelled on <strong>the</strong> box.<br />
5. Take a colour photograph <strong>of</strong> each specimen. Before taking <strong>the</strong> picture,<br />
write <strong>the</strong> vial label in large bold characters on a piece <strong>of</strong> paper and<br />
place this next to <strong>the</strong> fish, so that it appears in <strong>the</strong> photograph.<br />
6. Label <strong>the</strong> fish specimen using <strong>the</strong> same label code as for <strong>the</strong> vial and<br />
photo and place in 10% formalin.<br />
7. Send duplicate copies <strong>of</strong> all <strong>of</strong> <strong>the</strong> photographs to one or more leading<br />
experts in identification <strong>of</strong> <strong>the</strong> fish species concerned, explaining <strong>the</strong><br />
purpose for which <strong>the</strong> specimens are required.<br />
8. If required, send whole fish specimens to <strong>the</strong> identification expert, or<br />
wait until (s)he has <strong>the</strong> opportunity to visit your lab to examine <strong>the</strong><br />
material.<br />
9. Remove from <strong>the</strong> analysis any sample for which <strong>the</strong>re is <strong>the</strong> slightest<br />
doubt over <strong>the</strong> species identification.<br />
100 is better. If samples from<br />
most sites are over 50, <strong>the</strong><br />
occasional population sample<br />
<strong>of</strong> 30-40 could be OK.<br />
If <strong>the</strong> whole specimen is to be<br />
preserved, it is best to remove<br />
<strong>the</strong> right pectoral fin, allowing<br />
taxonomic measurements to<br />
be taken from <strong>the</strong> left side.<br />
NB if you rely solely on row<br />
and column designations on<br />
<strong>the</strong> box, and don’t label <strong>the</strong><br />
vials, it is a major disaster if<br />
you drop <strong>the</strong> box while <strong>the</strong> lid<br />
is open!<br />
A coarse black marker pen is<br />
ideal for labelling, and stiff<br />
card, as used for file card<br />
boxes.<br />
Various methods are<br />
discussed below.<br />
It would be useful to include<br />
information on <strong>the</strong> collecting<br />
locality for each photograph<br />
when seeking advice.
35<br />
Lake Malawi Fisheries Management Symposium - Proceedings<br />
Preserving Fish<br />
A frequent problem with collections <strong>of</strong> fish specimens made for ID purposes is that <strong>the</strong>y are <strong>of</strong>ten bent and twisted,<br />
and thus very difficult to identify. The main cause <strong>of</strong> this is packing fish in tightly while <strong>the</strong>y are still s<strong>of</strong>t and fresh.<br />
It is always best if <strong>the</strong> fish are placed into a barrel with enough room for <strong>the</strong>m to float freely in <strong>the</strong> liquid. Ideally,<br />
<strong>the</strong> fish’s fins should be open, ra<strong>the</strong>r than closed tight against <strong>the</strong> body. The best way to do this, after killing fish<br />
with an anaes<strong>the</strong>tic overdose, is to place <strong>the</strong>m on a sheet <strong>of</strong> expanded polystyrene (balsa wood would also do, or a<br />
metal tray filled with about 1cm <strong>of</strong> candle wax), open out <strong>the</strong> fins, and pin <strong>the</strong>m in place. Strong formalin is <strong>the</strong>n<br />
drizzled from a syringe over <strong>the</strong> fin bases to fix <strong>the</strong>m in place. Fish are best left like this for 10-15 minutes before<br />
placing <strong>the</strong>m in <strong>the</strong> formalin bucket. If <strong>the</strong> fish have asphyxiated (<strong>of</strong>ten <strong>the</strong> case on deck <strong>of</strong> a trawler), <strong>the</strong> mouth<br />
may be fully extended. This also makes identification difficult. When pinning <strong>the</strong> fins, it is best to also pin back <strong>the</strong><br />
mouth so that it is only slightly open. It is difficult to inspect <strong>the</strong> teeth, which can be an important character, if <strong>the</strong><br />
mouth is fully closed. With fish brought up quickly from deep water, it is useful to puncture <strong>the</strong> stomach and<br />
swimbladder and squeeze out excess air, to try to combat <strong>the</strong> bloating <strong>of</strong> <strong>the</strong> fish resulting from swimbladder<br />
expansion. A final problem is with decomposition. Large fish should have formalin injected into <strong>the</strong> gut cavity,<br />
using a large syringe. The quantity should not be so much that <strong>the</strong> fish becomes bloated, a normal-looking shape is<br />
<strong>the</strong> aim. Very big chambo or ncheni can also benefit from a few injections into <strong>the</strong> dorsal musculature, carefully<br />
inserting <strong>the</strong> needle under a scale, because if you drive it right through <strong>the</strong> scale, it will come <strong>of</strong>f as you remove <strong>the</strong><br />
needle. It is worth remembering that formalin is diluted by fish as well as by water. The aim is get a 10% formalin<br />
solution in contact with <strong>the</strong> fish tissues. If <strong>the</strong>re is more fish than water, <strong>the</strong>n concentration <strong>of</strong> a 10% solution will<br />
soon be less than 5%, and fish will start to rot. Ano<strong>the</strong>r problem with overpacking <strong>of</strong> fish is that parts <strong>of</strong> <strong>the</strong> bodies<br />
can end up sticking out <strong>of</strong> <strong>the</strong> liquid. These can quickly rot. Containers <strong>of</strong> preserved fish should be inspected<br />
regularly to maintain levels <strong>of</strong> liquid, which can drop through evaporation or spillage. Formalin is poisonous, and it<br />
is extremely unpleasant to inhale <strong>the</strong> fumes. Before any detailed examination <strong>of</strong> <strong>the</strong> specimens is carried out, <strong>the</strong><br />
formalin should be washed out under a running tap (left outdoors for a couple <strong>of</strong> days) and <strong>the</strong>n <strong>the</strong> specimens<br />
should be kept in 70% alcohol. But it is worth waiting until you have checked <strong>the</strong> quality <strong>of</strong> your photographs before<br />
you do this (see below).<br />
Photographing fish specimens<br />
I have <strong>of</strong>ten been surprised at <strong>the</strong> poor quality <strong>of</strong> photographs <strong>of</strong> fish I have been asked to identify. A common<br />
problem is that <strong>the</strong> fish is photographed from an oblique angle, usually because it is high up on a table at <strong>the</strong> time.<br />
There is no substitute for getting <strong>the</strong> specimen onto <strong>the</strong> floor! If <strong>the</strong> fish is very big, I <strong>of</strong>ten stand on top <strong>of</strong> a stool to<br />
get a good aerial view from far enough away. In Africa, <strong>the</strong> bright light <strong>of</strong>ten casts dramatic black shadows over <strong>the</strong><br />
fish. I prefer to photograph fish in <strong>the</strong> shade where possible. There is usually enough light that a flash is not needed.<br />
In <strong>the</strong> open, I usually manoeuvre my own body to cast a full shadow over <strong>the</strong> fish. An umbrella might come in<br />
handy for big specimens. Inevitably, <strong>the</strong>re is a risk that photographs will not come out or be over- or under-exposed.<br />
A digital camera allows you to view your photos immediately and see if <strong>the</strong>y are <strong>of</strong> acceptable standard. Generally,<br />
<strong>the</strong>y do not store many images, so it is useful to take backup disks, if it is not feasible to download <strong>the</strong>m directly into<br />
a computer. If a digital camera is not available, a fallback position in <strong>the</strong> event <strong>of</strong> your photos being useless, is to<br />
photograph <strong>the</strong> preserved fish. Some element <strong>of</strong> <strong>the</strong> live colour is usually still visible if <strong>the</strong> fish has been kept in<br />
formalin, in <strong>the</strong> dark. However, alcohol rapidly bleaches specimens, especially if <strong>the</strong>y are kept in sunlight. So, it is<br />
advisable to keep specimens in formalin until <strong>the</strong> quality <strong>of</strong> photographs has been determined. Live colours <strong>of</strong>ten<br />
fade quickly after death, so it is <strong>of</strong>ten useful to take a quick snap <strong>of</strong> <strong>the</strong> live fish first, and ano<strong>the</strong>r picture once <strong>the</strong><br />
fins have been pinned out in order to get a better impression <strong>of</strong> <strong>the</strong> shape and finnage.<br />
Case studies <strong>of</strong> stock structure analysis in Lake Malawi<br />
A potential problem with microsatellites is that new primers usually have to be developed for each species being<br />
studied. This can be a laborious and expensive process. For once, <strong>the</strong> fact that most <strong>of</strong> <strong>the</strong> cichlids are so closely<br />
related proves to be a plus ra<strong>the</strong>r than a minus, since it seems that most primers work across all <strong>the</strong> haplochromines.<br />
About half <strong>of</strong> <strong>the</strong> primers developed for tilapiine cichlids work on mbuna. Fortunately, Pr<strong>of</strong>. Kocher at <strong>the</strong><br />
University <strong>of</strong> New Hampshire, USA, has been engaged from several years in developing hundreds <strong>of</strong> sets <strong>of</strong><br />
microsatellite loci to map <strong>the</strong> genomes <strong>of</strong> Nile Tilapia for aquaculture research (e.g. Lee & Kocher 1996, Kocher et<br />
al. 1998, see also http://tilapia.unh.edu/Default.html) and mbuna for evolution research. Consequently, <strong>the</strong>re is no<br />
shortage <strong>of</strong> microsatellite primers available.
36<br />
Lake Malawi Fisheries Management Symposium - Proceedings<br />
Case Study I: Population structure in mbuna<br />
The first study to use microsatellites to investigate <strong>the</strong> population structure <strong>of</strong> Lake Malawi cichlids resulted from a<br />
research project on <strong>the</strong> evolution <strong>of</strong> mbuna, carried out by a consortium <strong>of</strong> researchers in British Universities, in<br />
collaboration with <strong>the</strong> University <strong>of</strong> Malawi. We wanted to test <strong>the</strong> hypo<strong>the</strong>sis, dating back to Fryer (1959), that<br />
<strong>the</strong>re is little migration between populations <strong>of</strong> mbuna separated by deep-water channels or sandy bays. An earlier<br />
study by McKaye et al. (1984) had looked at this question by comparing Pseudotropheus zebra from Nkhata Bay<br />
and Chilumba with Mumbo Islands and Domwe Islands in <strong>the</strong> sou<strong>the</strong>rn part <strong>of</strong> <strong>the</strong> <strong>lake</strong>. Although this study clearly<br />
showed differentiation between <strong>the</strong> nor<strong>the</strong>rn and sou<strong>the</strong>rn populations, it employed allozyme electrophoresis, a<br />
comparatively crude method which we thought unlikely to demonstrate population differentiation at <strong>the</strong> smaller<br />
spatial scales we were concerned with. We used 6 microsatellite loci to compare populations <strong>of</strong> 4 species:<br />
Pseudotropheus zebra, P. callainos, and two undescribed members <strong>of</strong> <strong>the</strong> P. tropheops complex (P. ‘tropheops<br />
olive’ and P. ‘tropheops mauve’). We looked at 4 populations from headlands around Nkhata Bay- each headland<br />
was separated from <strong>the</strong> next one by a sand/mud bay <strong>of</strong> 700-1,400 metres in width. Since female P. zebra are similar<br />
in colour to P. ‘gold zebra’ which is also found at Nkhata Bay, we only sampled males <strong>of</strong> this species, which are<br />
easily identified at this site. Our analysis yielded FST values <strong>of</strong> 0.007-0.016, very small, but statistically significant.<br />
The number <strong>of</strong> migrants between sites was estimated to range from 6-8 individuals per generation (van Oppen et al.<br />
1997). This showed that <strong>the</strong>re is very little movement <strong>of</strong> mbuna across sandy bays- even very small ones.<br />
Subsequent studies from Kocher’s lab (and collaborators) have broadly confirmed <strong>the</strong> pattern from mbuna <strong>of</strong> o<strong>the</strong>r<br />
genera from <strong>the</strong> sou<strong>the</strong>rn part <strong>of</strong> <strong>the</strong> <strong>lake</strong> (Arnegard et al. 1999; Danley et al. 2000; Markert et al. 1999).<br />
Case Study II: Population structure in pelagic cichlids<br />
The ODA/SADC Pelagic Fish Resources Project (Menz 1995) estimated Lake Malawi’s <strong>of</strong>fshore pelagic fish stock<br />
at 168,000 tonnes, <strong>of</strong> which around 88% is comprised <strong>of</strong> cichlids (Menz et al.1995). The maximum sustainable yield<br />
was estimated at around 30,000 tonnes per annum (Thompson 1995). With virtually no fishing presently undertaken<br />
<strong>of</strong>fshore, important tasks remaining were to estimate <strong>the</strong> extent to which pelagic stocks could be exploited in inshore<br />
areas, and to estimate <strong>the</strong> extent to which exploitation in a limited geographical area might run <strong>the</strong> risk <strong>of</strong><br />
exterminating local stocks. We addressed <strong>the</strong>se questions through molecular stock structure analysis, during <strong>the</strong><br />
DFID Ncheni Project (Turner et al. 2000). We used six microsatellite loci to screen 5 populations (479 individuals)<br />
<strong>of</strong> Diplotaxodon limnothrissa, a surface pelagic species also found inhabiting inshore waters, 3 populations (234<br />
individuals) <strong>of</strong> Diplotaxodon macrops, more benthic species found near <strong>the</strong> bottom on deep shelf areas and 3<br />
populations (234 individuals) <strong>of</strong> Diplotaxodon ‘<strong>of</strong>fshore’, a deep-water pelagic species. The status <strong>of</strong> <strong>the</strong> latter 2<br />
forms was <strong>the</strong>n uncertain, since <strong>the</strong>y are very difficult to distinguish in <strong>the</strong> field, and might have proved to be<br />
populations <strong>of</strong> <strong>the</strong> same species. This was later resolved when we discovered that ripe males <strong>of</strong> D. ‘<strong>of</strong>fshore’ had<br />
different breeding colours from D. macrops. We had initially intended to look at population structure in<br />
Rhamphochromis longiceps, but we later decided that our samples (which were not individually labelled) comprised<br />
a mixture <strong>of</strong> R. longiceps and R. ferox. Consequently, we did not analyse <strong>the</strong>se samples.<br />
No evidence <strong>of</strong> linkage disequilibrium was found between any <strong>of</strong> <strong>the</strong> six loci, confirming that <strong>the</strong>y can be<br />
considered as independent genetic markers. Levels <strong>of</strong> genetic variability were remarkably consistent among <strong>the</strong><br />
three. Multilocus estimates <strong>of</strong> genetic differences (FST) indicated that <strong>the</strong>re was no substantial genetic substructuring<br />
within <strong>the</strong> populations <strong>of</strong> any <strong>of</strong> <strong>the</strong> three Diplotaxodon species examined (Table 2).<br />
Table 2. FST (genetic differentiation) values, at 6 microsatellite loci and over all loci combined (P =<br />
probability <strong>of</strong> overall FST not > 0), among samples <strong>of</strong> three Diplotaxodon species.<br />
Locus Pzeb1 Pzeb2 Pzeb3 Pzeb4 Unh130 Unh154 Overall P<br />
Species<br />
D. limnothrissa 0.0007 0.0014 0.0018 0.0012
37<br />
Lake Malawi Fisheries Management Symposium - Proceedings<br />
distance’. In o<strong>the</strong>r words, although all <strong>the</strong> populations are probably exchanging lots <strong>of</strong> migrants, genes take a long<br />
time to exchange between populations at <strong>the</strong> far extremes <strong>of</strong> <strong>the</strong> range. These populations are clearly exchanging<br />
hundreds, if not thousands <strong>of</strong> migrants per generation. Samples from Cape Maclear and <strong>of</strong>f <strong>the</strong> Livingstone<br />
mountains were not genetically different, nor were samples from <strong>the</strong> SE Arm and Chilumba. Likewise, for D.<br />
macrops and D. ‘<strong>of</strong>fshore’, all <strong>of</strong> <strong>the</strong> different populations <strong>of</strong> <strong>the</strong> same species were so similar, <strong>the</strong> non-significant<br />
FST indicates that <strong>the</strong>y could be no more genetically differentiated than two samples taken from <strong>the</strong> same place. The<br />
D. macrops populations were from Salima and <strong>the</strong> SE Arm, while <strong>the</strong> D. ‘<strong>of</strong>fshore’ populations were sampled<br />
hundreds <strong>of</strong> kilometres apart, at Karonga and Nkhata Bay. Included in <strong>the</strong>se analyses were comparisons between<br />
inshore and <strong>of</strong>fshore samples from <strong>the</strong> same geographic region: at Chilumba and SE Arm/Cape Maclear for D.<br />
limnothrissa, in <strong>the</strong> SE Arm for D. macrops and <strong>of</strong>f Karonga for D. ‘<strong>of</strong>fshore’. In no case did we find significant<br />
genetic differentiation, showing that samples taken inshore are part <strong>of</strong> <strong>the</strong> same populations as found fur<strong>the</strong>r<br />
<strong>of</strong>fshore in <strong>the</strong> same region. The implications <strong>of</strong> this study for <strong>the</strong> evolution <strong>of</strong> <strong>the</strong>se fishes were presented by Shaw<br />
et al. (2000).<br />
The minimal population structure we found indicates that <strong>the</strong>se three species are not likely to need <strong>management</strong> as<br />
independent stocks in different parts <strong>of</strong> <strong>the</strong> <strong>lake</strong>. Artisanal or bottom trawl catches <strong>of</strong> <strong>the</strong>se species are very likely<br />
exploiting <strong>the</strong> same stocks that are found in <strong>the</strong> <strong>of</strong>fshore pelagic or deep-water zones. Indeed, Malawian, Tanzanian<br />
and Mozambican fishers may be exploiting <strong>the</strong> same stocks. We found clear differentiation between <strong>the</strong> stocks <strong>of</strong> D.<br />
macrops and D. ‘<strong>of</strong>fshore’, which is consistent with our view that <strong>the</strong>y are different species. Diplotaxodon macrops<br />
is caught in reasonable numbers by deep demersal trawls, and before <strong>the</strong>y were realised to be different species, it<br />
had been hoped that exploitation <strong>of</strong> this population might provide a ‘backdoor’ route to exploiting <strong>the</strong> deep-water<br />
pelagic stock <strong>of</strong> D. ‘<strong>of</strong>fshore’. The standing biomass <strong>of</strong> this stock was estimated at around 33,000 tonnes (Menz et<br />
al. 1995). Comprising 19% <strong>of</strong> <strong>the</strong> pelagic biomass, it might be expected to yield around 6,000 tonnes per annum,<br />
and it is scarcely exploited. New ways must be tried to get at this stock.<br />
Case Study III: Are colour forms <strong>of</strong> mbuna really species?<br />
An important application <strong>of</strong> molecular stock structure study lies in <strong>the</strong> definition <strong>of</strong> species- <strong>the</strong> most commonly<br />
used ‘unit <strong>of</strong> conservation’. Population structure analysis need not only be applied to populations from different<br />
locations, but can also be used to test whe<strong>the</strong>r two forms co-occurring at a single locality are interbreeding, and<br />
<strong>the</strong>refore morphs <strong>of</strong> <strong>the</strong> same species, or are not interbreeding and thus are different species. Critically, such studies<br />
need to be carried out on samples taken from exactly <strong>the</strong> same place, o<strong>the</strong>rwise <strong>the</strong>re can be confusion <strong>of</strong> <strong>the</strong> effects<br />
<strong>of</strong> restricted migration.<br />
The haplochromine cichlids <strong>of</strong> Lake Malawi share a peculiarity with those <strong>of</strong> Lake Victoria. It is common to find<br />
two or more completely different coloured kinds <strong>of</strong> males in <strong>the</strong> same place, yet <strong>the</strong>se colour forms show only very<br />
subtle differences in body proportions or o<strong>the</strong>r characteristics. The same holds for <strong>the</strong> chambo species Oreochromis<br />
karongae and O. squamipinnis. Although this tends to be taken for granted by people who work on Lakes Malawi<br />
and Victoria, it is actually an extremely unusual phenomenon. Pioneering researchers, such as Fryer (1959)<br />
considered that <strong>the</strong>se colour forms were morphs <strong>of</strong> <strong>the</strong> same species, but with <strong>the</strong> advent <strong>of</strong> SCUBA equipment,<br />
later studies by Holzberg (1972) and Ribbink et al. (1983) showed that subtle differences in habitat preferences and<br />
behaviour were correlated with colour differences, suggesting that <strong>the</strong>se forms were indeed different species.<br />
The first studies to test genetic differentiation between sympatric (co-occurring at <strong>the</strong> same site) species used<br />
allozyme electrophoresis to investigate three forms <strong>of</strong> Petrotilapia spp. at Monkey Bay (McKaye et al. 1982) and<br />
four forms <strong>of</strong> Pseudotropheus zebra at Nkhata Bay (McKaye et al. 1984). All <strong>of</strong> <strong>the</strong> Petrotilapia were found to be<br />
genetically differentiated, and <strong>the</strong>y were later described as new species (Marsh 1983). The P. zebra colour forms fell<br />
into two species groups, <strong>the</strong> blue and black striped (BB) and <strong>the</strong> orange blotch (OB) forms were genetically<br />
indistinguishable, and thus considered to be one species, while <strong>the</strong> plain blue (B) and <strong>the</strong> plain white (W) forms<br />
were considered to be a second genetically distinct species, later named Pseudotropheus callainos (Stauffer & Hert<br />
1992).<br />
We employed microsatellites to test for differences among three putative species <strong>of</strong> <strong>the</strong> P. zebra complex (P. zebra,<br />
P. callainos, P. ‘gold zebra’) and six <strong>of</strong> <strong>the</strong> P. tropheops complex (‘olive’, ‘mauve’, ‘band’, ‘rust’, ‘black’ and<br />
‘deep’) at Nkhata Bay. In two <strong>of</strong> <strong>the</strong>se comparison, P. ‘tropheops band’ v P. ‘tropheops rust’ and P. zebra v P. ‘gold<br />
zebra’, <strong>the</strong> females were so similar in appearance that we could not trust ourselves to identify <strong>the</strong>m reliably, and we<br />
had to confine our sampling to sexually mature males in breeding colours. All nine forms showed significant genetic<br />
differentiation (van Oppen et al. 1998).
38<br />
Lake Malawi Fisheries Management Symposium - Proceedings<br />
All three studies have consistently demonstrated that colour forms <strong>of</strong> mbuna found in <strong>the</strong> same location tend to be<br />
different species. The exception lies in <strong>the</strong> BB/OB and B/W forms <strong>of</strong> <strong>the</strong> P. zebra complex. These colour forms<br />
seem to represent within-species polymorphisms. It is striking that <strong>the</strong> rarer colour form (OB and W) are mostly<br />
found in females- males <strong>of</strong> <strong>the</strong>se forms are extremely rare are around 100 times less abundant than females. So, <strong>the</strong><br />
pattern seems to be one common male colour form at a site = one species.<br />
O<strong>the</strong>r applications to conservation biology<br />
Molecular methods can also be used in <strong>the</strong> study <strong>of</strong> <strong>the</strong> genetic variability <strong>of</strong> populations that have undergone a drop<br />
in density. Sometimes, when population size is dramatically reduced, <strong>the</strong>re can be a sharp loss in genetic variation,<br />
which can persist even after numbers have increased. This has <strong>the</strong> potential to limit <strong>the</strong> population’s potential to<br />
persist in <strong>the</strong> long run, as <strong>the</strong>re may be a lack <strong>of</strong> genetic variants that can cope with novel environmental stresses. In<br />
<strong>the</strong> most extreme cases, <strong>the</strong> population can become inbred, meaning that individuals can end up with 2 copies <strong>of</strong><br />
harmful recessive genes, <strong>the</strong> effects <strong>of</strong> which are normally masked. This can lead to populations declining into<br />
extinction. In such circumstances, transplantation <strong>of</strong> individuals from o<strong>the</strong>r populations might be needed to restore<br />
variability. Loss <strong>of</strong> genetic diversity can <strong>of</strong>ten be a problem in captive-bred stocks, and can lead to changes in stock<br />
<strong>management</strong> practises.<br />
Non-molecular approaches to assessing population structure<br />
Tagging<br />
The most obvious way to study fish movements is to catch fish, mark or tag <strong>the</strong>m in some way and <strong>the</strong>n wait until<br />
<strong>the</strong>y are recaptured and see where <strong>the</strong>y turn up. Lowe (1952) tagged 6,237 chambo in <strong>the</strong> SE Arm, with <strong>the</strong> intention<br />
<strong>of</strong> using mark and recapture data to determine growth rates. She recovered 2 fish. A tagging experiment with utaka<br />
around Likoma was carried out in <strong>the</strong> 1980s, but with little apparent success (Jennings, pers. comm.). There are<br />
several reasons why tagging is unlikely to prove effective with most Lake Malawi fishes.<br />
First <strong>of</strong> all, <strong>the</strong> <strong>fisheries</strong> are based on catching very large numbers <strong>of</strong> very small fish. In <strong>the</strong> early 1990s, <strong>the</strong> estimate<br />
annual catch <strong>of</strong> Lethrinops ‘pink head’ from Lake Malombe was 850,000,000 fish (Turner 1996). The total<br />
population <strong>of</strong> Diplotaxodon limnothrissa in Lake Malawi was estimated at around 1,450,000,000 fish (Turner 1996).<br />
With such huge populations, an immense number would need to be tagged and a vast number <strong>of</strong> captured fishes<br />
examined for tags to have a hope <strong>of</strong> finding any tagged and released fish at all.<br />
For most tagging studies, fishery biologists depend on fishermen to notice tags and return <strong>the</strong>m, usually to claim a<br />
reward. This is likely to be very difficult in a situation such as pertains around Lake Malawi, where thousands <strong>of</strong><br />
illiterate fishermen are scattered around hundreds <strong>of</strong> separate fishing villages. Perhaps radio announcements might<br />
be <strong>the</strong> only way to contact <strong>the</strong>m.<br />
The most severe problem lies in studies <strong>of</strong> <strong>the</strong> cichlid fishes, which make up by far <strong>the</strong> most significant part <strong>of</strong> <strong>the</strong><br />
<strong>lake</strong>’s catch by weight and value. Cichlids have closed swimbladders. When brought to <strong>the</strong> surface from deep water,<br />
<strong>the</strong> gas in <strong>the</strong> bladder doubles in volume for every 10 metres ascended. Fish with open swimbladders can expel<br />
excess gas via a duct to <strong>the</strong> gut, but cichlids have to rely on much slower physiological processes. In a series <strong>of</strong><br />
experiments, Ribbink and co-workers demonstrated that mbuna required many hours to adjust to modest depth<br />
changes (summarised in Ribbink et al. 1983). In my own experience, few mbuna or chambo can survive being<br />
brought directly to <strong>the</strong> surface from depths in excess <strong>of</strong> 10 metres. It has been suggested that pelagic cichlids such as<br />
<strong>the</strong> ‘big-eye’ species <strong>of</strong> Diplotaxodon migrate from great depths to <strong>the</strong> surface at night (Thompson et al. 1995),<br />
which might indicate special adaptations to rapid pressure changes. However, in April 2001, I conducted a pilot<br />
study to see if it would be possible to collect live Diplotaxodon and Rhamphochromis from chilimira catches at<br />
Nkhata Bay. Survival <strong>of</strong> Diplotaxodon was zero out <strong>of</strong> more than 50 individuals, including some <strong>of</strong> <strong>the</strong> big-eye<br />
species. It seems highly unlikely that any cichlids collected by normal fishing methods, o<strong>the</strong>r than a few seined from<br />
shallow shores or very close to <strong>the</strong> surface, could possibly survive capture and tagging.<br />
Thus, it seems that for more species, tagging studies can be ruled out as a practical method for <strong>the</strong> study <strong>of</strong> stock<br />
structure in Lake Malawi.
39<br />
Lake Malawi Fisheries Management Symposium - Proceedings<br />
Parasite studies<br />
Several studies <strong>of</strong> marine fish migrations have been able to show that populations <strong>of</strong> fish do not intermingle because<br />
<strong>the</strong>y have distinct populations <strong>of</strong> parasites, which could be transmitted, were <strong>the</strong>y ever in close contact. Equally,<br />
knowledge <strong>of</strong> <strong>the</strong> life histories <strong>of</strong> particular parasites may indicate that fish must have been infected in a different<br />
place to where <strong>the</strong>y have presently been collected, showing that <strong>the</strong>y have spent time at <strong>the</strong> site where <strong>the</strong> infective<br />
stages <strong>of</strong> <strong>the</strong> parasite can be found. The use <strong>of</strong> parasites as ‘biological tags’ is reviewed by MacKenzie & Abaunza<br />
(1998). Unfortunately, almost nothing is known <strong>of</strong> <strong>the</strong> taxonomy or life histories <strong>of</strong> fish parasites in Lake Malawi. It<br />
seems likely that many cichlid species will probably prove to be so closely related and recently diverged from one<br />
ano<strong>the</strong>r that <strong>the</strong>y have not had time to evolve different parasites.<br />
Otolith microchemistry<br />
Ano<strong>the</strong>r recently developed hi-tech method is <strong>the</strong> analysis <strong>of</strong> chemical composition <strong>of</strong> hard tissues, such as otoliths.<br />
The method has been useful in distinguishing among fish which spend part <strong>of</strong> <strong>the</strong> time in <strong>the</strong> sea from those living<br />
entirely in freshwater (Limburg et al. 1998), distinguishing those spending all <strong>of</strong> <strong>the</strong>ir time in <strong>the</strong> sea from those<br />
spending part <strong>of</strong> <strong>the</strong> time in freshwater (Tsukamoto et al. 1998) and in distinguishing marine fish which had<br />
originated from different estuaries (Milton et al. 1997) or freshwater streams (Kennedy et al. 2000). It is doubtful if<br />
<strong>the</strong> method has any use in distinguishing among fishes from different parts <strong>of</strong> <strong>the</strong> same <strong>lake</strong>, although it might be<br />
worth trying out <strong>the</strong> method on river-spawning fishes, such as mpasa and sanjika.<br />
Species identification<br />
Given <strong>the</strong> limited amount <strong>of</strong> information on species distributions and catch compositions, much can still be learned<br />
from simply recording <strong>the</strong> species composition <strong>of</strong> fishery catches. This can give a useful rough estimate <strong>of</strong> gear<br />
interactions within a restricted geographical locality, but cannot really delimit <strong>the</strong> geographic extent <strong>of</strong> stocks.<br />
Conclusion<br />
Molecular studies <strong>of</strong> stock structure are expensive, and require considerable technical expertise and sophisticated<br />
equipment. Is <strong>the</strong> effort worthwhile? I suggest that it is.<br />
Most <strong>management</strong> decisions concerning Lake Malawi <strong>fisheries</strong> are made on <strong>the</strong> basis <strong>of</strong> ‘rules <strong>of</strong> thumb’, ra<strong>the</strong>r than<br />
hard quantitative evidence. In truth, nobody really knows whe<strong>the</strong>r most stocks are over- or under-exploited. Beach<br />
seines are regarded as destructive on <strong>the</strong> basis <strong>of</strong> little hard evidence (Sarch & Allison 2000), based on inspection <strong>of</strong><br />
species and sizes caught, with little knowledge <strong>of</strong> <strong>the</strong> real levels <strong>of</strong> juvenile mortality and its link to population sizes<br />
<strong>of</strong> exploited species. Closed seasons are not closely linked to any quantitative assessment <strong>of</strong> breeding seasonality, or<br />
any detailed knowledge <strong>of</strong> <strong>the</strong> effects <strong>of</strong> recruitment on exploitation during <strong>the</strong> breeding season (FAO 1993). Trawl<br />
fishery licences are allocated on <strong>the</strong> basis <strong>of</strong> crude biomass estimates from trawl surveys, with possibly unjustified<br />
assumptions made on <strong>the</strong> relationship between trawl CPUE and biomass and between biomass and MSY (FAO<br />
1976).<br />
None <strong>of</strong> <strong>the</strong>se statements should be interpreted as criticism <strong>of</strong> <strong>the</strong> <strong>fisheries</strong> institutions <strong>of</strong> <strong>the</strong> riparian countries. The<br />
size and complexity <strong>of</strong> <strong>the</strong> <strong>lake</strong>, its fauna and its <strong>fisheries</strong> render attempts at data collection and interpretation a<br />
daunting task. But what I am suggesting is that it is important to prioritise use <strong>of</strong> research resources, particularly<br />
manpower. Molecular studies <strong>of</strong> stock structure can be carried out with <strong>the</strong> assistance <strong>of</strong> externally funded projects<br />
and external expertise, with little cost in staff time or resources from local institutions. A persistent problem with<br />
short-term externally-funded and largely externally-implemented projects is that <strong>of</strong> ensuring that <strong>the</strong> work continues<br />
after <strong>the</strong> end <strong>of</strong> <strong>the</strong> funding. Fortunately, this is not necessary with work on molecular stock structure. Occasionally,<br />
it might be useful to repeat such a study to look for temporal changes in migration patterns resulting from major<br />
changes in environmental conditions or exploitation regimes. However, in general, <strong>the</strong> work need only be done once<br />
in order to generate useful rules <strong>of</strong> thumb, which can inform <strong>management</strong> recommendations in perpetuity.<br />
Acknowledgements<br />
The research on which this paper was based was funded by <strong>the</strong> UK Department for International Development<br />
(DFID) Environment Research Programme and by <strong>the</strong> Natural Environment Research Council (NERC), and carried<br />
out with <strong>the</strong> co-operation <strong>of</strong> <strong>the</strong> Dept. <strong>of</strong> Fisheries, Malawi, TAFIRI and <strong>the</strong> University <strong>of</strong> Malawi.
40<br />
Lake Malawi Fisheries Management Symposium - Proceedings<br />
References<br />
Arnegard, M. E., Markert, J.A., Danley, P.D., Stauffer, J.R., Ambali, A.J. & Kocher, T.D. 1999. Population structure and colour<br />
variation <strong>of</strong> <strong>the</strong> cichlid fish Labeotropheus fuelleborni Ahl along a recently formed archipelago <strong>of</strong> rocky habitat patches<br />
in sou<strong>the</strong>rn Lake Malawi. Proc. Roy. Soc. Lond. B 266: 119-130.<br />
Avise, J.C. 1994. Molecular Markers, Natural History and Evolution. Chapman & Hall, NY.<br />
Carvalho, G.R. & Hauser, L. 1998. Advances in <strong>the</strong> molecular analysis <strong>of</strong> fish population structure. Ital. J. Zool. 65S, 21-33.<br />
Danley, P.D., Markert, J.A., Arnegard, M.E. & Kocher, T.D. 2000. Divergence with gene flow in <strong>the</strong> rock-dwelling cichlids <strong>of</strong><br />
Lake Malawi. Evolution 54, 1725-1737.<br />
FAO. 1976. Promotion <strong>of</strong> integrated fishery development, Malawi. FAO, Rome.<br />
FAO. 1993. Fisheries <strong>management</strong> in south-east Lake Malawi, <strong>the</strong> Upper Shire River and Lake Malombe. CIFA Tech. Paper 21,<br />
Rome.<br />
Fryer, G. 1959. The trophic relationships and ecology <strong>of</strong> some littoral communities <strong>of</strong> Lake Nyasa with especial reference to <strong>the</strong><br />
fishes and a discussion <strong>of</strong> <strong>the</strong> evolution <strong>of</strong> a group <strong>of</strong> rock-frequenting cichlidae. Proc. Zool. Soc. London. 132, 153-<br />
281.<br />
Holzberg, S. 1978. A field and laboratory study <strong>of</strong> <strong>the</strong> behaviour and ecology <strong>of</strong> Pseudotropheus zebra (Boulenger), and endemic<br />
cichlid <strong>of</strong> Lake Malawi (Pisces: Cichlidae). Zool. Syst. Evol.- Forsch. 16, 171-187.<br />
Kennedy, B. P., Blum, J.D., Folt, C.L. & Nislow, K.H. 2000. Using natural strontium signatures as fish markers: methodology<br />
and application. Can. J. Fish. Aq. Sci. 57, 2280-2292.<br />
Kocher, T.D., Lee, W.J., Sobolewska, H., Penman, D. & McAndrew, B. 1998. A genetic linkage map <strong>of</strong> a cichlid fish, <strong>the</strong> tilapia<br />
(Oreochromis niloticus). Genetics 148, 1225-1232.<br />
International Human Genome Sequencing Consortium. 2001. Initial sequencing and analysis <strong>of</strong> <strong>the</strong> human genome. Nature 409,<br />
860-921.<br />
Jarne, P. & Lagoda, P.J.L. 1996. Microsatellites, from molecules to populations and back. Trends Ecol. Evol. 11, 424-429.<br />
Lee, W.J. & Kocher, T.D. 1996. Microsatellite DNA markers for genetic mapping in Oreochromis niloticus. J. Fish Biol. 49,<br />
169-171.<br />
Limburg, K.E. 1998. Anomalous migrations <strong>of</strong> anadromous herrings revealed with natural chemical tracers. Can. J. Fish. Aq.<br />
Sci. 55, 431-437.<br />
Lowe, R.H. 1952. Report on <strong>the</strong> Tilapia and O<strong>the</strong>r Fish and Fisheries <strong>of</strong> Lake Nyasa. Colonial Office, Fishery Publications,<br />
London.<br />
MacKenzie, K. & Abauza, P. 1998. Parasites as biological tags for stock discrimination <strong>of</strong> marine fish: a guide to procedures and<br />
methods. Fisheries Research 38, 45-56.<br />
Majerus, M., Amos, W. & Hurst, G. 1994. Evolution: <strong>the</strong> Four Billion Year War. Longman, Halrow, England.<br />
Markert, J.A., Arnegard, M.E., Danley, P.D. & Kocher, T.D. 1999. Biogeography and population genetics <strong>of</strong> <strong>the</strong> Lake Malawi<br />
cichlid Melanochromis auratus: habitat transience, philopatry and speciation. Mol. Ecol. 8, 1013-1026.<br />
Marsh, A.C. 1983. A taxonomic study <strong>of</strong> <strong>the</strong> fish genus Petrotilapia (Pisces: Cichlidae) from Lake Malawi. Bull. J.L.B. Smith<br />
Institute <strong>of</strong> Ichthyology, 48: 1-14.<br />
McKaye, K.R., Kocher, T., Reinthal, P. & Kornfield, I. 1982. A sympatric sibling species complex <strong>of</strong> Petrotilapia Trewavas<br />
from Lake Malawi analysed by enzyme electrophoresis (Pisces: Cichlidae). Zool. J. Linn. Soc. 76, 91-96.<br />
McKaye, K.R., Kocher, T., Reinthal, P., Harrison, R. & Kornfield, I. 1984. Genetic evidence for allopatric and sympatric<br />
differentiation among colour morphs <strong>of</strong> Lake Malawi cichlid fish. Evolution 38, 215-219.<br />
Menz, A. (ed.) The Fishery Potential and Productivity <strong>of</strong> <strong>the</strong> Pelagic Zone <strong>of</strong> Lake Malawi/Niassa. Natural Resources Institute,<br />
Chatham, UK.<br />
Menz, A., Bulirani, A. & Goodwin, C.M. 1995. Acoustic estimates <strong>of</strong> fish biomass. Pp. 307-349 in Menz (ed.) The Fishery<br />
Potential and Productivity <strong>of</strong> <strong>the</strong> Pelagic Zone <strong>of</strong> Lake Malawi/Niassa. Natural Resources Institute, Chatham, UK.<br />
Milton, D.A., Chenery, S.R., Farmer, M.J. & Blaber, S.J.M. 1997. Identifying <strong>the</strong> spawning estuaries <strong>of</strong> <strong>the</strong> tropical shad<br />
Tenualosa toli, using otolith microchemistry. Mar. Ecol. Prog. Series 153, 283-291.<br />
Mueller, U.G. & Wolfenbarger, L.L. 1999. AFLP genotyping and fingerprinting. Trends Ecol. Evol. 14, 389-394.<br />
Ribbink, A.J., Marsh, B.A., Marsh, A.C., Ribbink, A.C. & Sharp, B.J. 1983. A preliminary survey <strong>of</strong> <strong>the</strong> cichlid fishes <strong>of</strong> rocky<br />
habitats in Lake Malawi. S. Afr. J. Zool. 18, 149-310.<br />
Sarch, M.T. & Allison, E.H. 2000. Fluctuating <strong>fisheries</strong> from Africa’s inland waters: well adapted livelihoods, maladapted<br />
<strong>management</strong>. Proceedings <strong>of</strong> <strong>the</strong> 10 th International Conference <strong>of</strong> <strong>the</strong> Institute <strong>of</strong> Fisheries Economics and Trade,<br />
Corvallis, Oregon. http://osu.orst.edu/dept/IIFET/2000/papers/sarch/pdf<br />
Shaw, P.W., Turner, G.F., Idid, M.R., Robinson, R.L. & Carvalho, G.R. 2000. Genetic population structure indicates sympatric<br />
speciation <strong>of</strong> Lake Malawi pelagic cichlids. Proc. Roy Soc. London B 267, 2273-2280.<br />
Slatkin, M. 1985. Rare alleles as indicators <strong>of</strong> gene flow. Evolution 39, 53-65.<br />
Sparre, P., Ursin, E. & Venema, S.C. 1989. Introduction to tropical fish stock assessment. Part 1- Manual. FAO Fisheries<br />
Technical Paper 306/1.<br />
Stauffer, J.R. & Hert, E. 1992. Pseudotropheus callainos, a new species <strong>of</strong> mbuna (Cichlidae), with analysis <strong>of</strong> changes<br />
associated with two intra-lacustrine transplantations in Lake Malawi, Africa. Ichthyol. Explore. Freshwaters 3, 253-<br />
264.<br />
Sunnucks, P. 2000. Efficient genetic markers for population biology. Trends Ecol. Evol. 15, 199-203.<br />
Thompson, A.B. 1995 Fisheries potential. Pp. 369-386 in Menz (ed.) The Fishery Potential and Productivity <strong>of</strong> <strong>the</strong> Pelagic Zone<br />
<strong>of</strong> Lake Malawi/Niassa. Natural Resources Institute, Chatham, UK.
41<br />
Lake Malawi Fisheries Management Symposium - Proceedings<br />
Thompson, A.B., Allison, E.H. & Ngatunga, B.P. 1995. Spatial and temporal distribution <strong>of</strong> fish in pelagic waters. Pp. 279-307 in<br />
Menz (ed.) The Fishery Potential and Productivity <strong>of</strong> <strong>the</strong> Pelagic Zone <strong>of</strong> Lake Malawi/Niassa. Natural Resources<br />
Institute, Chatham, UK.<br />
Tsukamoto, K., Nakai, I. & Tesch, W.V. 1998. Do all freshwater eels migrate? Nature 396, 635-636.<br />
Turner, G.F., Carvalho, G.R., Robinson, R.L. & Shaw, P.W. 2000. Biodiversity Conservation & Sustainable Utilisation <strong>of</strong><br />
Pelagic Cichlid Fishes <strong>of</strong> Lake Malawi/Niassa/Nyasa. Ncheni Project Final Report, University <strong>of</strong> Hull, UK<br />
van Oppen, M.J.H., Turner, G.F., Rico, C., Deutsch, J.C., Ibrahim, K.M., Robinson, R.L. & Hewitt, G.M. 1997. Unusually finescale<br />
genetic structuring found in rapidly speciating Malawi cichlid fishes. Proc. Roy. Soc. London B 264, 1803-1812.<br />
van Oppen, M.J.H., Turner, G.F., Rico, C., Robinson, R.L., Deutsch, J.C., Genner, M.J. & Hewitt, G.M. 1998. Assortative<br />
mating among rock-dwelling cichlid fishes supports high estimates <strong>of</strong> species richness from Lake Malawi. Molecular<br />
Ecology 7, 991-1001<br />
Wright, S. 1951. The genetical structure <strong>of</strong> populations. Ann. Eugen. 15, 323-354.
42<br />
Lake Malawi Fisheries Management Symposium - Proceedings<br />
Fisheries Development, Management, and <strong>the</strong> Role <strong>of</strong> Government<br />
Tony Seymour<br />
Bryn Eryr Uchaf, Llansadwrn, Anglesey LL59 5SA, UK, Telephone +44 (0)1248 712540, Fax +44 (0)1248 717234,<br />
Email: seymourevans@hotmail.com<br />
Abstract<br />
Studies conducted over <strong>the</strong> past decade have identified pelagic and deep demersal fish stocks in Lake Malawi capable <strong>of</strong> sustaining<br />
an annual yield in excess <strong>of</strong> 40,000 tonnes but only marginally exploited at present. In addition, <strong>the</strong>re are underexploited stocks <strong>of</strong><br />
small demersal cichlids in Lake Malawi in depths <strong>of</strong> less than 50m, and <strong>the</strong>re are opportunities for increasing production from <strong>the</strong><br />
existing artisanal <strong>fisheries</strong> <strong>of</strong> Lakes Malawi and Malombe by managing <strong>the</strong>m better and by paying closer attention to <strong>the</strong> near-shore<br />
environment. From <strong>the</strong> standpoint <strong>of</strong> sustainable biological productivity <strong>the</strong>re is no reason why annual production should not be<br />
doubled over current levels.<br />
Translating biological potential into industrial output is not simply a matter <strong>of</strong> importing technologies and securing a source <strong>of</strong><br />
investment capital. Development <strong>of</strong> <strong>the</strong> fishing industry will require at least as much attention to entrepreneurial development as to<br />
technological change. It is suggested that nei<strong>the</strong>r <strong>of</strong> <strong>the</strong> two smaller-scale categories <strong>of</strong> fishing business on Lakes Malawi and<br />
Malombe – artisanal and small-scale mechanised – function in <strong>the</strong> same way as enterprises <strong>of</strong> comparable scale in <strong>the</strong> fishing<br />
industries <strong>of</strong> developed nations. It will be necessary to break <strong>the</strong> barriers which currently limit <strong>the</strong> capacity <strong>of</strong> individual enterprises<br />
to expand, and prevent <strong>the</strong>ir graduation from one level to ano<strong>the</strong>r. It will be necessary also to develop a vision for <strong>the</strong> industry which<br />
focuses on human resource development, foresees <strong>the</strong> creation <strong>of</strong> intermediate stages in business complexity so as to facilitate<br />
enterprise growth, and guides <strong>the</strong> acquisition and flow <strong>of</strong> information. The capture <strong>of</strong> information via short-term expatriate experts<br />
may be less efficient than <strong>the</strong> secondment <strong>of</strong> Malawian fishermen to overseas fishing industries and, under controlled conditions,<br />
<strong>the</strong> encouragement <strong>of</strong> joint ventures with o<strong>the</strong>r fishing nations. To date, Malawi’s efforts in <strong>fisheries</strong> development appear clumsy and<br />
poorly researched when compared to <strong>the</strong> sophistication <strong>of</strong> scientific studies on <strong>the</strong> resource base.<br />
Hi<strong>the</strong>rto, <strong>the</strong> market has not been a constraint to <strong>fisheries</strong> development. Nationally and regionally <strong>the</strong> demand for fish exceeds <strong>the</strong><br />
supply by a substantial margin, and, in keeping with Malawi’s strength as a trading nation, <strong>the</strong> fish trade has proved vigorous and<br />
extremely adaptable. That does not mean that it could not be improved, needs no support, or might not become a constraint at<br />
higher levels <strong>of</strong> production. Ultimately, <strong>the</strong> streng<strong>the</strong>ning <strong>of</strong> producer-trader linkages, <strong>the</strong> development <strong>of</strong> community-based<br />
organisations for business as well as <strong>management</strong> functions and <strong>the</strong> exploration <strong>of</strong> export markets might provide new points <strong>of</strong><br />
departure for <strong>fisheries</strong> development.<br />
Service provision has been a major issue in recent years. Experience gained since <strong>the</strong> early 1990s has shown that <strong>the</strong> withdrawal <strong>of</strong><br />
government services to <strong>the</strong> fishing industry did little to stimulate entrepreneurial development but instead led to a discernible<br />
weakening <strong>of</strong> <strong>the</strong> sector, with negative economic and environmental consequences. World-wide, fishing industries tend to comprise<br />
a patchwork <strong>of</strong> private sector and state-led elements, and it is considered normal for governments to intervene in areas unattractive<br />
to <strong>the</strong> private sector and to use direct cash transfers and subsidies, both as instruments <strong>of</strong> development (fleet renewal, new<br />
technology) and <strong>management</strong> (decommissioning and buy-back). Although private sector participation in <strong>the</strong> <strong>fisheries</strong> ancillary trades<br />
must be retained as a development goal, <strong>the</strong> Government <strong>of</strong> Malawi is now faced with <strong>the</strong> need to rebuild and expand upon its<br />
former services network if <strong>the</strong> production opportunities so clearly identified are to be exploited within <strong>the</strong> foreseeable future.<br />
The development <strong>of</strong> new mechanised and artisanal <strong>fisheries</strong> has important implications for <strong>management</strong> if it is to avoid a harmful<br />
accumulation <strong>of</strong> effort on hard-pressed traditional stocks. There are some signs that, despite <strong>the</strong> daunting size <strong>of</strong> <strong>the</strong> task ahead,<br />
Malawi is on <strong>the</strong> right course in implementing its co-<strong>management</strong> policy. But <strong>the</strong> handling <strong>of</strong> interactions between <strong>the</strong> anticipated<br />
future generations <strong>of</strong> mechanised and artisanal <strong>fisheries</strong> will require <strong>management</strong> skills <strong>of</strong> a higher order than those evident in<br />
recent years. The potential for increased economic rewards will be tempered by increasing risk as <strong>the</strong> complexity and catching<br />
power <strong>of</strong> <strong>the</strong> industry grows.<br />
Introduction<br />
Whoever wishes to understand <strong>the</strong> fishery sector in Malawi has to negotiate some fundamental anomalies and<br />
uncertainties. Lake Malawi is over-fished. It is also under-fished. Its <strong>fisheries</strong> are over-subscribed, and underdeveloped.<br />
It <strong>the</strong>refore needs both <strong>management</strong> and development, responsibility for which would until recently have<br />
been assigned without hesitation to <strong>the</strong> government. But in both <strong>of</strong> <strong>the</strong>se fields <strong>the</strong> role <strong>of</strong> government is in a process<br />
<strong>of</strong> redefinition, and <strong>the</strong> lines dividing public and private responsibility have yet to be clearly drawn. This paper is a<br />
contribution to <strong>the</strong> public-private debate, and starts by proposing a framework for increasing production.<br />
• The immediate productive potential <strong>of</strong> <strong>the</strong> fishing industry <strong>of</strong> Lakes Malawi and Malombe is defined by <strong>the</strong><br />
following five factors:<br />
• <strong>the</strong> extent and nature <strong>of</strong> <strong>the</strong> fish resources;<br />
• <strong>the</strong> market for fish, both domestic and export, and <strong>the</strong> efficiency with which <strong>the</strong> fish trade is able to match<br />
landings with markets;<br />
• <strong>the</strong> human resource base <strong>of</strong> <strong>the</strong> catching subsector, including skills in fishing and financial <strong>management</strong>,<br />
and <strong>the</strong> ability to retain and reinvest earnings;<br />
• <strong>the</strong> availability and nature <strong>of</strong> ancillary industries and services, including boatbuilding, gear and equipment<br />
supply, ice, financial services and technical advisory support, and<br />
• <strong>the</strong> effectiveness <strong>of</strong> <strong>fisheries</strong> <strong>management</strong> regimes, whe<strong>the</strong>r operated by <strong>the</strong> government, <strong>the</strong> industry itself,<br />
or jointly.
43<br />
Lake Malawi Fisheries Management Symposium - Proceedings<br />
The following sections <strong>of</strong> this paper aim to take stock <strong>of</strong> <strong>the</strong> current position with regard to each <strong>of</strong> <strong>the</strong>se factors,<br />
and to suggest what roles <strong>the</strong> government might properly assume in facilitating <strong>the</strong> realisation <strong>of</strong> production<br />
opportunities so clearly identified by recent resource assessments. It will be suggested that merely identifying<br />
underexploited resources and developing appropriate harvesting technologies will not be sufficient to ensure that <strong>the</strong><br />
desired outcome is actually achieved. Instead, a conscious industrial development approach is required, with as<br />
much attention paid to assisting enterprise growth as to “transferring technology”, as well as government’s<br />
resumption <strong>of</strong> many <strong>of</strong> <strong>the</strong> industry support functions divested during <strong>the</strong> 1990s.<br />
Resources and <strong>fisheries</strong><br />
Over <strong>the</strong> past decade a succession <strong>of</strong> scientific studies have brought about a quantum leap in our understanding <strong>of</strong><br />
<strong>the</strong> abundance, biology and ecology <strong>of</strong> <strong>the</strong> fish stocks <strong>of</strong> <strong>the</strong> Lake Malawi system. Although some important gaps<br />
remain, it is now possible to speak with some confidence <strong>of</strong> <strong>the</strong> potential yields from currently unexploited <strong>fisheries</strong>,<br />
or <strong>of</strong> <strong>fisheries</strong> from which better <strong>management</strong> might lead to improved yields. Fish stocks in Lake Malawi that are<br />
currently unexploited or only marginally exploited are listed in Table 1.<br />
Of <strong>the</strong> stocks identified above, some are already targeted to a limited extent by existing fishing operations.<br />
MALDECO harvests around 1,000 tonnes annually from <strong>the</strong> deep demersal stocks in <strong>the</strong> north <strong>of</strong> <strong>the</strong> South East<br />
Arm (Area C) and <strong>the</strong> South West Arm, as well as ano<strong>the</strong>r 1,000 tonnes <strong>of</strong> pelagics, principally Diplotaxodon and<br />
Rhamphochromis spp. In addition, <strong>the</strong> artisanal <strong>fisheries</strong> take small quantities <strong>of</strong> Rhamphochromis, and variable –<br />
and sometimes very large – quantities <strong>of</strong> Engrualicypris sardella. Overall, Table 1 represents a biologically feasible<br />
increase in annual yield from Lake Malawi <strong>of</strong> around 40,000 tonnes.<br />
Shallow water (
44<br />
Lake Malawi Fisheries Management Symposium - Proceedings<br />
8. Enhancement <strong>of</strong> <strong>the</strong> existing artisanal <strong>fisheries</strong> by improving <strong>management</strong>, drawing from a wide range <strong>of</strong><br />
potential <strong>management</strong> measures including entry and effort limitation, closed or limited-fishery areas and<br />
prohibition or restriction <strong>of</strong> harmful gears.<br />
Table 1. Biomass and sustainable yield estimates <strong>of</strong> marginally exploited stocks in Lake Malawi<br />
Stock Area Author Biomass Yield as<br />
% <strong>of</strong><br />
stock<br />
Estimated<br />
sustainable<br />
yield<br />
Demersal stocks<br />
Deep demersal South East Arm (C) 1994-96 Banda & Tόmasson 1997<br />
6,040 30 1,812<br />
(>50m)<br />
South West Arm 1994-96<br />
7,220 30 2,166<br />
Domira Bay to Chia Lagoon 1994-95 Banda& Tόmasson 1996<br />
6,865 30 2,060<br />
Chia to Nkhotakota 1994 850 30 255<br />
Nkhotakota to Dwangwa 1994 1,050 30 315<br />
Dwangwa to Sanga 1994<br />
3,570 30 1,071<br />
Ngara to Lufira 1981 Tweddle 1981 1,588 45 715<br />
Total 27,183 8,394<br />
Offshore pelagic stocks<br />
Diplotaxodon Lake Malawi Menz & Thompson 1995 119,700 19 22,700<br />
Rhamphochromis 16,800 17 2,800<br />
Copadichromis 8,700 16 1,400<br />
O<strong>the</strong>r cichlids 3,400 18 600<br />
Engraulicypris 5,100 63 3,200<br />
Opsaridium 1,300 23 300<br />
Synodontis<br />
13,400 17 2,300<br />
Total 168,400 33,300<br />
Total 41,694<br />
Markets<br />
Hi<strong>the</strong>rto, <strong>the</strong> market has not been a primary constraint to <strong>fisheries</strong> development. Nationally and regionally <strong>the</strong><br />
demand for fish exceeds <strong>the</strong> supply by a substantial margin, and <strong>the</strong> fish trade has proved vigorous and extremely<br />
adaptable. That does not mean that it could not be improved, needs no support, or might not become a constraint if<br />
fish production is significantly increased; but in Malawi <strong>the</strong> market must, for <strong>the</strong> present, be considered <strong>of</strong> secondary<br />
importance in conditioning <strong>the</strong> evolution <strong>of</strong> <strong>the</strong> sector.<br />
The processing, distribution and ultimate retailing <strong>of</strong> fish within Malawi is mostly undertaken by a very large<br />
number <strong>of</strong> small-scale operators. Processing infrastructure is generally simple and requires little capital investment:<br />
it is frequently owned by members <strong>of</strong> <strong>the</strong> <strong>lake</strong>shore fishing communities, and may be rented out to visiting<br />
trader/processors. Some distributors own a means <strong>of</strong> transport (bicycles, pickup trucks), but many rely on public<br />
transport. Four principal pricing points exist – <strong>the</strong> beach or landed price, a <strong>lake</strong>shore wholesale price (usually for<br />
processed fish), an inland/urban wholesale price and <strong>the</strong> final retail or consumer price. Typically <strong>the</strong> consumer price<br />
is 2-4 times <strong>the</strong> beach price, with <strong>the</strong> major part <strong>of</strong> <strong>the</strong> margin and pr<strong>of</strong>it concentrated at <strong>the</strong> final retail stage.<br />
Although <strong>the</strong>re is some degree <strong>of</strong> specialization into processors, wholesale distributors and retailers, <strong>the</strong> high<br />
pr<strong>of</strong>itability <strong>of</strong> retailing encourages many traders to engage in <strong>the</strong> entire cycle, each processing, transporting and<br />
retailing relatively tiny quantities <strong>of</strong> fish.<br />
What is perhaps surprising, given that <strong>the</strong> fish trade is a well-established and pr<strong>of</strong>itable business with an annual<br />
marginal value <strong>of</strong> some US$25 millions, is that <strong>the</strong> scale <strong>of</strong> processing and trading enterprises remains so small.<br />
Only on rare occasions has any individual venture (outside Maldeco’s distribution system) advanced beyond <strong>the</strong><br />
level <strong>of</strong> <strong>the</strong> one-tonne pickup truck. The reasons for this are probably similar to those which limit <strong>the</strong> size <strong>of</strong><br />
artisanal fishing businesses, a subject discussed below. It is a matter <strong>of</strong> debate whe<strong>the</strong>r large-scale fish<br />
processing/distribution enterprises would actually benefit <strong>the</strong> fishery sector – an increase in scale would lower unit<br />
distribution costs and might make it easier to improve product standards, but it would also cut into <strong>the</strong> widespread<br />
rural and urban employment opportunities afforded by this dynamic and highly accessible trade.<br />
These statements about <strong>the</strong> fish trade are based on contemporary personal observation and quantitative studies<br />
dating from <strong>the</strong> late 1980s (e.g. Seymour 1988, 1989), but <strong>the</strong> author is not aware <strong>of</strong> recent research that might<br />
substantiate <strong>the</strong>m. In view <strong>of</strong> <strong>the</strong> potential for increasing fish production from Lake Malawi, a high priority should<br />
be placed on investigations into <strong>the</strong> effective domestic and regional demand for fish products, consumer preferences<br />
and quality/price relationships, and <strong>the</strong> present and likely future impact <strong>of</strong> <strong>the</strong> September 2000 SADC trade
45<br />
Lake Malawi Fisheries Management Symposium - Proceedings<br />
agreement. Ultimately, <strong>the</strong> streng<strong>the</strong>ning <strong>of</strong> producer-trader linkages, <strong>the</strong> development <strong>of</strong> community-based<br />
organizations for business as well as <strong>management</strong> functions (producer associations) and <strong>the</strong> exploration <strong>of</strong> export<br />
markets might provide new points <strong>of</strong> departure for <strong>fisheries</strong> development.<br />
The fishermen<br />
A much more important determinant <strong>of</strong> past fishery performance, and a strong indicator <strong>of</strong> development potential, is<br />
<strong>the</strong> human resource base <strong>of</strong> <strong>the</strong> catching subsector. In Malawi <strong>the</strong> fishing industry is usually – and rightly – divided<br />
into three levels <strong>of</strong> operation. These are: artisanal (mostly small-scale commercial “traditional” <strong>fisheries</strong>, with some<br />
subsistence fishing), small-scale mechanised (pair trawlers and small stern trawlers) and large-scale mechanised<br />
(MALDECO). The three have quite different human resource characteristics.<br />
In 1999 <strong>the</strong> artisanal <strong>fisheries</strong> <strong>of</strong> Lakes Malawi and Malombe employed almost 40,000 fishermen, <strong>of</strong> which 21%<br />
were gear owners and <strong>the</strong> remainder crew (Weyl et al., 2000). Only a tiny proportion <strong>of</strong> <strong>the</strong> workforce has received<br />
any kind <strong>of</strong> formal training in fishing technology. From unsophisticated beginnings based on natural fibre gears and<br />
dugout canoes, <strong>the</strong> industry made substantial technical advances during <strong>the</strong> 1960s, when multifilament netting first<br />
became widely available, and <strong>the</strong> 1970s, when improved V-bottom planked boats became popular. During this<br />
period imported outboard motors were used in <strong>the</strong> more pr<strong>of</strong>itable – mostly chilimira – <strong>fisheries</strong>, and simple sail<br />
technology was copied from Mozambique in Likoma and Makanjira. For <strong>the</strong> past 25 years, however, very little in<br />
<strong>the</strong> way <strong>of</strong> new technology has been made available to <strong>the</strong> artisanal fishermen. Their poverty effectively isolates<br />
<strong>the</strong>m from technical progress in o<strong>the</strong>r countries, exposure to which might o<strong>the</strong>rwise be gained through travel, trade<br />
publications, exhibitions. One might have expected it to be <strong>the</strong> proper role <strong>of</strong> <strong>the</strong> Fisheries Department to keep <strong>the</strong><br />
industry abreast <strong>of</strong> worldwide technical advances, but <strong>the</strong> fact is that <strong>the</strong> government was almost as impoverished as<br />
<strong>the</strong> fishermen, and overseas training for Fisheries Department <strong>of</strong>ficials focused much more on <strong>the</strong> biology and<br />
<strong>management</strong> <strong>of</strong> fish stocks than on <strong>the</strong> mechanics <strong>of</strong> catching <strong>the</strong>m. Although shut <strong>of</strong>f from <strong>the</strong> outside world and<br />
modern fishing materials, <strong>the</strong>re is nothing to suggest that Malawi’s artisanal fishermen are any less competent or<br />
inventive than those elsewhere. A great diversity <strong>of</strong> fishing techniques has evolved, including floating longlines,<br />
bottom-set mon<strong>of</strong>ilament longlines, towed gillnets, pair-trawling with dugouts, artificial reefs and a variety <strong>of</strong> lightattraction<br />
methods, all using various recombinations <strong>of</strong> <strong>the</strong> very limited range <strong>of</strong> vessels and fishing materials<br />
available. When interviewed, fishermen <strong>of</strong>ten express frustration at <strong>the</strong>ir backwardness, and eagerness to experiment<br />
with new materials, fishing technologies and fishing craft.<br />
It is notable that within <strong>the</strong> artisanal <strong>fisheries</strong>, which produce an annual catch worth US$12-15 millions 1 , hardly any<br />
fishermen have become wealthy, and <strong>the</strong> largest enterprises amount only to a few small fishing units and perhaps a<br />
pickup truck. There is more to this than poor catch rates resulting from overfishing – <strong>the</strong>re is almost certainly a<br />
range <strong>of</strong> social and structural factors at play that contain <strong>the</strong> size <strong>of</strong> individual enterprises. The social and economic<br />
dynamics <strong>of</strong> fishing communities have not been studied in Malawi, but it is suggested that some <strong>of</strong> <strong>the</strong> following<br />
may be important:<br />
• <strong>the</strong> extended family system, in which personal responsibility increases in proportion to personal wealth,<br />
and which operates against a background <strong>of</strong> poverty and increasing dependency resulting from HIV/AIDS;<br />
• linked to <strong>the</strong> above, an inability on <strong>the</strong> part <strong>of</strong> artisanal fishermen to separate business finances from <strong>the</strong><br />
household economy, leaving business capital exposed to <strong>the</strong> needs <strong>of</strong> <strong>the</strong> extended family;<br />
• village-level social mechanisms that inhibit obvious personal success;<br />
• an inheritance system that more or less guarantees <strong>the</strong> dissolution <strong>of</strong> a business on <strong>the</strong> death <strong>of</strong> its founder,<br />
preventing inter-generational transfer <strong>of</strong> successful businesses;<br />
• <strong>the</strong> lack <strong>of</strong> rural banking services in <strong>lake</strong>shore areas;<br />
• high levels <strong>of</strong> violent crime that discourage cash-based business activity.<br />
Artisanal <strong>fisheries</strong> have never evolved to <strong>the</strong> point at which individual enterprises could amass sufficient wealth or<br />
confidence to achieve technical development by <strong>the</strong>mselves. By <strong>the</strong> same token, <strong>the</strong>y have had little opportunity to<br />
learn or practice <strong>the</strong> fundamentals <strong>of</strong> financial <strong>management</strong> ei<strong>the</strong>r. It is not <strong>the</strong>refore enough to provide new<br />
technologies and support services alone – until at least some artisanal fishing enterprises are assisted to break<br />
through <strong>the</strong> socio-economic barriers that prevent <strong>the</strong>ir growth, <strong>the</strong> vision <strong>of</strong> an upgraded <strong>of</strong>fshore artisanal fishery<br />
will remain unfulfilled.<br />
1 30,000 – 37,500 tonnes @ US$400/tonne.
46<br />
Lake Malawi Fisheries Management Symposium - Proceedings<br />
The next level up – <strong>the</strong> pair trawl fishery – was essentially a development creation, financed initially under <strong>the</strong><br />
FAO/UNDP Project for <strong>the</strong> Promotion <strong>of</strong> Integrated Fisheries Development (IFDP – 1972-76). The project<br />
identified demersal fish stocks in relatively shallow water that were not targeted by <strong>the</strong> artisanal <strong>fisheries</strong>, and<br />
designed appropriate vessels and gear to catch <strong>the</strong>m. The project went on to support <strong>the</strong> construction <strong>of</strong> Mpwepwe<br />
boatyard and <strong>the</strong> training <strong>of</strong> boatbuilders and fishing crews, and put in place a government-operated loan scheme to<br />
finance <strong>the</strong> new fishery. At <strong>the</strong> time it was held up as an example <strong>of</strong> best practice in <strong>fisheries</strong> development – a<br />
conclusion supported by early successes and rapid loan repayment. With few exceptions <strong>the</strong> pair trawler owners are<br />
not “graduated” artisanal fishermen, but are mostly pr<strong>of</strong>essionals, civil servants or businessmen who had sufficient<br />
personal credibility to attract <strong>the</strong> business loans (initially from government, later from <strong>the</strong> commercial banks) which<br />
<strong>the</strong>se enterprises needed for start-up. The trawler owners do not <strong>the</strong>mselves go fishing, but rely on hired crews<br />
which, although mostly paid on productivity-bonus systems, do not command <strong>the</strong> catch share normally paid to crew<br />
members. Some <strong>of</strong> <strong>the</strong>se businesses have paralleled very closely to <strong>the</strong> tobacco estates established by civil servants<br />
and politicians in <strong>the</strong> 1970s and 1980s, suffering from an extractive <strong>management</strong> style, a lack <strong>of</strong> creativity, minimal<br />
maintenance <strong>of</strong> equipment, a poorly-motivated workforce and almost no reinvestment. They differ from enterprises<br />
<strong>of</strong> similar size in <strong>the</strong> developed world in that businessmen, not fishermen, run <strong>the</strong>m. The only individuals within<br />
<strong>the</strong>se businesses that have <strong>the</strong> personal wealth and confidence to travel and acquire new ideas are not possessed <strong>of</strong><br />
<strong>the</strong> technical background to make use <strong>of</strong> <strong>the</strong>m. In consequence today’s pair trawl units are almost identical to <strong>the</strong><br />
blueprint drawn by <strong>the</strong> IFDP: <strong>the</strong>re has been no technical development within this fishery for almost thirty years.<br />
The current demise <strong>of</strong> <strong>the</strong> pair trawl fleet is a remarkable illustration <strong>of</strong> adherence to <strong>the</strong> blueprint all <strong>of</strong> <strong>the</strong> pair<br />
trawlers were originally fitted with Sabb diesel engines, for which <strong>the</strong> commercial agent in Malawi was <strong>the</strong> Fisheries<br />
Department. When government withdrew from engine and spare part supply in <strong>the</strong> early 1990s, none <strong>of</strong> <strong>the</strong> 15<br />
companies <strong>the</strong>n in operation changed over to engines with local dealer support. As a result, only those with external<br />
connections were able to import spare parts and stay in business: now only 5 companies remain active and mean<br />
annual landings have fallen from 3,000 tonnes to less than 1,000 tonnes (Figure 1). This should be viewed against a<br />
background <strong>of</strong> healthy stocks, a strong market and potentially high pr<strong>of</strong>itability. Where companies have tried to<br />
innovate – for instance in occasional forays into stern trawling – <strong>the</strong>se ventures have mostly failed for purely<br />
technical reasons. Sound technical advice to support <strong>the</strong>se brave attempts has simply not been available.<br />
Annual landings (tonnes) and effort (days)<br />
4,500<br />
4,000<br />
3,500<br />
3,000<br />
2,500<br />
2,000<br />
1,500<br />
1,000<br />
500<br />
0<br />
1976<br />
1978<br />
pair trawl effort<br />
pair trawl catch<br />
pair trawl cpue<br />
1980<br />
1982<br />
1984<br />
1986<br />
1988<br />
Figure 1. The decline <strong>of</strong> <strong>the</strong> pair trawl fishery, 1976-99<br />
The large-scale mechanised fishery – represented in Malawi only by MALDECO – operates on an entirely different<br />
plane and is to a large extent independent <strong>of</strong> external support systems. MALDECO started out in <strong>the</strong> 1950s as<br />
Yiannakis Fisheries Ltd., a private company set up by Greek fishermen skilled in ring netting and trawling. The<br />
1990<br />
1992<br />
1994<br />
1996<br />
1998<br />
1.80<br />
1.60<br />
1.40<br />
1.20<br />
1.00<br />
0.80<br />
0.60<br />
0.40<br />
0.20<br />
0.00<br />
Catch per unit effort (tonnes/day)
47<br />
Lake Malawi Fisheries Management Symposium - Proceedings<br />
company invested in vessels, chilled and frozen storage, ice production and mechanical workshops, and trained a<br />
large locally recruited workforce. It was confiscated by government in <strong>the</strong> early 1970s and operated for many years<br />
as part <strong>of</strong> <strong>the</strong> parastatal Malawi Development Corporation. Although it continued to perform well in public<br />
ownership its pr<strong>of</strong>its were diverted to subsidise less viable enterprises, and necessary reinvestment in capital<br />
equipment was discontinued. After a brief period under <strong>the</strong> <strong>management</strong> <strong>of</strong> ADMARC, ano<strong>the</strong>r parastatal, <strong>the</strong><br />
company was acquired in 1989 by its present owner, <strong>the</strong> Press Corporation, now a public company listed on <strong>the</strong><br />
Malawi Stock Exchange. In <strong>the</strong> 1990s <strong>the</strong> damage done by years <strong>of</strong> neglected investment was restored through a<br />
commercial loan financed (indirectly) by <strong>the</strong> Nordic Development Fund under <strong>the</strong> World Bank led Fisheries<br />
Development Project (1991-2000). The loan provided for <strong>the</strong> supply <strong>of</strong> a new 17m multi-purpose fishing vessel as<br />
well as a range <strong>of</strong> cold storage, ice-making and ancillary equipment. When <strong>the</strong> company last changed hands it was<br />
making a loss, but <strong>the</strong> impact <strong>of</strong> its new investments was quickly felt: a positive pre-tax pr<strong>of</strong>it was achieved in 1995<br />
and modest growth has been sustained since <strong>the</strong>n.<br />
Perhaps more significantly, outside <strong>of</strong> <strong>the</strong> project-led programme <strong>of</strong> capital development and technical assistance,<br />
<strong>the</strong> company began to make technical advances on its own initiative. In 1993-94 it imported two kapenta rigs from<br />
Zimbabwe and adapted <strong>the</strong>m to fish for usipa (Engraulicypris sardella), and in 2000 it acquired a pelagic trawler<br />
specifically to fish for Diplotaxodon and Rhamphochromis. Although small in <strong>the</strong>mselves <strong>the</strong>se are <strong>the</strong> first<br />
examples <strong>of</strong> a locally owned company importing technology from <strong>the</strong> international arena: <strong>the</strong>y are <strong>the</strong> start <strong>of</strong><br />
industry-led development.<br />
Support industries and services<br />
In order to function at all, fishing industries need a diverse range <strong>of</strong> subsidiary support trades and services, including<br />
boatbuilding and repair, gear supply, harbours and roads, ice and fuel. The current status <strong>of</strong> <strong>the</strong>se support trades and<br />
services in Malawi leaves a great deal to be desired:<br />
Fishing gear supply and technology development<br />
Multifilament nylon netting <strong>of</strong> indifferent quality is manufactured in Malawi by <strong>the</strong> Blantyre Netting Company Ltd.<br />
(BNC) on ra<strong>the</strong>r old Japanese machines from twine spun on site from imported yarn. In recent years this has not<br />
been a very pr<strong>of</strong>itable business, and <strong>the</strong>re has been some uncertainty as to whe<strong>the</strong>r BNC (whose main business is<br />
now <strong>the</strong> manufacture <strong>of</strong> polypropylene sacks) would continue it. BNC’s nets and twines are distributed through a<br />
limited network <strong>of</strong> company outlets on <strong>the</strong> <strong>lake</strong>shore, and a small range <strong>of</strong> products is also held by a number <strong>of</strong> retail<br />
shops. Annual domestic sales have fallen steadily from 80-100 tonnes in <strong>the</strong> 1980s to only 50 tonnes in 1999. This is<br />
a remarkable statistic given that <strong>the</strong> number <strong>of</strong> fishing craft has increased by 90% over <strong>the</strong> same period, although <strong>the</strong><br />
volume <strong>of</strong> illegal imports <strong>of</strong> sheet netting from Tanzania and Mozambique is not known. Around half <strong>of</strong> BNC’s<br />
annual sales are bulk twine from which fishermen braid <strong>the</strong>ir own nets: a sure measure <strong>of</strong> low returns from <strong>the</strong><br />
artisanal <strong>fisheries</strong>. BNC also manufactures split-film polypropylene ropes, and imported polyethylene ropes are<br />
available from many retailers.<br />
During <strong>the</strong> 1980s <strong>the</strong> Fisheries Department was a major retail distributor <strong>of</strong> BNC’s products, with most District<br />
Fisheries Offices holding a wide range <strong>of</strong> stock purchased through <strong>the</strong> (government-owned) Mpwepwe Boatyard<br />
Treasury Fund. The legality <strong>of</strong> this business was questionable, since <strong>the</strong> gear was purchased from BNC on a surtaxfree<br />
basis “for research purposes”, enabling <strong>the</strong> Department to retail at <strong>the</strong> BNC wholesale price and still retain a<br />
substantial pr<strong>of</strong>it. Although this pr<strong>of</strong>it was used to <strong>the</strong> industry’s benefit (by subsidising <strong>the</strong> price <strong>of</strong> fishing boats)<br />
<strong>the</strong>re can be no doubt that this was a somewhat shady enterprise, and was viewed as a block to private sector<br />
participation in fishing gear retailing. Not surprisingly, <strong>the</strong> World Bank made <strong>the</strong> termination <strong>of</strong> government’s<br />
involvement in gear sales a condition <strong>of</strong> <strong>the</strong> IDA Fisheries Development Project loan agreement signed in 1991. In<br />
practice, fishing gear retailing is a risky and unpr<strong>of</strong>itable business, and only really works if <strong>the</strong> margins are quite<br />
high (say, 50%). BNC’s recommended retail margin is 13%, and a pricing structure that has always been – to some<br />
extent – un<strong>of</strong>ficially enforced (and is now reinforced by BNC’s increased participation in <strong>the</strong> retail market) has<br />
always inhibited <strong>the</strong> fishing gear trade – that is why <strong>the</strong> Fisheries Department became involved in <strong>the</strong> first place.<br />
Distribution problems aside, <strong>the</strong> range <strong>of</strong> fishing gear available to <strong>the</strong> industry must be considered extremely<br />
limited, and has barely changed in 30 years: almost no new materials have been provided, or new technologies<br />
extended. The fact that <strong>the</strong> artisanal fishery has expanded in this inefficient form poses ano<strong>the</strong>r kind <strong>of</strong> development<br />
problem. If new materials – for instance, mon<strong>of</strong>ilament gill nets – were to be made instantly available at an<br />
affordable price, <strong>the</strong> impact on catching power would be dramatic, with potentially disastrous consequences for
48<br />
Lake Malawi Fisheries Management Symposium - Proceedings<br />
inshore stocks. Opening up Malawi’s <strong>fisheries</strong> to international influences will have to be managed extremely<br />
carefully if it is not to create more problems than it solves.<br />
Boatbuilding<br />
Dugout canoes are constructed by village canoe-builders around <strong>the</strong> shores <strong>of</strong> Lake Malawi. Although <strong>the</strong> number <strong>of</strong><br />
canoes operating in Lakes Malawi and Malombe has increased from 6,200 in 1985 to almost 9,000 in 1999, <strong>the</strong>ir<br />
size has progressively diminished with <strong>the</strong> increasing scarcity <strong>of</strong> large trees, and <strong>the</strong>ir mean lifespan has declined as<br />
<strong>the</strong> use <strong>of</strong> rot-prone exotic timbers has overtaken <strong>the</strong> use <strong>of</strong> indigenous hardwoods. Dugouts are inexpensive but<br />
wasteful <strong>of</strong> wood and, in <strong>the</strong>ir present form, unsuitable for work beyond <strong>the</strong> near-shore zone. In Botswana about half<br />
<strong>of</strong> <strong>the</strong> traditional Pterocarpus dugouts (mokoros) <strong>of</strong> <strong>the</strong> Okavango delta have been successfully replaced by GRP<br />
canoes <strong>of</strong> similar design. It took five prototypes before <strong>the</strong> GRP design was accepted by <strong>the</strong> Okavango fishermen,<br />
after which demand quickly outstripped supply. A first prototype GRP canoe has been tested in Malawi. It was not<br />
“right” but fishermen are willing to work with <strong>the</strong> designer to improve it. This may be a way at least to replicate <strong>the</strong><br />
large canoes <strong>of</strong> former years and extend fishing range at <strong>the</strong> lower end <strong>of</strong> <strong>the</strong> technology/cost spectrum.<br />
Village carpenters in Mangochi District have built flat-bottomed planked boats up to about 6m since at least <strong>the</strong><br />
early 1970s. These craft are unsuitable for open-water fishing, and have a disturbing tendency to fall apart in rough<br />
seas. Altoge<strong>the</strong>r more than 3,000 planked boats are currently in use on Lakes Malawi and Malombe, <strong>of</strong> which less<br />
than one fifth are powered by small outboards. A significant (but unknown) number <strong>of</strong> <strong>the</strong>se are strong V-bottom<br />
craft built by established boatyards at Salima and Mpwepwe.<br />
Salima Boatyard was established by a British boatbuilder as a private business in <strong>the</strong> early 1970s. The yard produced<br />
V-bottom planked boats to 6m for <strong>the</strong> artisanal <strong>fisheries</strong>, and a few carvel-planked round bilge sailing vessels. When<br />
<strong>the</strong> owner left Malawi in 1977 <strong>the</strong> Fisheries Department acquired <strong>the</strong> yard (in <strong>the</strong> absence <strong>of</strong> a private buyer) and<br />
over <strong>the</strong> next decade expanded and improved its production. These boats became very popular with fishermen, but<br />
production levels declined during <strong>the</strong> late 1980s to 20-30 per year, and <strong>the</strong> yard had a long backlog <strong>of</strong> orders.<br />
Although <strong>the</strong> sale price did not truly reflect production costs it is notable that fishermen purchased <strong>the</strong>se boats<br />
without <strong>the</strong> need for credit. Salima Boatyard was closed in 1993 in accordance with <strong>the</strong> conditions <strong>of</strong> <strong>the</strong> IDA loan<br />
that financed <strong>the</strong> Fisheries Development Project (1991-2000), but no attempt was made to privatise <strong>the</strong> yard. The<br />
skilled workforce was dismissed, and some months later <strong>the</strong> tools and equipment were auctioned to local joinery<br />
firms, while <strong>the</strong> Fisheries Department retained <strong>the</strong> site.<br />
Several former Salima boatyard employees continue to make boats to an acceptable standard and to <strong>the</strong> popular<br />
designs developed by <strong>the</strong> Fisheries Department. However, <strong>the</strong>y operate as small village businesses with very limited<br />
capital, and since <strong>the</strong>y are unable to access o<strong>the</strong>r than locally available materials <strong>the</strong>ir products have a short working<br />
life.<br />
Mpwepwe Boatyard, in Mangochi District, was a larger establishment whose main line <strong>of</strong> construction was a 7.5m<br />
V-bottom boat powered by a 30hp inboard diesel engine, <strong>the</strong> workhorse <strong>of</strong> <strong>the</strong> pair trawl fleet. By <strong>the</strong> late 1980s<br />
maintenance <strong>of</strong> <strong>the</strong> existing trawl fleet, plus vessels used in non-fishing roles, was estimated to require <strong>the</strong><br />
construction <strong>of</strong> six new vessels annually, as well as running repairs. But output had fallen to a very low level – one<br />
or two boats per year – and <strong>the</strong> yard was in debt and in urgent need <strong>of</strong> rehabilitation and new equipment. The<br />
redevelopment <strong>of</strong> Mpwepwe was <strong>the</strong>refore included as a priority sub-component <strong>of</strong> <strong>the</strong> Fisheries Development<br />
Project.<br />
At <strong>the</strong> time this project was prepared <strong>the</strong> prospects for privatisation appeared remote: it was <strong>the</strong>refore intended to<br />
rehabilitate <strong>the</strong> yard and to run it on lines as close to commercial as possible within <strong>the</strong> confines <strong>of</strong> government<br />
accounting and service limitations. Design studies were commissioned, and <strong>the</strong> boatyard staff reduced to a bare<br />
minimum in order to minimise losses during <strong>the</strong> reconstruction period. Stringency measures at this time included<br />
suspension <strong>of</strong> <strong>the</strong> import <strong>of</strong> marine engines and spare parts on which <strong>the</strong> pair trawlers depended. But by 1993<br />
several entrepreneurs had expressed interest in <strong>the</strong> acquisition <strong>of</strong> <strong>the</strong> boatyard. Privatisation appeared for <strong>the</strong> first<br />
time to be a real possibility, and <strong>the</strong> rehabilitation was deferred - it was considered more appropriate to make<br />
available to <strong>the</strong> new owner, on a loan basis, those funds which had been reserved for redevelopment. The<br />
privatisation <strong>of</strong> Mpwepwe took almost six years, and was not completed until May 1999. The option selected by <strong>the</strong><br />
Privatisation Commission was a <strong>management</strong> buy-out and <strong>the</strong> yard was sold to <strong>the</strong> Mpwepwe Boatyard Company<br />
Ltd., comprising <strong>of</strong> staff previously employed by <strong>the</strong> Fisheries Department. However, by <strong>the</strong> time <strong>the</strong> transfer <strong>of</strong><br />
ownership took place <strong>the</strong> yard was little more than a shell, its new owners inexperienced in business and potentially
49<br />
Lake Malawi Fisheries Management Symposium - Proceedings<br />
crippled by inherited debts. ICEIDA made a small grant available to buy minor tools, but <strong>the</strong>re was insufficient time<br />
to arrange <strong>the</strong> proposed subsidiary loan prior to project closedown. Even though <strong>the</strong> yard is now in private<br />
ownership <strong>the</strong> new company has no working capital, almost no stock <strong>of</strong> raw materials, and very possibly a large<br />
debt. It stands little prospect <strong>of</strong> growth – perhaps even survival – without swift external intervention.<br />
The reduced availability <strong>of</strong> seaworthy boats to <strong>the</strong> artisanal fishery (and here it is necessary to distinguish between<br />
V-bottom boats built by <strong>the</strong> Salima and Mpwepwe yards and inferior flat-bottomed craft made by untrained<br />
boatbuilders) has contributed to <strong>the</strong> concentration <strong>of</strong> fishing effort in <strong>the</strong> inshore zone, to increasing poverty in <strong>the</strong><br />
artisanal fishing communities and ultimately to <strong>the</strong> resource <strong>management</strong> problems which <strong>the</strong> Fisheries Department<br />
now has to face. The mechanised fishery has been more visibly affected. The pair trawl fleet was in a poor state<br />
when <strong>the</strong> project started, but after a decade without replacement engines or spare parts only 5 <strong>of</strong> <strong>the</strong> 15 units<br />
operational in 1990 remain in business today.<br />
Ice supply<br />
During <strong>the</strong> 1980s f<strong>lake</strong> ice was supplied to fish traders by <strong>the</strong> Fisheries Department, from ice plants at Namiasi,<br />
Salima and Nkhotakota, and by MALDECO. The Namiasi plant became unserviceable in <strong>the</strong> late 1980s and was not<br />
replaced because a private f<strong>lake</strong>-ice venture had opened in Mangochi. In 1993 <strong>the</strong> Salima fish handling depot (which<br />
provided fish washing and weighing facilities in addition to ice) was closed in accordance with <strong>the</strong> IDA loan<br />
conditions, and <strong>the</strong> machinery auctioned and later removed by <strong>the</strong> new owner to Blantyre. The small Fisheries<br />
Department ice plant at Nkhotakota was also taken out <strong>of</strong> service at this time.<br />
The current situation is that private plants at MALDECO and Mangochi continue to function, and a new enterprise<br />
produces small quantities <strong>of</strong> block ice at Salima. O<strong>the</strong>rwise, traders from Blantyre and Lilongwe purchase block ice<br />
from <strong>the</strong> Cold Storage Company Ltd. depots in those cities. A substantial – but unquantified – unsatisfied demand<br />
for ice is believed to exist.<br />
Harbours and roads<br />
Harbours are not used or currently needed in <strong>the</strong> artisanal <strong>fisheries</strong>, which use beach-landing boats and canoes.<br />
Similarly, beach access roads are not <strong>of</strong> great importance where <strong>the</strong> main means <strong>of</strong> transport between <strong>the</strong> beach and<br />
<strong>the</strong> nearest public transport route is <strong>the</strong> bicycle. Some major beach landings do attract vehicles, however, and<br />
anecdotal evidence suggests that landings are becoming increasingly aggregated, i.e. that increasing volumes <strong>of</strong> fish<br />
are being landed at a diminishing number <strong>of</strong> sites. This would point towards <strong>the</strong> need for road construction at<br />
carefully selected locations. The EU-funded Central Lake Fisheries Development Project (1980-85) constructed a<br />
number <strong>of</strong> beach access roads in Salima and Dedza Districts – <strong>the</strong>se had <strong>the</strong> strongly beneficial effect <strong>of</strong><br />
concentrating landings, processing and trading activity.<br />
Harbours are a great advantage to <strong>the</strong> pair trawl fleet, although with some ingenuity <strong>the</strong> boats may be operated from<br />
a simple beach site. The principal advantage <strong>of</strong> landing onto a jetty is that <strong>the</strong> catch may be discharged quickly, an<br />
important factor in reducing spoilage. The o<strong>the</strong>r main function <strong>of</strong> a harbour – shelter from rough <strong>lake</strong> conditions – is<br />
in practice very difficult to achieve in Malawi. There are few natural harbours, and medium-term variations in <strong>lake</strong><br />
level make investments in traditional permanent harbour facilities extremely risky. The Fisheries Department<br />
constructed trawler landings with jetties in Lifuwu, Salima; Malembo, in <strong>the</strong> South West Arm, and Namiasi, in <strong>the</strong><br />
South East Arm. Salima is no longer considered an inshore trawling ground, and <strong>the</strong> o<strong>the</strong>r two landings are in a very<br />
poor condition. Maldeco Fisheries Ltd. has constructed its own jetty and onshore infrastructure in Mangochi<br />
District.<br />
Development and how to achieve it<br />
Fisheries development is <strong>the</strong> growth and technical advancement <strong>of</strong> <strong>the</strong> fishery sector. Initially this process aims<br />
towards a condition in which all known fishing opportunities are fully exploited and <strong>the</strong> contribution <strong>of</strong> <strong>the</strong> fishing<br />
industry to <strong>the</strong> national economy maximised. Subsequent development tends towards greater catching efficiency and<br />
increased value-added through processing. In <strong>the</strong> more advanced fishing nations <strong>fisheries</strong> development is led by <strong>the</strong><br />
industry. Even in <strong>the</strong>se countries <strong>the</strong> government usually has a development role, and will undertake costly<br />
technological research and provide o<strong>the</strong>r services to <strong>the</strong> industry where <strong>the</strong>se are not attractive to <strong>the</strong> private sector<br />
(e.g. <strong>the</strong> construction <strong>of</strong> harbours). In developing countries <strong>the</strong> role <strong>of</strong> <strong>the</strong> state tends to be more prominent, and has<br />
<strong>of</strong>ten included <strong>the</strong> introduction <strong>of</strong> new capture and catch handling technologies and <strong>the</strong> mechanisation <strong>of</strong> artisanal<br />
<strong>fisheries</strong>. As we have seen, <strong>fisheries</strong> development in Malawi appears not to be occurring by itself, and this implies a<br />
major role for <strong>the</strong> government in bringing it about.
50<br />
Lake Malawi Fisheries Management Symposium - Proceedings<br />
Where development is to be promoted by government and financed by external donors, <strong>the</strong> approach, nature and<br />
extent <strong>of</strong> development programmes will be heavily influenced by prevailing development styles, which are subject<br />
to periodic change. Development thinking during <strong>the</strong> 1970s and 1980s appears now to have been decidedly<br />
paternalistic, and tended to ignore indigenous knowledge and capacity and impose alien technologies that quite <strong>of</strong>ten<br />
failed. Currently, <strong>the</strong> development philosophy <strong>of</strong> many donors and international lending institutions draws heavily<br />
on <strong>the</strong> principles <strong>of</strong> market economics. The state is encouraged to provide a liberal and enabling policy environment,<br />
within which <strong>the</strong> private sector is expected to provide productivity and growth. In <strong>the</strong> productive sectors <strong>the</strong> role <strong>of</strong><br />
<strong>the</strong> state is expected to shrink, shedding <strong>the</strong> more recognisable development functions and focusing on research,<br />
policy formulation and regulation. This new perspective quite properly accords more respect to <strong>the</strong> ability <strong>of</strong> <strong>the</strong><br />
target population, but it also makes a ra<strong>the</strong>r risky assumption – that its members will react and respond to new<br />
economic opportunities in <strong>the</strong> same way as <strong>the</strong>ir entrepreneur counterparts in <strong>the</strong> developed capitalist economies.<br />
There is ample evidence to show that in Malawi, and especially in <strong>the</strong> <strong>fisheries</strong> sector, this assumption is erroneous –<br />
<strong>the</strong> pendulum has swung too far. The private sector is small, and <strong>the</strong> relatively technology-intensive fishing industry<br />
and its associated trades have to compete with far more attractive business propositions, notably in crop trading and<br />
transport. There is no better demonstration <strong>of</strong> this than <strong>the</strong> enforced withdrawal <strong>of</strong> <strong>the</strong> Fisheries Department from<br />
<strong>the</strong> provision <strong>of</strong> industry support services in <strong>the</strong> early 1990s. Locally <strong>the</strong> disastrous results <strong>of</strong> this intervention are<br />
well known, and are documented in <strong>the</strong> Fisheries Development Project Implementation Completion Report (World<br />
Bank, 2000). But <strong>the</strong> government is now left in a quandary – should it go back to begin rebuilding <strong>the</strong> services that<br />
were dismantled, or should it be looking for some alternative means <strong>of</strong> promoting <strong>fisheries</strong> development?<br />
It is worth considering how <strong>the</strong> developed nations deal with <strong>the</strong> question <strong>of</strong> state support to fishing industries. It<br />
might be expected that, if it is in some sense inappropriate for <strong>the</strong> Government <strong>of</strong> Malawi to provide fishery<br />
services, <strong>the</strong>n <strong>the</strong>y must be entirely absent from those states with large, modern fishing fleets and advanced<br />
economies. But this is not <strong>the</strong> case. In almost all developed fishing nations <strong>the</strong> government invests in fishing<br />
harbours and associated infrastructure. In addition:<br />
In <strong>the</strong> states <strong>of</strong> <strong>the</strong> European Union (EU), grants are available to individual businesses for new or experimental<br />
fishing ventures and for fish processing facilities. All European states waive duty and taxes on fuel sold to <strong>the</strong><br />
fishing industry.<br />
• In <strong>the</strong> United Kingdom, many local government authorities operate ice plants and supply fuel to fishing<br />
vessels. The central government operates a decommissioning grant scheme to buy out excess fishing<br />
capacity from <strong>the</strong> industry.<br />
• The Republic <strong>of</strong> Ireland, which does not have an over-capacity problem, provides grants (<strong>of</strong> around 30%)<br />
towards <strong>the</strong> construction <strong>of</strong> new fishing craft. Here, central government operates a national network <strong>of</strong> ice<br />
plants, some <strong>of</strong> which are leased out to private operators. The government also provides grant support to<br />
exploratory fishing.<br />
• In <strong>the</strong> United States federal support to <strong>fisheries</strong> is provided through nearly thirty different grant and loan<br />
schemes providing for fleet renewal, fish processing, research and <strong>management</strong> (including buy-back and<br />
decommissioning). Many o<strong>the</strong>r regional and state-level support mechanisms complement <strong>the</strong> federal<br />
services.<br />
Malawi has been <strong>the</strong> subject <strong>of</strong> an experiment in economic purism that is not matched by practice in <strong>the</strong> outside<br />
world. Elsewhere, fishing industries tend to comprise a patchwork <strong>of</strong> private sector and state-led elements, and it is<br />
considered normal for governments to intervene in areas unattractive to <strong>the</strong> private sector and to use direct cash<br />
transfers and subsidies, both as instruments <strong>of</strong> development (fleet renewal, new technology) and <strong>management</strong><br />
(decommissioning and buy-back). Given <strong>the</strong> small size <strong>of</strong> Malawi’s private sector and <strong>the</strong> dominance <strong>of</strong> trade as a<br />
business activity, it would appear that <strong>the</strong> entry <strong>of</strong> entrepreneurs into <strong>fisheries</strong> ancillary trades will be extremely<br />
slow. The government is now faced, <strong>the</strong>refore, with <strong>the</strong> need to rebuild and expand upon its former services network<br />
if <strong>the</strong> production opportunities so clearly identified are to be exploited within <strong>the</strong> foreseeable future. This process <strong>of</strong><br />
reconstruction may be a painful one, but it will afford <strong>the</strong> opportunity to plan a development strategy with more<br />
thoroughness than has previously been <strong>the</strong> case. It is suggested that <strong>the</strong> strategy should be based on three essential<br />
<strong>the</strong>mes – technology development, industrial development and fishery services:
51<br />
Lake Malawi Fisheries Management Symposium - Proceedings<br />
Technology development<br />
Of <strong>the</strong> eight fishing opportunities listed in <strong>the</strong> second part <strong>of</strong> this paper, three require <strong>the</strong> development and<br />
evaluation <strong>of</strong> new technologies (artisanal <strong>fisheries</strong> for small demersal cichlids, both deep and shallow, and artisanal<br />
<strong>fisheries</strong> for <strong>of</strong>fshore pelagics) and two require <strong>the</strong> improvement <strong>of</strong> fishing methods already in use (pair trawling,<br />
pelagic trawling). Tasks <strong>of</strong> this kind have always been seen as a proper function <strong>of</strong> government, and it is to be<br />
expected that <strong>the</strong> Fisheries Department would commission <strong>the</strong> necessary work through an externally financed<br />
technical assistance programme.<br />
Industrial development<br />
This term is used in order to encourage a perception <strong>of</strong> <strong>the</strong> fishing industry as something much more than a<br />
collection <strong>of</strong> individuals who fish for a living, or technologies that impact on resources. It will be necessary to learn<br />
much more than we now know about <strong>the</strong> workforce, about financial and information flows and about business<br />
strategies and how <strong>the</strong>y may be supported to encourage sustained growth. Three targets for action are:<br />
• Breaking <strong>the</strong> barriers to growth. The first requirement here is to clarify through appropriate studies exactly<br />
what are <strong>the</strong> constraints to enterprise growth, particularly in <strong>the</strong> artisanal <strong>fisheries</strong>. If, as has been suggested<br />
here, <strong>the</strong>y are linked to an inability to isolate business finances from <strong>the</strong> demands <strong>of</strong> <strong>the</strong> extended family,<br />
<strong>the</strong>n a carefully administered savings and loan scheme might provide a way forward. Whatever <strong>the</strong><br />
determined constraint or proposed solution, it should not be expected that more than a minority will be<br />
ready or able to make <strong>the</strong> necessary changes in <strong>the</strong> short term. For some purposes it may be necessary to<br />
work selectively with <strong>the</strong> most progressive elements <strong>of</strong> fishing communities, however much this may go<br />
against egalitarian principles.<br />
• Improving <strong>the</strong> structure <strong>of</strong> <strong>the</strong> industry. The most expensive artisanal fishing unit – an outboard-powered<br />
chilimira unit – requires a capital outlay <strong>of</strong> around US$5,000. A pair trawl unit, plus second-hand pickup<br />
truck and ancillary equipment, costs US$45-50,000. A hypo<strong>the</strong>tical large-scale fishing venture, based on a<br />
single 17m trawler plus necessary onshore infrastructure, would require an investment <strong>of</strong> US$1 million<br />
upwards. The gaps between <strong>the</strong>se levels <strong>of</strong> investment (an order <strong>of</strong> magnitude or more) are so large that no<br />
individual can aspire to <strong>the</strong> level above without massive outside assistance. When exploring new<br />
technologies to harvest underexploited resources in Lake Malawi, thought should be given to creating<br />
business niches at scales intermediate to <strong>the</strong> existing three levels, so as to make graduation from one level<br />
to <strong>the</strong> next easier to achieve. For <strong>the</strong> same reason, it is also essential to reverse <strong>the</strong> recent decline in <strong>the</strong> pair<br />
trawl fishery.<br />
• Management <strong>of</strong> information. It is necessary to promote an inflow <strong>of</strong> information on fishing and fish<br />
handling technology from international sources, and to ensure that such information is (a) delivered<br />
effectively to <strong>the</strong> fishing industry, and (b) is matched by <strong>the</strong> availability <strong>of</strong> materials and services where it<br />
results in local demand. Although gear technologists may be recruited through a project-type technical<br />
assistance programme, <strong>the</strong> best source <strong>of</strong> expertise is successful fishermen from o<strong>the</strong>r countries. These are<br />
both difficult and expensive to recruit, for obvious reasons. Three different routes to linking Malawian with<br />
successful foreign fishermen might be feasible: (a) creating an advisory unit staffed by volunteers who are<br />
recently retired and carefully selected fishermen; (b) seconding small numbers <strong>of</strong> Malawian fishermen to<br />
appropriate fishing businesses overseas, and (c) – although this is not without risk – establishing one or<br />
more joint venture fishing operations.<br />
Fishery services<br />
The following service and ancillary trades are legitimate targets for government support or direct intervention,<br />
remembering always that private sector participation in <strong>the</strong>se activities will be retained as a development goal:<br />
• Fishing gear supply. BNC should not be exposed to competition from government, but it may be useful for<br />
<strong>the</strong> government to encourage BNC or ano<strong>the</strong>r supplier (by underwriting <strong>the</strong> commercial risk involved) to<br />
import technically desirable but non-traditional fishing materials. Renewed investigation <strong>of</strong> price structures<br />
might result in recommendations that would increase <strong>the</strong> attractiveness <strong>of</strong> fishing gear retailing and enable<br />
BNC to focus on production/import.<br />
• Boatbuilding. Every effort should be made to support <strong>the</strong> Mpwepwe Boatyard. But boatbuilding capacity<br />
needs to expand faster than Mpwepwe will be able to, even under <strong>the</strong> most favourable circumstances.<br />
Development options could include a design development project, pump-priming operations to support <strong>the</strong>
52<br />
Lake Malawi Fisheries Management Symposium - Proceedings<br />
construction <strong>of</strong> steel boats by existing general fabrication companies, an Okavango-style GRP canoe<br />
experiment, and/or ano<strong>the</strong>r government boatyard in <strong>the</strong> Central or Nor<strong>the</strong>rn Region.<br />
• Ice supply. It is highly desirable to increase <strong>the</strong> availability <strong>of</strong> ice through a planned network <strong>of</strong> ice<br />
production and sales points that takes into account possible changes in <strong>the</strong> distribution <strong>of</strong> fish landings. The<br />
network could be designed and installed by <strong>the</strong> Fisheries Department but ultimately handed over to District<br />
Assemblies, and <strong>the</strong> possibility <strong>of</strong> leasing ice-making facilities to entrepreneurs might be a useful first step<br />
towards ultimate privatisation. The availability <strong>of</strong> ice may be essential to achieving <strong>the</strong> full financial<br />
potential <strong>of</strong> proposed <strong>of</strong>fshore <strong>fisheries</strong>.<br />
• Fisheries infrastructure. Existing trawler landings at Malembo and Namiasi should be rebuilt, and <strong>the</strong> need<br />
for additional sites investigated. This might include public investment in onshore infrastructure to support<br />
mechanised deep-water or pelagic operations in <strong>the</strong> centre or north <strong>of</strong> Lake Malawi. The need for access<br />
roads to major artisanal landings should be investigated with a view to proposing construction projects to<br />
<strong>the</strong> Malawi Social Action Fund.<br />
• Information and advisory services. The use <strong>of</strong> experienced volunteers has been discussed above. It may be<br />
feasible to reserve (development) funds to pay for specialist technical and financial advisory services as<br />
required by <strong>the</strong> growing mechanised <strong>fisheries</strong> – what must be avoided at all costs is <strong>the</strong> wasting <strong>of</strong> hardwon<br />
investment capital through bad technical decisions.<br />
• Financial services. This is a sensitive but important subject that deserves focused attention. The<br />
government may wish to support or encourage particular types <strong>of</strong> fishing enterprise by making available<br />
grants or subsidised loans. This would not risk distorting Malawi’s financial services sector, since <strong>the</strong><br />
commercial banks have made no investments in <strong>the</strong> fishing industry for some years; even so, business<br />
development grants may be <strong>the</strong> preferred option. It should be noted that <strong>the</strong> high local currency interest<br />
rates for commercial borrowing look less frightening when viewed in hard currency terms: <strong>the</strong><br />
identification <strong>of</strong> export markets for some part <strong>of</strong> <strong>the</strong> catch would make commercial borrowing an easier pill<br />
to swallow. The government may also wish to make grant funding available for <strong>management</strong> purposes, for<br />
instance for fishing gear buy-back schemes.<br />
Development, <strong>management</strong> and risk<br />
Fisheries <strong>management</strong> is <strong>the</strong> control <strong>of</strong> fishing industries – usually by governments or, in <strong>the</strong> case <strong>of</strong> shared stocks,<br />
by an agency representing more than one government – with <strong>the</strong> primary objective <strong>of</strong> ensuring that harvesting<br />
remains within biological limits and that <strong>the</strong> sustainability <strong>of</strong> <strong>the</strong> resource base is maintained. In practice,<br />
<strong>management</strong> objectives are usually more sophisticated than simply maximising sustainable yields, and it is normal<br />
to aim for maximum economic return, or maximum employment, or some combination <strong>of</strong> <strong>the</strong> two. Development and<br />
<strong>management</strong> tend to work in opposite directions, one promoting and <strong>the</strong> o<strong>the</strong>r restraining, but <strong>the</strong>y are not opposites:<br />
a highly managed fishery is not <strong>the</strong> same as an undeveloped fishery. The most advanced <strong>fisheries</strong> combine a high<br />
level <strong>of</strong> technical development with an intensive <strong>management</strong> regime. Worldwide, as fish resources have come<br />
under increasing pressure and new fishing opportunities have become increasingly scarce, <strong>the</strong> emphasis has shifted<br />
from <strong>fisheries</strong> development to <strong>fisheries</strong> <strong>management</strong>. There is a simple principle here: <strong>the</strong> more developed <strong>the</strong><br />
fishery, <strong>the</strong> higher <strong>the</strong> risk <strong>of</strong> resource collapse through over-exploitation and hence <strong>the</strong> more important <strong>the</strong> pr<strong>of</strong>ile<br />
and effectiveness <strong>of</strong> <strong>fisheries</strong> <strong>management</strong>.<br />
In Malawi <strong>the</strong>re has been more than one instance <strong>of</strong> “managing by not developing”, i.e. deferring development<br />
because it was feared that government capacity would be insufficient to manage <strong>the</strong> resulting increase in fishing<br />
power. This has applied for many years to <strong>the</strong> reluctance to exposing artisanal fishermen to mon<strong>of</strong>ilament gill nets,<br />
and it was also used as <strong>the</strong> rationale for postponing investments in <strong>the</strong> pair trawl fleet during <strong>the</strong> course <strong>of</strong> <strong>the</strong> recent<br />
IDA-funded Fisheries Development Project. Lack <strong>of</strong> <strong>management</strong> capacity may <strong>the</strong>refore be a fur<strong>the</strong>r and unwanted<br />
brake on <strong>the</strong> pace <strong>of</strong> <strong>fisheries</strong> development.<br />
Participatory Fisheries Management<br />
To a large extent fish are resources <strong>of</strong> an open-access nature, regardless <strong>of</strong> <strong>management</strong> or resource tenure regime.<br />
This is due to <strong>the</strong> sometimes-extreme mobility <strong>of</strong> fish populations, so that resource tenure can never be pinned down<br />
to <strong>the</strong> extent possible with land or trees. Even in situations <strong>of</strong> closed entry, each fisherman is aware that personal<br />
restraint means personal disadvantage, however much it may benefit <strong>the</strong> fishery. For this reason <strong>fisheries</strong> are always
53<br />
Lake Malawi Fisheries Management Symposium - Proceedings<br />
difficult to manage, and successful <strong>management</strong> regimes are few. Malawi’s approach to inshore artisanal fishery<br />
<strong>management</strong> is to maximise local ownership by transferring use rights and control <strong>of</strong> access to local <strong>fisheries</strong><br />
institutions, on <strong>the</strong> basis <strong>of</strong> mutually agreed <strong>management</strong> plans. There are two reasons for believing this is <strong>the</strong> right<br />
course <strong>of</strong> action:<br />
• It would appear that a majority <strong>of</strong> artisanal fishermen support <strong>the</strong> principle <strong>of</strong> co-<strong>management</strong>, even in<br />
areas where <strong>the</strong>re has been limited extension and no training. The publicity emanating from <strong>the</strong> former<br />
Malawi-German Fisheries and Aquaculture (MAGFAD) Project (now <strong>the</strong> National Aquatic Resources<br />
Management Project) has caught <strong>the</strong> imaginations <strong>of</strong> fishing communities from all corners <strong>of</strong> Malawi, and<br />
demand for extension support now outstrips system capacity.<br />
• Early indications are that inshore demersal stocks may be highly genetically differentiated (Duponchelle<br />
and Ribbink, 2000), suggesting that physical movements are restricted and that local-level <strong>fisheries</strong><br />
<strong>management</strong> in Lake Malawi may have a biological validity previously unsuspected. Genetic research into<br />
demersal stocks is currently very limited, and fur<strong>the</strong>r studies should be framed with <strong>the</strong> objective <strong>of</strong><br />
identifying unit stocks for <strong>the</strong> main commercial species groups.<br />
There is however an attendant risk, and that is that over <strong>the</strong> short to medium term a lack <strong>of</strong> tangible improvements in<br />
fishery production and incomes could bring about a reaction or backlash against <strong>the</strong> new <strong>management</strong> regime. Part<br />
<strong>of</strong> <strong>the</strong> problem is that in <strong>the</strong>ir eagerness to improve <strong>the</strong>ir lot (and <strong>the</strong> status <strong>of</strong> <strong>the</strong>ir fish resources), some<br />
communities are inflicting considerable hardship on <strong>the</strong>mselves by <strong>the</strong> imposition <strong>of</strong> extremely strict <strong>management</strong><br />
regimes. These communities are unlikely to be able to maintain <strong>the</strong>ir commitment to co-<strong>management</strong> unless <strong>the</strong>ir<br />
personal sacrifices result in a swift improvement in incomes – an outcome that, given <strong>the</strong> nature <strong>of</strong> environmental<br />
<strong>management</strong>, is unlikely. A second part <strong>of</strong> <strong>the</strong> problem, and one that compounds <strong>the</strong> first, is that until new entry into<br />
<strong>the</strong> fishery is controlled, expansion <strong>of</strong> fishing effort will simply mop up all <strong>the</strong> benefits that would have accrued as a<br />
result <strong>of</strong> active co-<strong>management</strong>.<br />
There may be potential to take co-<strong>management</strong> into some constructive new directions. Until now it has been seen as<br />
a mechanism for implementing more or less traditional fishery <strong>management</strong> measures – mesh size restrictions, close<br />
seasons, etc. But it may be possible for <strong>the</strong> Fisheries Department to work with local fishery managers to develop a<br />
<strong>management</strong> vision that takes into account <strong>the</strong> wider impacts <strong>of</strong> fishing on near-shore ecology. Future <strong>management</strong><br />
prescriptions might include closed or restricted-fishery areas, <strong>the</strong> phasing-out or reduction <strong>of</strong> harmful gears (possibly<br />
with grant support) and <strong>the</strong> closure <strong>of</strong> <strong>fisheries</strong> to new entrants.<br />
New <strong>fisheries</strong> and <strong>the</strong> <strong>management</strong> <strong>of</strong> interactions<br />
Development <strong>of</strong> <strong>the</strong> fishing industry will need to contend with two opposing forces. The opportunities for<br />
incremental production lie mostly <strong>of</strong>fshore and in deeper waters. Yet <strong>the</strong> intrinsic productivity <strong>of</strong> Lake Malawi and<br />
<strong>the</strong> unit value <strong>of</strong> <strong>the</strong> catch both increase inshore, and in shallower waters. There will <strong>the</strong>refore be a general pr<strong>of</strong>itdriven<br />
pressure shorewards, which must be strongly resisted in order to avoid damage to inshore resources and <strong>the</strong><br />
existing <strong>fisheries</strong> that depend upon <strong>the</strong>m. This is most obvious in <strong>the</strong> case <strong>of</strong> large-scale mechanised fishing, where<br />
<strong>the</strong> towing power needed for deep demersal or pelagic trawling could be devastating in <strong>the</strong> shallows, but it applies<br />
equally to <strong>the</strong> artisanal <strong>fisheries</strong>. Larger boats and better gear are not desirable if <strong>the</strong>y are used to fish <strong>the</strong> same<br />
stocks that are already under intense pressure.<br />
The tendency to “creep inshore” has already been clearly seen in <strong>the</strong> pair trawl fishery, but although <strong>the</strong> legal<br />
mechanisms to control <strong>the</strong> deployment <strong>of</strong> <strong>the</strong> trawlers are entirely adequate <strong>the</strong> government’s record in this regard is<br />
conspicuously weak. It is important to note that in this case one cannot count on harnessing <strong>the</strong> power <strong>of</strong> resource<br />
ownership to drive self-regulation by <strong>the</strong> mechanised <strong>fisheries</strong> – because <strong>the</strong> <strong>of</strong>fence in question is poaching on<br />
someone else’s territory. It is pointless blaming <strong>the</strong> fishermen for this, because no fisherman anywhere would pass<br />
up <strong>the</strong> chance <strong>of</strong> a little extra illicit income if <strong>the</strong> prospects for retribution are low. If <strong>the</strong> mechanised <strong>fisheries</strong> are to<br />
be developed, <strong>the</strong>n law enforcement capacity must be developed simultaneously and as part <strong>of</strong> <strong>the</strong> same package.<br />
References<br />
Banda, M.C. & Tómasson, T. 1996. Survey <strong>of</strong> trawling grounds and demersal fish stocks in central Lake Malawi, from Domira<br />
Bay to Nkhata Bay in 1994 and 1995. Fisheries Bulletin No. 33. Fisheries Department, Lilongwe.<br />
Banda, M.C. & Tómasson, T. 1997. Demersal fish stocks in sou<strong>the</strong>rn Lake Malawi: stock assessment and exploitation.<br />
Fisheries Bulletin No. 35. Fisheries Department, Lilongwe.
54<br />
Lake Malawi Fisheries Management Symposium - Proceedings<br />
Duponchelle, F. & Ribbink, A.J. (eds), 2000. Fish Ecology Report. Lake Malawi/Nyasa/Niassa Biodiversity Conservation<br />
Project. SADC/GEF.<br />
Fisheries Department. 1999. Fish Stocks and Fisheries <strong>of</strong> Malawian Waters. Resource Report 1999. Fisheries Research Unit,<br />
Monkey Bay.<br />
Government <strong>of</strong> Malawi. 2000. National Fisheries and Aquaculture Policy. Fisheries Department, Lilongwe.<br />
Menz, A. & Thompson, A.B. 1995. Management Report <strong>of</strong> <strong>the</strong> UK/SADC Pelagic Fish Resource Assessment Project (Lake<br />
Malawi/Niassa).<br />
Seymour, A.G. 1988. Likoma and Chizumulu Islands: production, processing and trading in <strong>the</strong> chilimira fishery. Fisheries<br />
Department/GTZ Rural Growth Centres Project.<br />
Seymour, A.G. 1989. Women’s fish processing and trading groups at Makanjira Rural Growth Centre: report on a short field<br />
visit 31/01/89 to 03/02/89. Working paper: Project for <strong>the</strong> Promotion <strong>of</strong> Women at <strong>the</strong> Rural Growth Centres. Office <strong>of</strong><br />
<strong>the</strong> President and Cabinet/GTZ Malawi.<br />
Tweddle, D. 1981. A preliminary assessment <strong>of</strong> <strong>the</strong> bottom-trawling potential <strong>of</strong> nor<strong>the</strong>rn Lake Malawi. Luso: J. Sci. Technol.<br />
Malawi, 2(2):3-13.<br />
Turner, G.F., Carvalho, G.R., Robinson, R.L. & Shaw, P.W. 2000. Ncheni Project: Final Report. Biodiversity Conservation and<br />
Sustainable Utilisation <strong>of</strong> Pelagic Cichlid Fishes <strong>of</strong> Lake Malawi/Niassa/Nyasa. DfID Project R6414, ERP 49.<br />
Weyl, O.L.F., Banda, M., Sodzapanja, G., Mwenekibombwe, L.H., Mponda, O.C. & Namoto, W. 2000: Annual Frame Survey<br />
September 1999. Fisheries Bulletin No. 42, Department <strong>of</strong> Fisheries, Lilongwe.<br />
World Bank. 2000. Implementation Completion Report on an IDA Credit in <strong>the</strong> Amount <strong>of</strong> USD 8 million to <strong>the</strong> Republic <strong>of</strong><br />
Malawi for a Fisheries Development Project (Credit No. 22250-MAI), December 29, 2000. Report No.: 21560, Rural<br />
Development Operations, Eastern and Sou<strong>the</strong>rn Africa, World Bank.
55<br />
Lake Malawi Fisheries Management Symposium - Proceedings<br />
Seeking Sustainability: Streng<strong>the</strong>ning Stakeholder Involvement in Fisheries<br />
Management in Malawi<br />
Tracy A. Dobson & Aaron J. M. Russell<br />
Department <strong>of</strong> Fisheries & Wildlife, Michigan State University, 13 Natural Resources Building, East Lansing, MI 48824-1222, Tel:<br />
517/432-1711, Fax: 517/432-1699, E-mail: dobson@msu.edu<br />
Abstract<br />
In response to declining fish stocks in Malawi’s waters, <strong>the</strong> government and a foreign aid donor collaborated to create a new<br />
<strong>fisheries</strong> <strong>management</strong> approach. A co-<strong>management</strong> regime was introduced in a pilot program at Lake Malombe at <strong>the</strong> sou<strong>the</strong>rn tip<br />
<strong>of</strong> Lake Malawi. Fishers elected “beach village committees” (BVCs) to work with Fisheries Department (FD) staff in several phases<br />
<strong>of</strong> <strong>management</strong>. Reviews <strong>of</strong> <strong>the</strong> program to date are mixed. BVCs are working with <strong>the</strong> FD but have unmet fishing needs.<br />
Expansion <strong>of</strong> co-<strong>management</strong> to Lake Malawi has been initiated and is reported to be progressing slowly. The co-<strong>management</strong><br />
approach is being more widely employed as greater demands are placed on scarce government resources everywhere and <strong>the</strong><br />
value <strong>of</strong> stakeholder involvement is recognized. Using insights from international <strong>fisheries</strong> co-<strong>management</strong> programs, suggestions<br />
for improving <strong>the</strong> successes <strong>of</strong> Malawian co-<strong>management</strong> programs are <strong>of</strong>fered.<br />
Key words: Fisheries co-<strong>management</strong>; community-based natural resources <strong>management</strong><br />
Introduction<br />
A significant reduction in near-shore catch in recent years in Malawi has led to <strong>the</strong> employment <strong>of</strong> a new approach<br />
to <strong>fisheries</strong> <strong>management</strong>. In this paper, based on <strong>the</strong> most recent available data, we describe <strong>the</strong> fishery and<br />
<strong>management</strong> historically and currently. In particular, we lay out <strong>the</strong> new <strong>management</strong> approach and assess its<br />
successes and failures to date as well as speculate on its future prospects for enhancing fishery <strong>management</strong>.<br />
Malawi is a small country situated in Sou<strong>the</strong>astern Africa along <strong>the</strong> African rift. At 119,000 km 2 it is similar in size<br />
to <strong>the</strong> State <strong>of</strong> Indiana. Most <strong>of</strong> <strong>the</strong> human population is concentrated in <strong>the</strong> sou<strong>the</strong>rn and central regions (National<br />
Statistical Office 1999) where <strong>the</strong> best fishing and most suitable agricultural land are located. While 90 percent <strong>of</strong><br />
Malawi’s citizens are engaged in agriculture (primarily subsistence), fishing and associated activities are a<br />
significant part <strong>of</strong> <strong>the</strong> economy. Fish provide an estimated 70 percent <strong>of</strong> dietary animal protein (National website<br />
2000, Bland and Donda 1995).<br />
Historically, five water bodies have been <strong>the</strong> major producers <strong>of</strong> fish: <strong>the</strong> Shire River and Lakes Chiuta, Chilwa,<br />
Malombe, and Malawi (See Figure 1). By far <strong>the</strong> largest and biggest producer <strong>of</strong> fish is Lake Malawi, a rift valley<br />
<strong>lake</strong> which yields 40 to 60 percent <strong>of</strong> <strong>the</strong> country’s annual catch (State <strong>of</strong> <strong>the</strong> Environment Report 1998). It is <strong>the</strong><br />
third largest <strong>lake</strong> in Africa, taking up approximately 20 percent <strong>of</strong> <strong>the</strong> country’s geographical area (27,000 km 2 ).<br />
Moreover, it is believed to be <strong>the</strong> world’s most diverse <strong>lake</strong> in terms <strong>of</strong> fish species. It is estimated that as many as<br />
1,000 species exist <strong>the</strong>re, most <strong>of</strong> which have not yet been described (National Environmental Action Plan 1994).<br />
The majority <strong>of</strong> species are believed to fall within <strong>the</strong> cichlid family, o<strong>the</strong>rs species are also significant in <strong>the</strong><br />
fishery. The main target species <strong>of</strong> <strong>the</strong> fishery include chambo (Oreochromis spp.), mpasa (Opsaridium<br />
microlepsis), utaka (Copadichromis), usipa (Engraulicyprius sardella), and kampango (Bagrus meridionalis).<br />
According to McCracken (1987), small scale fishing has a long history in Malawi. Traditional practices were left<br />
largely undisturbed by <strong>the</strong> British colonial regime that focused its attention on agriculture. Working from shore and<br />
dugout canoes, fishers used seine nets and gill nets to harvest a variety <strong>of</strong> species, including chambo, utaka,<br />
matemba and usipa. Recent estimates gauge total fishing industry participation at more than 230,000 persons<br />
(National website 2000, Bland and Donda 1994, Ferguson et al.1993), including boat owners, crew members, fish<br />
processors, and fish traders. The fisher component stands at approximately 40,000 (Bland and Donda 1995).<br />
Because <strong>of</strong> relatively easy entry to <strong>the</strong> fishery, as o<strong>the</strong>r fields <strong>of</strong> subsistence activity have been reduced or<br />
eliminated, and as <strong>the</strong> population has grown, a substantial increase in <strong>the</strong> number <strong>of</strong> participants has occurred (Bland<br />
and Donda 1995), causing greater fishing pressure, providing in part <strong>the</strong> impetus for a new <strong>management</strong> approach.
N<br />
Z A M B I A<br />
Z I M B A B W E<br />
Harare<br />
M A L A W I<br />
Figure 1. Malawi and its Water Bodies<br />
Lilongwe<br />
Lake Malawi<br />
Lake<br />
Malombe<br />
Blantyre<br />
0<br />
0<br />
T A N Z A N I A<br />
Lake Chiuta<br />
Lake Chilwa<br />
M O Z A M B I Q U E<br />
Figure 1. Malawi and its water bodies<br />
150 km<br />
100 mi<br />
56<br />
Lake Malawi Fisheries Management Symposium - Proceedings<br />
Historical approach to fishing regulation<br />
To understand <strong>the</strong> current situation a brief description <strong>of</strong> <strong>the</strong> historical context will be useful. According to Munthali<br />
(1994), territorial use rights, taboos and magic were employed to allocate and maintain <strong>the</strong> <strong>fisheries</strong> prior to <strong>the</strong><br />
colonial era. Persons desiring to fish needed to secure permission from a chief or village headman to fish from a<br />
particular beach. Control by traditional authorities over <strong>the</strong> number <strong>of</strong> fishers provided protection against<br />
overfishing as well as greater equity in access in <strong>the</strong> view <strong>of</strong> Munthali (1994). Taboos making certain species<br />
inappropriate for human consumption in addition to taboos regarding inappropriate times to fish formed parts <strong>of</strong> an<br />
arrangement that protected <strong>the</strong> stocks (Munthali 1994). In addition to <strong>the</strong> reduced impact on <strong>the</strong> fishery due to <strong>the</strong><br />
smaller populations dependent on fishing, traditional fishing methods (primarily handmade nets deployed ei<strong>the</strong>r<br />
from shore or dugout canoes) are believed to have allowed a sustainable exploitation <strong>of</strong> <strong>the</strong> <strong>fisheries</strong> due to <strong>the</strong>ir<br />
relative inefficiency.<br />
The British colonial regime <strong>of</strong> <strong>the</strong> late 1800s and early 1900s focused its attention on agriculture as <strong>the</strong> most<br />
important area <strong>of</strong> economic activity (primarily tea, c<strong>of</strong>fee and tobacco estate farming), leaving fishing to <strong>the</strong> locals<br />
for <strong>the</strong> most part (McCracken 1987). Most fish were consumed within <strong>the</strong> fisher’s household, but a significant<br />
indigenous commercial fishery serving local and regional indigenous markets was noted by Livingstone as early as<br />
1861 (McCracken 1987).<br />
European commercial competition was initiated in <strong>the</strong> 1930s. Fears that <strong>the</strong> use <strong>of</strong> European gear would dominate<br />
and significantly reduce <strong>the</strong> fishery through <strong>the</strong>ir higher efficiency caused <strong>the</strong> colonials to require non-Africans to<br />
obtain permits in <strong>the</strong> late 1930s. In 1949, a drought and fears <strong>of</strong> famine led to <strong>the</strong> imposition <strong>of</strong> a fish export ban<br />
and price controls. Never<strong>the</strong>less, by <strong>the</strong> 1950s, McCracken (1987) reports that a small number <strong>of</strong> Africans had<br />
developed substantial commercial fishing operations. Fishing rules adopted in 1974 and 1977 sought to limit fishing
57<br />
Lake Malawi Fisheries Management Symposium - Proceedings<br />
pressure (and raise funds) through <strong>the</strong> requirement <strong>of</strong> commercial licenses, gear restrictions and closed seasons<br />
(McCracken 1987). In <strong>the</strong> 1990s, a government parastatal organization, MALDECO, and one private company were<br />
engaged in commercial fishing, and 22 pair-trawl units engage in semi-commercial activity (Alimoso 1994, Derman<br />
et al.1994). The commercial and semi-commercial sectors bring in approximately ten percent <strong>of</strong> <strong>the</strong> catch (Bland<br />
and Donda 1995).<br />
Over time <strong>the</strong> influences <strong>of</strong> western economic and religious ideologies have had <strong>the</strong>ir impacts on <strong>the</strong> “informal”<br />
institutions regulating fishing activities. The gradual reduction in peoples’ adherence to traditional fishing taboos,<br />
and <strong>the</strong> marginalization <strong>of</strong> traditional leaders’ authorities over fishing in some locations, have led to increases in<br />
fishing pressure. (Munthali 1994). When Malawi gained independence in 1964, <strong>the</strong> expatriate regulatory scheme<br />
remained in place, for many years staffed by expatriates. The gradual transition to a predominantly Malawian staff<br />
did not significantly change <strong>the</strong> Fisheries Department’s regulatory approach in <strong>the</strong> short run.<br />
Stock reductions lead to new approach to <strong>management</strong><br />
During <strong>the</strong> 20 th Century Malawi’s human population has increased tenfold to nearly 10 million persons (National<br />
Statistical Office 1999). At <strong>the</strong> same time, estate holdings, where export crops such as tobacco and tea are<br />
produced, have grown to cover ten percent <strong>of</strong> Malawi’s total land area (roughly one million ha), occupying some <strong>of</strong><br />
<strong>the</strong> country’s best agricultural land (Eschweiler 1993). The average subsistence farmer’s plot has shrunk below one<br />
hectare, a size considered insufficient to fulfil a family’s needs (National Population Plan 1993). As a result, more<br />
and more farmers have resorted to fishing for supplementary income (Bland and Donda 1994, Derman 1995,<br />
Ferguson et al. 1993). The 1998 State <strong>of</strong> <strong>the</strong> Environment Report cites a 32 percent increase from 1983 to 1988. In<br />
light <strong>of</strong> <strong>the</strong> extreme poverty <strong>of</strong> many persons who depend on fishing, a potential strategy <strong>of</strong> limiting access through<br />
requiring licenses and limiting <strong>the</strong>ir number, has been considered and rejected (Bland and Donda 1995).<br />
As <strong>the</strong> number <strong>of</strong> persons fishing has risen, pressure on fish stocks has caused dramatic reductions in certain key<br />
species, giving rise to concerns about <strong>the</strong> ability <strong>of</strong> near-shore <strong>fisheries</strong> to continue to produce an adequate yield for<br />
human dietary purposes as well as concerns about conserving biodiversity. For example, one <strong>of</strong> <strong>the</strong> most important<br />
catch targets in Lake Malombe, <strong>the</strong> chambo, has nearly disappeared from that <strong>lake</strong>, and elsewhere stocks have<br />
dropped as well. A 1995 report shows Lake Malombe’s chambo catch dropping from slightly over 4,000 tons in<br />
1976 to about 100 tons in 1994 (Bland and Donda 1995). Catch data indicate that <strong>the</strong> national chambo catch has<br />
decreased from 17,000 tons in 1984 to 4,000 tons in 1996 (State <strong>of</strong> <strong>the</strong> Environment Report 1998). While<br />
substitution <strong>of</strong> o<strong>the</strong>r species is occurring (State <strong>of</strong> Environment Report 1998), <strong>the</strong> data indicate that a high <strong>of</strong> 88,500<br />
tons <strong>of</strong> overall catch in 1987 has fallen and remains around 70,000 tons (State <strong>of</strong> <strong>the</strong> Environment Report 1998,<br />
Bland and Donda 1995). Consequently, diminishing fish stocks is one <strong>of</strong> <strong>the</strong> nine most significant environmental<br />
problems identified in <strong>the</strong> National Environmental Action Plan (1994). It should be noted that concern centres<br />
around <strong>the</strong> near-shore catch targeted by small scale fishers. A recent Icelandic International Development Agency<br />
(ICEIDA) study <strong>of</strong> demersal stocks is reported to have revealed a large unexploited biomass far from shore<br />
(Seymour1997), where gear employed by small scale fishers, who produce 90 percent <strong>of</strong> <strong>the</strong> catch (Bland and<br />
Donda 1995), cannot reach it.<br />
Plummeting <strong>of</strong> near-shore stocks in <strong>the</strong> 1990s (Ministry <strong>of</strong> Information 2000, Bland and Donda 1995) resulted in an<br />
increasing employment <strong>of</strong> fishing gear such as mosquito nets that harvest with almost absolute efficiency (Scholtz et<br />
al. 1997, Bland and Donda 1995). At <strong>the</strong> same time that this type <strong>of</strong> illegal and unsustainable activity took root, a<br />
weak economy meant that fewer resources were available for <strong>the</strong> FD to maintain, let alone expand, its <strong>management</strong><br />
and enforcement activities (Bland and Donda 1995). Everyone, including fishers, however, could see that <strong>the</strong> fishery<br />
was in jeopardy, creating a situation in which most stakeholders were willing to consider a different <strong>management</strong><br />
strategy. Lack <strong>of</strong> resources created an environment in which experimentation with a new approach involving <strong>the</strong><br />
resource-using communities appeared to be a viable option, at least on a trial basis.<br />
Government and donor recognition that action needed to be taken to conserve <strong>the</strong> <strong>fisheries</strong> provided <strong>the</strong> impetus and<br />
led to funding. In 1992 an experiment to involve local fishers in <strong>management</strong> was launched at Lake Malombe at <strong>the</strong><br />
sou<strong>the</strong>rn tip <strong>of</strong> Lake Malawi. Since stocks <strong>of</strong> <strong>the</strong> highly prized chambo had been nearly fished to extirpation <strong>the</strong>re,<br />
and <strong>the</strong> <strong>lake</strong> was relatively small (390 km 2 ), with about 335 fishers (Government <strong>of</strong> Malawi 1994), it seemed a<br />
feasible site for a pilot project. While new to Malawi, <strong>fisheries</strong> co-<strong>management</strong> is a strategy that has been employed<br />
successfully in a variety <strong>of</strong> regions and situations (Pinkerton and Weinstein 1995, Pinkerton 1989). Desperate for a<br />
solution, <strong>the</strong> Fisheries Department collaborated with <strong>the</strong> German Technical Assistance Agency (GTZ) to create <strong>the</strong><br />
Malawi-German Fisheries and Aquaculture Development Project (MAGFAD) Participatory Fisheries Management<br />
Program (PFMP) (Scholtz et al. 1997, Bland and Donda 1994). They thought that education and direct participation
58<br />
Lake Malawi Fisheries Management Symposium - Proceedings<br />
in <strong>management</strong> would alter fisher behaviour, causing <strong>the</strong>m to reduce total effort to permit <strong>the</strong> stocks <strong>the</strong> time needed<br />
to recover, one <strong>of</strong> <strong>the</strong> PFMP’s goals.<br />
The strategies <strong>of</strong> <strong>the</strong> project were straight forward: provide extension education on fish biology and stock<br />
<strong>management</strong>, provide training and support on self-organization for <strong>management</strong> and leadership, and <strong>the</strong>n involve <strong>the</strong><br />
fishers in <strong>the</strong> formerly exclusive governmental domain <strong>of</strong> <strong>fisheries</strong> <strong>management</strong> (Scholtz et al. 1997). Increasing <strong>the</strong><br />
difficulty in bringing about change were <strong>the</strong> vestiges <strong>of</strong> decades <strong>of</strong> political oppression (Africa Watch Report 1990,<br />
Short 1974) that ended just as <strong>the</strong> PFMP was being launched. In a 1993 election, Malawi left behind 31 years <strong>of</strong><br />
dictatorship and chose multi-party democracy. Colonialism and <strong>the</strong> dictatorship had suppressed local level initiative<br />
and leadership and created a deep mistrust <strong>of</strong> government. These historical realities presented a challenge to PFMP<br />
organizers (Scholtz et al.1997, Mr. Ben Mtika, National Extension Agent, personal communication, 1996). Thus, an<br />
intensive educational and partnership-building effort was necessary along with carefully nurturing <strong>the</strong> development<br />
<strong>of</strong> <strong>the</strong> administrative and leadership skills needed to participate in <strong>fisheries</strong> co-<strong>management</strong>.<br />
Under girding <strong>the</strong> new <strong>management</strong> strategy is <strong>the</strong> <strong>the</strong>ory that shared regulatory responsibility, i.e., co<strong>management</strong><br />
1 , will increase <strong>management</strong> resources and enhance <strong>the</strong> fishery. Pinkerton (1989, p. 4) defines co<strong>management</strong><br />
as “...negotiated agreements and o<strong>the</strong>r legal or informal arrangements ... between groups or<br />
communities <strong>of</strong> fishermen and various levels <strong>of</strong> government responsible for <strong>fisheries</strong> <strong>management</strong>...” Ano<strong>the</strong>r useful<br />
definition supplied by Selin and Chavez (1995, p. 190) emphasizes <strong>the</strong> operational mechanism <strong>of</strong> such<br />
arrangements, “...a joint decision-making approach to problem resolution where power is shared, and stakeholders<br />
take collective responsibility for <strong>the</strong>ir actions and subsequent outcomes from those actions.” This type <strong>of</strong> strategy<br />
recognizes <strong>the</strong> significant role played by fishers, incorporates <strong>the</strong>ir needs, and draws upon <strong>the</strong>ir knowledge along<br />
with <strong>the</strong> <strong>of</strong>ten more technical knowledge <strong>of</strong> FD pr<strong>of</strong>essional staff. In a co-<strong>management</strong> arrangement, fishers begin<br />
to feel more like partners and less like miscreants that <strong>the</strong> government seeks to control. Fisheries Department staff<br />
assume new roles as well, shifting from top-down enforcers to collaborators. Concomitantly, through <strong>the</strong><br />
cooperation and collaboration inherent in co-<strong>management</strong>, <strong>the</strong> hostility and mistrust that existed historically in<br />
relationships between fishing communities and <strong>the</strong> Fisheries Department in Malawi began to dissipate (Scholtz et al.<br />
1997).<br />
Co-<strong>management</strong> arrangements may incorporate to varying degrees notions <strong>of</strong> shared authority, shared responsibility,<br />
stakeholder ownership <strong>of</strong> <strong>the</strong> resource, and direct benefits accruing to stakeholders. As a result <strong>of</strong> <strong>the</strong>ir involvement<br />
as managers, stakeholders may be held accountable and accept accountability for <strong>management</strong> outcomes which <strong>the</strong>y<br />
participated in creating. Perceiving <strong>the</strong>mselves as owners, and persons with responsibility for stock protection, <strong>the</strong>y<br />
are more likely to develop a long term view that changes <strong>the</strong>ir fishing behaviour (Bland and Donda, 1994).<br />
In <strong>the</strong> case <strong>of</strong> <strong>the</strong> PFMP at Lake Malombe, <strong>the</strong> program worked with <strong>the</strong> existing political framework to organize<br />
fishing villages. Each community elected a 10 to14 member beach village committee (BVC) to serve as an<br />
intermediary between <strong>the</strong> FD and <strong>the</strong> fishing community. Traditional authorities, village chiefs or village headmen,<br />
serve on <strong>the</strong> BVC within <strong>the</strong>ir jurisdiction in an ex <strong>of</strong>ficio capacity. After initial training provided by <strong>the</strong> FD and aid<br />
organizations, each BVC adopted a constitution and decided on which <strong>management</strong> activities <strong>the</strong>y would undertake.<br />
According to Scholtz et al. (1997) BVCs became involved in a variety <strong>of</strong> important activities including:<br />
1) discussions <strong>of</strong> <strong>fisheries</strong> regulations,<br />
2) licensing and record keeping for fishing gear and boats,<br />
3) control <strong>of</strong> <strong>the</strong>ir beach and fishing area (primarily gear and license inspection),<br />
4) organization <strong>of</strong> extension sessions, and<br />
5) participation in <strong>fisheries</strong> enforcement.<br />
The FD and donor <strong>of</strong>ficials believed that an educated community would be more likely to actively support shortterm<br />
fishing restrictions in <strong>the</strong> interest <strong>of</strong> long term gains. Thus, an extensive program <strong>of</strong> extension messages was<br />
launched by MAGFAD. The messages spoke <strong>of</strong> fish biology and appropriate fishing practices. Since most <strong>of</strong> <strong>the</strong><br />
target population is illiterate, <strong>the</strong> primary means <strong>of</strong> reaching out were discussions with BVC members, radio<br />
1 “Co-<strong>management</strong>” incorporates a broad range <strong>of</strong> approaches to public involvement in resource <strong>management</strong>. Ranging from<br />
seeking <strong>the</strong> views <strong>of</strong> affected groups to involving <strong>the</strong>m in problem identification, planning and implementation, to actual power<br />
sharing (IIED 1994). It also one <strong>of</strong> many terms and phrases used to refer to <strong>management</strong> by government that incorporates<br />
community members in some way, including “community-based natural resource <strong>management</strong>” and “collaborative <strong>management</strong>.”
59<br />
Lake Malawi Fisheries Management Symposium - Proceedings<br />
broadcasts, and performances <strong>of</strong> <strong>the</strong> MAGFAD band (Dawson 1997). The fishing villages rarely have live<br />
entertainment, so appearances by <strong>the</strong> band, singing songs about fishing, were always well attended and well received<br />
(Wilson 1993). UNDP supported <strong>the</strong> position <strong>of</strong> a full time extension expert who met regularly with <strong>the</strong> BVCs and<br />
trained <strong>the</strong>ir members in administration. Under his guidance <strong>the</strong>y learned about group dynamics and how to run<br />
elections, draft a constitution, create and maintain records and organize and run meetings (Scholtz et al. 1997).<br />
Co-<strong>management</strong> outcomes<br />
Positive <strong>fisheries</strong> <strong>management</strong> outcomes were reported by Scholtz et al. in <strong>the</strong>ir 1997 evaluation <strong>of</strong> <strong>the</strong> PFMP. Early<br />
in its development, in 1992, BVCs proposed regulations on appropriate fishing net mesh size. They advocated a<br />
19mm mesh while FD researchers argued for 25mm. Acceptance by <strong>the</strong> Department <strong>of</strong> <strong>the</strong> fishers’ position was a<br />
significant step forward in persuading <strong>the</strong> fishers to participate in <strong>the</strong> pilot project. O<strong>the</strong>r fisher-proposed regulations<br />
banned kambuzi seine nets and maintained <strong>the</strong> closed season. According to Scholtz et al. (1997) <strong>the</strong> FD was not in<br />
agreement with <strong>the</strong> usefulness <strong>of</strong> <strong>the</strong>se two rules, but <strong>the</strong>y were none<strong>the</strong>less adopted. The FD wished to be seen as<br />
recognizing fisher views in a significant way, and it was felt that <strong>the</strong> rules would do no significant harm to <strong>the</strong><br />
resource. With <strong>the</strong> adoption <strong>of</strong> <strong>the</strong> rules <strong>the</strong>y had advocated, <strong>the</strong> fishers knew <strong>the</strong>y had been heard and heeded, in<br />
keeping with <strong>the</strong> sentiment expressed by one <strong>of</strong> <strong>the</strong>m, Mr. Staubi Africa, who said in 1994, “It is for us fishermen to<br />
decide whe<strong>the</strong>r we want to be poor for one or two years, or whe<strong>the</strong>r we want to be poor forever” (Dr. J.G.M.<br />
Wilson, personal communication, January, 1996).<br />
Adoption rates <strong>of</strong> <strong>the</strong> new net sizes were reported to be 17 percent in 1994, 60 percent in 1995, and 85 percent in<br />
1996 (Scholtz et al. 1997). As <strong>the</strong> new program moved into full swing, Lake Malombe’s chambo catch data show<br />
an increase from 79 tons in 1994 to195 tons in 1995 (Scholtz et al. 1997), perhaps <strong>the</strong> beginning <strong>of</strong> a reversal <strong>of</strong> <strong>the</strong><br />
trend reported by Bland and Donda (1995).<br />
The reviews <strong>of</strong> <strong>the</strong> PFMP are not all positive. Indeed, a setback for <strong>the</strong> project occurred when fishers learned that<br />
promised “sitting fees” for meeting attendance, provision <strong>of</strong> new nets, and free replacement <strong>of</strong> nets <strong>of</strong> illegal mesh<br />
size were not forthcoming (DeGabriele 1998, Scholtz et al. 1997). An attempt to address <strong>the</strong> net replacement<br />
problem was made through a Fisheries Department small loan program. Through this program it was hoped that<br />
adoption <strong>of</strong> regulation size nets would happen as quickly as possible as well as salving <strong>the</strong> feelings <strong>of</strong> fishers<br />
concerned about “broken promises,” but fishers remained dissatisfied because <strong>the</strong> loan program did not fully meet<br />
<strong>the</strong>ir needs nor <strong>the</strong> original commitment <strong>of</strong> <strong>the</strong> FD (DeGabriele 1998, Scholtz et al. 1997).<br />
Scholtz et al.(1997) observed that FD staff continued to operate in a “top down” manner after <strong>the</strong> program began,<br />
undermining messages <strong>of</strong> shared authority and trust between managing “partners.” In addition, some recent attempts<br />
by BVCs to penalize violators were thwarted by FD <strong>of</strong>ficers (Dr. J.G.M. Wilson, personal communication, March<br />
28, 2000). Such overt blocking <strong>of</strong> BVC <strong>management</strong> authority will continue undermine <strong>the</strong> BVC-FD relationship as<br />
well as confidence in <strong>the</strong> willingness <strong>of</strong> <strong>the</strong> FD to share authority and to honour BVC decisions.<br />
The lack <strong>of</strong> effective communication, trust, and coordination between <strong>the</strong> FD and fishing communities was most<br />
recently highlighted by Mangochi fishermen’s misunderstanding and mistrust <strong>of</strong> <strong>the</strong> Department <strong>of</strong> Fisheries’s<br />
regulations establishing a closed fishing season that applied to local fishermen while excluding <strong>the</strong> commercial<br />
fishing vessels <strong>of</strong> MALDECO (Chimwaza 2000). The fact that fishermen’s ignorance <strong>of</strong> <strong>the</strong> reasoning behind <strong>the</strong><br />
regulations was dealt with using riot police and tear gas speaks volumes to <strong>the</strong> need for greater education and, more<br />
importantly, dialogue between <strong>the</strong> parties before regulations are passed (a need that can be addressed using<br />
increased participatory <strong>management</strong> (Donda 2000) . It is apparent from this incident that <strong>the</strong> reconfiguration <strong>of</strong><br />
government <strong>of</strong>ficials’ roles not been fully addressed, evaluations <strong>of</strong> stakeholder (including agency staff) incentives<br />
in <strong>the</strong> co-<strong>management</strong> process are needed, and that <strong>the</strong> participatory governance paradigm has not yet been fully<br />
internalised throughout <strong>the</strong> FD.<br />
Legislation authorises co-<strong>management</strong><br />
From <strong>the</strong> beginning GTZ had been concerned about <strong>the</strong> absence <strong>of</strong> mandated institutional support for fisher<br />
participation in <strong>management</strong> (Scholtz et al. 1997). With progress to report that could be used to argue for legal<br />
status for this kind <strong>of</strong> activity, and with a proposed new <strong>fisheries</strong> law, “Fisheries Conservation and Management<br />
Act,” in <strong>the</strong> parliamentary hopper, GTZ began to pressure <strong>the</strong> government for new statutory provisions to formalize<br />
<strong>fisheries</strong> co-<strong>management</strong> (Dobson 1997). A consultant was hired to prepare an analysis <strong>of</strong> <strong>the</strong> situation and to draft<br />
language that could be inserted in <strong>the</strong> proposed statute (Dobson 1996). Her report was presented to <strong>the</strong> Director <strong>of</strong><br />
Fisheries in May, 1996. The proposed statute was enacted in 1997, and it includes a new section. “Part III,”
60<br />
Lake Malawi Fisheries Management Symposium - Proceedings<br />
containing provisions authorizing “Local Community Participation” (Fisheries Conservation and Management Act,<br />
1997). Broadly speaking, BVCs are responsible for “conservation and <strong>management</strong> <strong>of</strong> <strong>fisheries</strong>” within <strong>the</strong>ir<br />
jurisdiction (Fisheries Conservation and Management (Local Community Participation Rules, 1998). The more<br />
specific details setting forth <strong>the</strong> institutional structures and authority <strong>of</strong> BVCs (e.g., licensing <strong>of</strong> small scale fishers,<br />
vessels and gear, enforcement) appear in <strong>the</strong> Fisheries Conservation and Management (Local Community<br />
Participation) Rules, 1998. The National Fisheries and Aquaculture Policy <strong>of</strong> 1999, has gone on to support co<strong>management</strong><br />
in stating that “..participatory <strong>fisheries</strong> <strong>management</strong> has proven to be <strong>the</strong> most appropriate method to<br />
manage <strong>the</strong> fish resources in <strong>the</strong> <strong>lake</strong>s <strong>of</strong> Malawi.”<br />
Co-<strong>management</strong> at Lake Malawi and beyond<br />
With legislation in place securing <strong>the</strong> position <strong>of</strong> co-<strong>management</strong>, in 1998, GTZ authorized funding to expand <strong>the</strong><br />
program it had initiated at Lake Malombe to <strong>the</strong> fishing villages <strong>of</strong> Lake Malawi. The expansion is a substantial<br />
undertaking in view <strong>of</strong> <strong>the</strong> size <strong>of</strong> <strong>the</strong> Lake. According to a consultant who is currently reviewing co-<strong>management</strong><br />
activities in many <strong>of</strong> Malawi’s natural resources sectors, including <strong>the</strong> <strong>fisheries</strong>, his preliminary data indicate that<br />
progress is slow (Dr. J.G.M. Wilson, personal communication, March 28, 2000). According to Wilson, no co<strong>management</strong><br />
agreements between <strong>the</strong> Fisheries Department and local communities have yet been signed as<br />
authorized by <strong>the</strong> 1997 Fisheries Conservation and Management Act (Dr. J.G. M. Wilson, personal communication<br />
June 27, 2000). Formal agreements between <strong>the</strong> FD and BVCs would likely streng<strong>the</strong>n fishers’ sense <strong>of</strong> ownership<br />
and responsibility.<br />
Wilson (June 2000) fur<strong>the</strong>r reports that initial BVC organization has occurred at <strong>the</strong> sou<strong>the</strong>rn end <strong>of</strong> <strong>the</strong> Lake, but<br />
that <strong>the</strong> regular radio broadcasts on fishing appear to have induced fishers at <strong>the</strong> more remote, Nor<strong>the</strong>rn end <strong>of</strong> <strong>the</strong><br />
<strong>lake</strong> to organize into BVCs on <strong>the</strong>ir own, in a fashion similar to <strong>the</strong> Lake Chiuta fishers described below. Having<br />
come into existence only recently, it may be too soon to begin evaluating <strong>the</strong> effectiveness <strong>of</strong> <strong>the</strong> activities <strong>of</strong> <strong>the</strong><br />
new groups.<br />
While beyond <strong>the</strong> scope <strong>of</strong> this article, it should be noted that <strong>the</strong> Lake Malombe project gave rise to a successful<br />
fisher-initiated effort at Lake Chiuta, a small <strong>lake</strong> that sits astride <strong>the</strong> Malawi-Mozambique border (see Figure 1).<br />
Learning <strong>of</strong> <strong>the</strong> Lake Malombe approach, in 1994 fishers organized <strong>the</strong>mselves to protect <strong>the</strong>ir fishery from<br />
approximately 300 new entrants from Lake Chilwa which had substantially dried up. With very limited assistance<br />
from <strong>the</strong> FD, <strong>the</strong>y employed <strong>the</strong> model <strong>of</strong> Lake Malombe’s BVCs. They established nine 14-member Fish Stock<br />
Management Committees and drove <strong>of</strong>f <strong>the</strong> interlopers who were using damaging nkacha seine nets and fouling <strong>the</strong><br />
Lake’s waters with human waste (Dawson 1997, Scholtz et al. 1997). That effort appears to be continuing from a<br />
recent report describing <strong>the</strong> successful confiscation <strong>of</strong> two “illegal seine nets” from armed Mozambican fishers by<br />
Lake Chiuta fishers (Dr. J.G.M.Wilson, personal communication, March 28, 2000).<br />
Involving members <strong>of</strong> <strong>the</strong> user community in <strong>management</strong> is still in its fledgling stage in Malawi, and additional<br />
time is required before impacts on <strong>the</strong> fishery can be clearly seen and fully assessed. These efforts toward increasing<br />
<strong>the</strong> participation <strong>of</strong> local communities in resource <strong>management</strong> are part <strong>of</strong> a larger pattern that is being seen in <strong>the</strong><br />
region. An example is Malawi’s nor<strong>the</strong>rn neighbour, Tanzania, which has recently reacted to dropping fish stocks<br />
and water quality concerns by implementing a co-<strong>management</strong> approach for its Lake Victoria fishery. In response<br />
to increasing population pressures, overfishing, use <strong>of</strong> illegal gear and <strong>the</strong> introduction <strong>of</strong> a pesticide, thiodan, that<br />
were damaging <strong>the</strong> <strong>fisheries</strong> stocks and <strong>the</strong> <strong>lake</strong> water quality, 91 Beach Management Units (BMUs) have been<br />
established in Mwanza Gulf (Hoza and Mahantane 1998). It appears to be similar in form to <strong>the</strong> Lake Malombe<br />
program, with responsibility shared between <strong>the</strong> Fisheries Division <strong>of</strong> <strong>the</strong> government and <strong>the</strong> BMUs who patrol<br />
<strong>the</strong>ir fishing grounds to reduce illegal fishing.<br />
It should be noted that <strong>the</strong> co-<strong>management</strong> approach is being adopted well beyond <strong>the</strong> developing nations. Policy<br />
makers and managers are realizing that working with stakeholders in planning and implementation makes great<br />
practical sense (Selin and Chavez 1995, discussing inter alia “collaboration models” used by <strong>the</strong> U.S. Forest<br />
Service). Just as <strong>the</strong> fishers in Malawi have useful knowledge to contribute to <strong>the</strong> <strong>management</strong> <strong>of</strong> <strong>the</strong>ir fishery, as<br />
one example, <strong>the</strong> U.S. Fish and Wildlife Service acknowledges <strong>the</strong> importance <strong>of</strong> <strong>the</strong> knowledge and community<br />
ownership <strong>of</strong> residents in <strong>the</strong> Bitterroot Ecosystem as it moves forward with a plan to re-introduce <strong>the</strong> grizzly bear<br />
<strong>the</strong>re in <strong>the</strong> near future to be managed by a citizen board (U.S. Fish and Wildlife Service 1999).
61<br />
Lake Malawi Fisheries Management Symposium - Proceedings<br />
Participatory approaches in resource <strong>management</strong> agencies<br />
Descriptions <strong>of</strong> <strong>the</strong> factors that are conducive to making co-<strong>management</strong> effective have been described by many<br />
authors (ex. Baland and Platteau 1996, Ostrom 1990). And while most authors discuss at length <strong>the</strong> requirements<br />
for capacity-building in communities and user-groups, most give short shrift to <strong>the</strong> institutional changes that are<br />
needed in <strong>the</strong> resource <strong>management</strong> agencies, whose staff are being drastically altered by fiat. Therefore, we will<br />
discuss some <strong>of</strong> <strong>the</strong> findings <strong>of</strong> <strong>the</strong> co-<strong>management</strong> literature on <strong>the</strong>se neglected participants in <strong>the</strong> co-<strong>management</strong><br />
process: <strong>the</strong> resource agency personnel.<br />
While most resource <strong>management</strong> field staff have traditionally enjoyed relatively high levels <strong>of</strong> authority and<br />
prestige over fishing communities, <strong>the</strong>ir new roles in a co-<strong>management</strong> program have stripped <strong>the</strong>m <strong>of</strong> much<br />
authority and prestige. Ironically, <strong>the</strong>y are <strong>the</strong> recipients <strong>of</strong> upper-agency/upper-governmental directives mandating<br />
<strong>the</strong>ir participation in a participatory <strong>management</strong> approach, while this same courtesy <strong>of</strong> participation is not applied<br />
to <strong>the</strong>m within <strong>the</strong>ir department. In a study done by Gronow (1995), it was noted that <strong>the</strong> Forestry Department field<br />
staff in Nepal lacked a true understanding <strong>of</strong> <strong>the</strong> participatory approach, and failed to appreciate <strong>the</strong> legitimacy and<br />
desirability <strong>of</strong> <strong>the</strong> approach as <strong>the</strong>ir own lack <strong>of</strong> knowledge, lack <strong>of</strong> incentives, job tenure insecurity, and lack <strong>of</strong><br />
agency support had not been taken into account in <strong>the</strong> design <strong>of</strong> <strong>the</strong> new program. Their inability to voice <strong>the</strong>se<br />
concerns and opinions caused <strong>the</strong>m to resist <strong>the</strong>ir gradual loss <strong>of</strong> authority and power. As a result, nei<strong>the</strong>r <strong>the</strong><br />
agency’s nor <strong>the</strong> communities’ goals were met.<br />
It was only in certain areas where <strong>the</strong> forestry field agency concerns were addressed that staff became enthusiastic<br />
supporters <strong>of</strong> <strong>the</strong> new programs, <strong>the</strong>reby contributing to <strong>the</strong> programs’ successes. The process <strong>of</strong> reorientation was<br />
made in several stages (Gronow 1995). To initiate <strong>the</strong> process, field personnel were invited to take part in a 10-day<br />
workshop, where <strong>the</strong>y were encouraged to discuss amongst <strong>the</strong>mselves (with <strong>the</strong> aid <strong>of</strong> a pr<strong>of</strong>essional facilitator) <strong>the</strong><br />
issues surrounding forestry co-<strong>management</strong> and <strong>the</strong>ir roles in it. At this same workshop, <strong>the</strong>y were presented with<br />
<strong>the</strong> latest information regarding <strong>the</strong> resource, co-<strong>management</strong> research, and participatory methods. Most workshops<br />
culminated with <strong>the</strong> staff’s decision to adopt <strong>the</strong>ir newly understood roles in <strong>the</strong> co-<strong>management</strong> process,<br />
committing <strong>the</strong>mselves to <strong>the</strong> process. By allowing <strong>the</strong> field staff to experience a participatory approach within <strong>the</strong><br />
agency where <strong>the</strong>y saw <strong>the</strong> value <strong>of</strong> actively addressing stakeholders’ (in this case, <strong>the</strong>mselves) concerns, <strong>the</strong>y<br />
understood <strong>the</strong> merits inherent in doing <strong>the</strong> same with <strong>the</strong> forest-stakeholders.<br />
The second element was to provide <strong>the</strong> field staff with “follow-up support” to consolidate <strong>the</strong> process that was<br />
started at <strong>the</strong> workshops (Gronow 1995). They were provided with short-term moral and practical support, and job<br />
security while <strong>the</strong>y attempted to innovatively change <strong>the</strong> ways that <strong>the</strong>ir jurisdictions’ forest resources were<br />
managed. The presence <strong>of</strong> competent and supportive role models was seen to be highly predictive <strong>of</strong> field staffs<br />
becoming effective and enthusiastic facilitators <strong>of</strong> <strong>the</strong> co-<strong>management</strong> processes with <strong>the</strong>ir forest user-groups.<br />
The last element, which has been shown to be <strong>the</strong> most challenging is achieving <strong>the</strong> institutional change necessary<br />
within <strong>the</strong> agency as a whole “.. to provide field staff with an environment conducive to <strong>the</strong>ir new role.”(Gronow<br />
1995) This requires a consistent application <strong>of</strong> <strong>the</strong> participatory approach within <strong>the</strong> agency. Lacking this<br />
consistency, different levels <strong>of</strong> <strong>the</strong> agency develop highly disparate attitudes toward co-<strong>management</strong>, from proparticipatory,<br />
manipulative, incremental, to anti-participatory (Midgley et al. 1986). This can have <strong>the</strong> effect <strong>of</strong><br />
stifling motivation and innovation at all levels within <strong>the</strong> agency, and <strong>the</strong> development <strong>of</strong> perverse incentives against<br />
resource conservation and resource-user participation in <strong>management</strong>.<br />
In developing <strong>the</strong> co-<strong>management</strong> regimes with communities, <strong>the</strong> incentives <strong>of</strong> all stakeholders must be addressed.<br />
As <strong>the</strong> field staff are <strong>the</strong> main representatives <strong>of</strong> <strong>the</strong> agency in <strong>the</strong> co-<strong>management</strong> process, <strong>the</strong>ir roles and incentives<br />
need to receive as close scrutiny as that <strong>of</strong> <strong>the</strong> incentives and institutions facilitating community-members’ actions,<br />
if <strong>the</strong>se new <strong>management</strong> regimes are to achieve success. When looking at field staffs’ incentives for acceptance <strong>of</strong><br />
<strong>the</strong> participatory method, <strong>the</strong> incentives within <strong>the</strong>ir working environment need to be analysed and restructured in<br />
ways that encourage, ra<strong>the</strong>r than discourage <strong>the</strong>ir investment in <strong>the</strong> process. Through periodic participatory<br />
dialogues with all agency staff, <strong>the</strong> incentives and disincentives that arise can be addressed to improve staff<br />
members’ productivity and to reduce <strong>the</strong> development <strong>of</strong> perverse incentives within <strong>the</strong> agency.<br />
A brief discussion <strong>of</strong> <strong>the</strong> literature on human development will assist in understanding why and how this might<br />
work. The hierarchy <strong>of</strong> human needs was first described by Maslow (1943) to outline <strong>the</strong> motivations behind<br />
peoples’ actions (Figure 2). The bottom four levels <strong>of</strong> a simplified version <strong>of</strong> Maslow’s concept are called
62<br />
Lake Malawi Fisheries Management Symposium - Proceedings<br />
“deficiency needs,” which must be met before a person is able to move to <strong>the</strong> next level. The top level is “selfactualisation,”<br />
which, with Maslow’s later work (1954), came to be expanded into a grouping named “growth<br />
needs” consisting <strong>of</strong> (in order <strong>of</strong> increasing human growth):<br />
· Cognitive growth: <strong>the</strong> need to know, to understand, and explore;<br />
· Aes<strong>the</strong>tic growth: <strong>the</strong> need for symmetry, order, and beauty;<br />
· Self-actualization: to find self-fulfillment and realize one's potential; and<br />
· Transcendence: to help o<strong>the</strong>rs find self-fulfillment and realize <strong>the</strong>ir potential.<br />
Closely related to Maslow’s hierarchy is Herzberg’s (Herzberg et al. 1959) “Motivation Hygiene Theory” which<br />
describes job factors that motivate employees, dividing motivations in a similar fashion to Maslow (Figure 2):<br />
hygiene maintenance factors (related to “deficiency needs”), and motivational Factors (related to “growth needs”).<br />
“Hygiene factors” are a requisite avoiding workers’ dissatisfaction in <strong>the</strong>ir jobs, while “motivational factors”<br />
actually produce job satisfaction (and motivate). Fur<strong>the</strong>rmore, while hygiene factor improvements may create shortterm<br />
changes in job performance, long term job performance changes are created only by increased motivational<br />
factors.<br />
Extending Maslow’s and Herzberg’s <strong>the</strong>ories to <strong>the</strong> roles played by resource <strong>management</strong> staff members in co<strong>management</strong><br />
regimes, it seems clear that in order for agency personnel to actively embrace a role in co-<strong>management</strong><br />
that is foreign to <strong>the</strong>m (and may have <strong>the</strong> potential to endanger <strong>the</strong>ir “deficiency/hygiene” needs), <strong>the</strong>ir<br />
“deficiency/hygiene” needs and “growth/motivational” needs must be addressed. These latter needs can only be<br />
sustained if <strong>the</strong>y are part <strong>of</strong> an overall evaluation <strong>of</strong> <strong>the</strong> institutional infrastructure, which can best be done through<br />
an incorporation <strong>of</strong> participatory approaches in <strong>the</strong> <strong>management</strong> <strong>of</strong> <strong>the</strong> agency itself.<br />
Agency personnel analyses also should learn from <strong>the</strong> co-<strong>management</strong> literature by addressing <strong>the</strong> same erroneous<br />
assumptions that have been applied to <strong>the</strong> identities and capacities <strong>of</strong> “community members.” “Agency staff” at all<br />
levels should not be seen as homogeneous, given <strong>the</strong>ir unique ideologies and identities stemming from <strong>the</strong>ir<br />
overlapping pr<strong>of</strong>iles <strong>of</strong> gender, religion, ethnicity, socio-economic background, and so forth. To induce <strong>the</strong>m to<br />
innovate and be pro-active in <strong>the</strong>ir jobs, <strong>the</strong>ir incentives and disincentives at every stage <strong>of</strong> <strong>the</strong> co-<strong>management</strong><br />
process (policy making, planning, evaluation, enforcement) need to be analysed and addressed in <strong>the</strong> context <strong>of</strong> <strong>the</strong><br />
effects that <strong>the</strong>y have on <strong>the</strong> program. One <strong>of</strong> <strong>the</strong> best ways for this to be achieved is through active, consistent, and<br />
productive dialogue within <strong>the</strong> agency.<br />
Conclusions<br />
This assessment indicates that <strong>the</strong> evolution in <strong>the</strong> <strong>management</strong> approach for Malawi’s fishery from controls through<br />
traditional methods to license-based open access may be responsible for near-crisis conditions in <strong>the</strong> near-shore<br />
fishery. Coming at least part way round <strong>the</strong> circle, Malawi is following <strong>the</strong> approach employed in o<strong>the</strong>r <strong>fisheries</strong> to<br />
reincorporate local participation in <strong>fisheries</strong> <strong>management</strong>. While not a panacea, given <strong>the</strong> magnitude and multitude<br />
<strong>of</strong> o<strong>the</strong>r social issues in Malawi (e.g., human population growth, a weak economy), co-<strong>management</strong> appears to be a<br />
<strong>management</strong> strategy with many positive potentials.<br />
Seeing <strong>the</strong>mselves as <strong>management</strong> partners with a significant role in building sustainable <strong>fisheries</strong> could cause<br />
fishers to adopt a longer term view, replacing <strong>the</strong> short term thinking which dictates taking as many fish each day as<br />
possible. Such a changed mentality is necessary to move Malawi in <strong>the</strong> direction <strong>of</strong> fishery sustainability. Care<br />
should be taken, however, to avoid <strong>the</strong> mistakes that have been made thus far that have hindered <strong>the</strong> effectiveness <strong>of</strong><br />
<strong>the</strong> PFMP co-<strong>management</strong> arrangement, such as <strong>the</strong> failure to make good on commitments to fishers, undermining<br />
fisher enforcement efforts, and direct conflict between FD staff and fishers.<br />
Also crucial to <strong>the</strong> success <strong>of</strong> <strong>fisheries</strong> co-<strong>management</strong> are appropriate training and redeployment <strong>of</strong> <strong>management</strong><br />
staff as well as a shift to more <strong>of</strong> a participatory approach within <strong>the</strong> Fisheries Department itself. The mistakes to<br />
date could be more easily avoided by ensuring complete understanding, unanimity, and institutional support within<br />
<strong>the</strong> agency <strong>of</strong> <strong>the</strong> reconfigured roles to be played by <strong>the</strong> agency and its staff in <strong>fisheries</strong> <strong>management</strong>.
63<br />
Lake Malawi Fisheries Management Symposium - Proceedings<br />
Figure 2. Maslow’s Hierarchy <strong>of</strong> Needs and Herzberg’s Motivation Hygiene Theory (from Allen 1998).<br />
Figure 3. Herzberg’s Motivation Hygiene Theory (expanded) (from Allen 1998).
64<br />
Lake Malawi Fisheries Management Symposium - Proceedings<br />
References<br />
Alimoso, S.B. 1994. Recent Research and New Management Strategies for <strong>the</strong> Fisheries <strong>of</strong> Lakes Malawi and Malombe.<br />
Fisheries Department Report.<br />
Allen, G. 1998. Supervision. (Hyperlink-http://ollie.dcccd.edu/mgmt1374/book_intro.html).<br />
Baland, J.M., & Platteau, J.P. 1996. Halting degradation <strong>of</strong> natural resources: is <strong>the</strong>re a role for rural communities? New<br />
York: United Nations Food and Agriculture Organization and Oxford: Clarendon Press.<br />
Bland, S.J.R., Donda, S.J. 1995. Common Property and Poverty: Fisheries Co-Management in Malawi. Fisheries Bulletin No.<br />
30. 1-16.<br />
Bland, S.J.R. & Donda, S.J. 1994. Management Initiatives for <strong>the</strong> Fisheries <strong>of</strong> Malawi. Fisheries Department Report,<br />
Government <strong>of</strong> Malawi.<br />
Chimwaza, E. 2000. “Police tear gasses Mangochi fishermen” Malawi News, December 9-15, 2000.<br />
Dawson, K.R. 1997. Applying Cooperative Management in Small-Scale Fisheries: The Cases <strong>of</strong> Lakes Malombe and Chiuta,<br />
Malawi, M.S. <strong>the</strong>sis, Michigan State Univ., East Lansing, MI.<br />
DeGabriele, J. 1998. Evaluation <strong>of</strong> <strong>the</strong> participatory <strong>fisheries</strong> <strong>management</strong> programme for Lake Malombe and <strong>the</strong> Upper Shire.<br />
Report to GTZ, 1-32.<br />
Department <strong>of</strong> Economic Planning and Development. 1993. National Population Report. Office <strong>of</strong> <strong>the</strong> President and Cabinet,<br />
Government <strong>of</strong> Malawi.<br />
Department <strong>of</strong> Research and Environmental Affairs. 1994. National Environmental Action Plan., Government <strong>of</strong> Malawi.<br />
Derman, B., Ferguson, A. & Mkandawire, R. 1994. Socioeconomic Diversity among Lake Malawi’s Small-Scale Fishers:<br />
Implications for Biological Diversity and Fisheries Management. Presented at <strong>the</strong> Annual Meeting <strong>of</strong> <strong>the</strong> American<br />
Association for <strong>the</strong> Advancement <strong>of</strong> Science.<br />
Derman, B & Ferguson, A. 1995. Human Rights, Environment and Development: The Dispossession <strong>of</strong> Fishing Communities on<br />
Lake Malawi. Human Ecology. 23:125-142<br />
Dobson, T. 1996. A Report to <strong>the</strong> Director <strong>of</strong> Fisheries on Behalf <strong>of</strong> <strong>the</strong> Malawi-German Fisheries and Aquaculture Development<br />
Project. Submitted 24 May 1996.<br />
Dobson, T. 1997. Radical Restructuring <strong>of</strong> Environmental Policy to Preserve Biodiversity in Sou<strong>the</strong>rn Africa: Malawi at <strong>the</strong><br />
Crossroads. J. <strong>of</strong> Nat. Resources & Env. Law. 13:149-175.<br />
Dobson, T. 1999. Community Participation in Natural Resources Management in Malawi: Charting a New Course for<br />
Sustainability. Colo. J. <strong>of</strong> Intl. Env. Law and Policy, 1998 Yearbook, 153-177.<br />
Donda, S. 2000. Journey to sustainable <strong>fisheries</strong> <strong>management</strong>: organizational and institutional limitations in <strong>fisheries</strong> co<strong>management</strong>,<br />
<strong>the</strong> cases <strong>of</strong> <strong>lake</strong>s Malombe and Chiuta in Malawi. IIFET2000: Microbehavior and Macroresults, Oregon<br />
State University.<br />
Environmental Affairs Department. 1998. State <strong>of</strong> Environment Report for Malawi 1998. , Government <strong>of</strong> Malawi.<br />
Eschweiler, J.A. 1993. Malawi Land Uses. Consultant’s Report to <strong>the</strong> World Bank. i-vii & 1-107.<br />
Ferguson, A., Derman, B. & Mkandawire, R. 1993. The New Development Rhetoric and Lake Malawi. Africa. 63:1-18.<br />
Food and Agriculture Organization <strong>of</strong> <strong>the</strong> United Nations (FAO) Fisheries Department. 1996. Fishery Country Pr<strong>of</strong>ile: The<br />
Republic <strong>of</strong> Malawi. Http://www.fao.org/fi/fcp/<strong>malawi</strong>e.asp.<br />
Government <strong>of</strong> Malawi, Food and Agriculture Organization <strong>of</strong> <strong>the</strong> United Nations, United Nations Development Programme.<br />
1994. Fisheries <strong>management</strong> in <strong>the</strong> south-east arm <strong>of</strong> Lake Malawi, <strong>the</strong> Upper Shire River and Lake Malombe, with<br />
particular reference to <strong>the</strong> <strong>fisheries</strong> on Chambo (Oreochromis spp.). Chambo Fisheries Research Project.<br />
Gronow, J. 1995. Shifting power, sharing power: issues from user-group forestry in Nepal. In Nelson, N., and S. Wright, eds.<br />
Power and Participatory Research: Theory and practice.<br />
Herzberg, F., Mausner, B. & Snyderman, B.B. 1959. The Motivation to Work (2nd ed.). New York: John Wiley & Sons.<br />
Hoza, R.B. & Mahatane, A.T. 1998. Fisheries Management Component: Co-Management in Mwanza Gulf. Ministry <strong>of</strong><br />
Natural Resources and Tourism.<br />
Human Rights Watch. 1990. Where Silence Rules: The Suppression <strong>of</strong> Dissent in Malawi. An Africa Watch Report.<br />
International Institute for Environment and Development (IIED). 1994. Whose Eden? An Overview <strong>of</strong> Community Approaches<br />
to Wildlife Management. A report to <strong>the</strong> Overseas Development Administration <strong>of</strong> <strong>the</strong> British Government.<br />
Koro, E. 1999. Where Are Malawi’s Fish?, Africa Information Afrique, May 24, 1999.<br />
Maslow, A. 1943. A <strong>the</strong>ory <strong>of</strong> human motivation. Psychological Review, 50, 370-396.<br />
Maslow, A. & Lowery, R. Ed.. 1998. Toward a psychology <strong>of</strong> being (3rd ed.). New York: Wiley & Sons.<br />
Ministry <strong>of</strong> Information. 2000. Agriculture. Http://www.maform.<strong>malawi</strong>.net/agricutlure.htm<br />
McCracken, J. 1987. Fishing and <strong>the</strong> Colonial Economy: The Case <strong>of</strong> Malawi. J. <strong>of</strong> African History. 28:413-429.<br />
Munthali, S.M. 1994. Protected Areas and People: Sustaining Lake Malawi’s Ecology. Report to <strong>the</strong> Department <strong>of</strong> National<br />
Parks and Wildlife, Malawi. 1-36.<br />
National Statistical Office. 1999. Population <strong>of</strong> Malawi in 1998, 1987 and 1977 by area and sex.<br />
Http://www.nso.<strong>malawi</strong>.net/Comparative_population.htm.<br />
Ostrom, E. 1990. Governing <strong>the</strong> commons: <strong>the</strong> evolution <strong>of</strong> institutions for collective action. Cambridge: Cambridge University<br />
Press.<br />
Pinkerton, E. & Weinstein, M. 1995. Fisheries that Work: Sustainability Through Community-Based Management. A Report to<br />
<strong>the</strong> David Suzuki Foundation.<br />
Pinkerton, E. 1989. Co-Operative Management <strong>of</strong> Local Fisheries: New Directions for Improved Management and Community<br />
Development. Vancouver, British Columbia: University <strong>of</strong> British Columbia Press
65<br />
Lake Malawi Fisheries Management Symposium - Proceedings<br />
Scholtz, U.F., Njaya, F.J., Chimatiro, S., Hummel, M., Donda, S.& Mkoko, B.J. 1997. Status and Prospects <strong>of</strong> Participatory<br />
Fisheries Management Programs in Malawi. A paper presented at <strong>the</strong> FAO/ODA Expert Consultation on Inland<br />
Fisheries Enhancements, Dhaka, Bangladesh, 7-11 April, 1997.<br />
Selin, S. &Chavez, D. 1995. Developing a Collaborative Model for Environmental Planning and Management. Environmental<br />
Management. 19:189-195.<br />
Seymour, A. 1997. A Fishy Tale. Notes for a presentation to <strong>the</strong> [Malawi] Donors Environment and Natural Resources meeting,<br />
Sept. 4, 1997.<br />
Short, P. 1974. Banda.. London: Cox & Wyman Ltd.<br />
U.S. Fish and Wildlife Service. 1993. Grizzly Bear Recovery in <strong>the</strong> Bitterroot Ecosystem. Environmental Impact Statement.<br />
Wilson, J.G.M. 1993. Lake Malawi and <strong>the</strong> Upper Shire River: Community Fisheries Management Programme. Sou<strong>the</strong>rn Africa<br />
Development Coordination Natural Resources Newsletter, Issue 4, October.<br />
Governmental Statutes and Policies cited<br />
Environment Management Act (1996) (Malawi)<br />
Fisheries Conservation and Management Bill (1996) (Malawi)<br />
Fisheries Conservation and Management Act (1997) (Malawi)<br />
Fisheries Conservation and Management (Local Community Participation) Rules, 1998 (Malawi)<br />
National Fisheries and Aquaculture Policy, October 1999.
66<br />
Lake Malawi Fisheries Management Symposium - Proceedings<br />
Fisheries <strong>management</strong> and uncertainty: <strong>the</strong> causes and consequences <strong>of</strong><br />
variability in inland <strong>fisheries</strong> in Africa, with special reference to Malawi<br />
Edward H. Allison 1 , Frank Ellis 1 , Peter M. Mvula 2 and Laurence F. Mathieu 1<br />
1 School <strong>of</strong> Development Studies, University <strong>of</strong> East Anglia, Norwich NR4 7TJ, U.K.<br />
2 Centre for Social Research, Chancellor College, Zomba, University <strong>of</strong> Malawi.<br />
* Corresponding author.<br />
Abstract<br />
Uncertainty pervades <strong>the</strong> <strong>management</strong> <strong>of</strong> <strong>fisheries</strong>. Scientific <strong>fisheries</strong> <strong>management</strong> over <strong>the</strong> last 50 years has been based on <strong>the</strong><br />
premise that <strong>the</strong>re exists an equilibrium relationship between fish production and <strong>the</strong> level <strong>of</strong> harvest that can be taken without<br />
depleting <strong>the</strong> stocks. These equilibrium ‘surplus-production’ and ‘yield-per-recruit’ models have served to establish <strong>the</strong> principle that<br />
unregulated fishing will deplete fish stocks and dissipate economic rents from <strong>the</strong> fishery, but <strong>the</strong>y have been <strong>of</strong> limited applicability<br />
for practical <strong>fisheries</strong> <strong>management</strong> when <strong>the</strong>ir equilibrium assumptions are violated. The influence <strong>of</strong> equilibrium models has<br />
extended beyond stock assessment into <strong>management</strong>, such that many <strong>fisheries</strong> <strong>management</strong> measures are based on a ‘steadystate’<br />
view <strong>of</strong> fishery resources even when most stakeholders are aware that <strong>the</strong> assumptions are untenable.<br />
This paper makes <strong>the</strong> case that fish production in many African inland waters is driven by climate variations. For <strong>fisheries</strong> where<br />
stocks fluctuate independently <strong>of</strong> fishing effort, <strong>management</strong> for traditional sustained-yield type objectives is inappropriate. While<br />
<strong>the</strong>re have been many studies attempting to elucidate <strong>the</strong> mechanisms for environmentally-induced fishery fluctuations, <strong>the</strong>re have<br />
been fewer studies <strong>of</strong> <strong>the</strong> consequences <strong>of</strong> such variability for fisherfolks’ livelihoods, and for <strong>the</strong> design <strong>of</strong> appropriate fishery<br />
<strong>management</strong> regimes. A study <strong>of</strong> <strong>the</strong> livelihood strategies <strong>of</strong> fisherfolk involved in <strong>the</strong> important <strong>fisheries</strong> for small pelagic species in<br />
Lake Malawi is used to make <strong>the</strong> case for <strong>management</strong> that supports opportunistic exploitation <strong>of</strong> fluctuating resources by enabling<br />
geographical and occupational mobility. Livelihood sustainability and resource conservation are best served by support for such<br />
flexible strategies. The interdependence <strong>of</strong> fishing and o<strong>the</strong>r sectors <strong>of</strong> <strong>the</strong> rural economy suggests that policies and development<br />
interventions aimed at raising fishermen’s incomes without addressing <strong>the</strong> wider context <strong>of</strong> rural poverty are unlikely to be<br />
successful or sustainable. Species-based <strong>fisheries</strong> <strong>management</strong> and development focused on <strong>the</strong> fishing enterprise would benefit<br />
from re-conceptualisation within a broader natural resource <strong>management</strong> and rural livelihoods framework.<br />
Introduction<br />
Many <strong>fisheries</strong> resources fluctuate dramatically from year to year due to climactic variability (e.g. Glantz, 1992;<br />
Bakun, 1998). There has long been widespread recognition that constant catch or constant effort approaches to<br />
<strong>management</strong>, based on <strong>the</strong> paradigm <strong>of</strong> an achievable optimum sustainable yield, are inappropriate for <strong>the</strong>se types <strong>of</strong><br />
fishery (e.g. Beddington & May, 1977; Larkin, 1977).<br />
The problem <strong>of</strong> variability in <strong>fisheries</strong>, and consequent uncertainty in future stock size estimates can be dealt with in<br />
one <strong>of</strong> two ways. Variability can be regarded as random ‘noise’ that obscures underlying steady-state dynamics, or<br />
its causes and patterns can be investigated, and <strong>the</strong> results <strong>of</strong> <strong>the</strong>se investigations incorporated into understanding, if<br />
not predicting, future stock and harvest levels.<br />
Although different <strong>fisheries</strong> are known to have very different patterns <strong>of</strong> catch series, <strong>the</strong>re have been few attempts<br />
to classify <strong>fisheries</strong> according to extent and patterns <strong>of</strong> variability. Caddy & Gulland (1983) classified <strong>fisheries</strong> as<br />
steady, cyclical, irregular and occasional. This latter category denotes so called ‘boom and bust’ stocks that sustain<br />
important <strong>fisheries</strong> episodically before disappearing for decades or even for centuries. More recently, <strong>the</strong>re have<br />
been attempts at formal statistical classifications <strong>of</strong> patterns <strong>of</strong> variation in catch or biomass time-series (Spencer &<br />
Collie, 1998) and to link patterns <strong>of</strong> variation with fish life-history parameters (Kawasaki, 1983). This work has<br />
interesting implications for <strong>fisheries</strong> <strong>management</strong>, as it suggests that different <strong>management</strong> targets may be<br />
appropriate for different fishery types.<br />
Interpreting <strong>the</strong> different categories <strong>of</strong> <strong>fisheries</strong> in terms <strong>of</strong> <strong>the</strong> factors that could drive different patterns <strong>of</strong><br />
variability (DeAngelis & Waterhouse, 1987) suggests that steady and cyclical <strong>fisheries</strong> are likely to be driven<br />
primarily by biotic interactions (e.g. stock-recruitment relationships and catch-effort relationships). Irregular and<br />
occasional stocks could be ei<strong>the</strong>r chaotic systems driven by strong biotic interactions (feedbacks), or systems where<br />
biotic interactions are relatively unimportant, and abiotic factors are <strong>the</strong> main influence on stock dynamics. If <strong>the</strong><br />
latter explanation for <strong>the</strong> dynamic behaviour <strong>of</strong> fluctuating stocks is accepted, <strong>management</strong> based on regulation <strong>of</strong><br />
biotic interactions (e.g. <strong>the</strong> effect <strong>of</strong> harvesting effort on future stock size) is much less relevant.<br />
This paper sets out to examine whe<strong>the</strong>r certain <strong>fisheries</strong> in Africa’s Inland waters are strongly influenced by climatic<br />
fluctuations, such that <strong>the</strong> use <strong>of</strong> <strong>management</strong> based on standard equilibrium fishery models may be problematic.<br />
The paper <strong>the</strong>n explores <strong>the</strong> fishery implications <strong>of</strong> climate-driven stock fluctuations, through analysis <strong>of</strong><br />
fisherfolks’ livelihood strategies in Malawi, derived from both primary fieldwork and published information.
67<br />
Lake Malawi Fisheries Management Symposium - Proceedings<br />
Finally, <strong>the</strong> paper draws out some preliminary policy and <strong>management</strong> implications <strong>of</strong> <strong>the</strong>se observed livelihood<br />
strategies. These implications are framed against a context where <strong>fisheries</strong> policy and <strong>management</strong> in Malawi is<br />
undergoing a transition from centralised state-led <strong>management</strong> towards community-based or co-<strong>management</strong> (Sholtz<br />
et al., 1998; Allison et al. 2001).<br />
Africa's inland <strong>fisheries</strong><br />
Fish protein has made up approximately one fifth <strong>of</strong> <strong>the</strong> animal protein consumed in Africa since 1961 (FAO, 1996).<br />
However, <strong>the</strong> contribution from inland waters has risen from less than 25 per cent in 1951 to 41 per cent <strong>of</strong> domestic<br />
fish production in 1994. In absolute terms, inland <strong>fisheries</strong> production has soared from 250 000 tonnes in 1950 to<br />
almost 1 500 000 (FAO, 1996).<br />
In recent years, Africa's inland <strong>fisheries</strong> have produced <strong>the</strong> majority <strong>of</strong> fish consumed in many African countries and<br />
almost all <strong>of</strong> that consumed in Mali, Chad and East Africa (Figure 1). Africa's inland <strong>fisheries</strong> are important not only<br />
as a source <strong>of</strong> food, but as a source <strong>of</strong> employment and income for resource poor families. They are exploited almost<br />
entirely by artisanal fishing communities in predominantly rural areas. In 1996 FAO estimated that <strong>the</strong> number <strong>of</strong><br />
canoes operated by artisanal fishers in Africa's inland waters had increased by 40 per cent in <strong>the</strong> preceding decade<br />
and that most freshwater <strong>fisheries</strong> were intensively exploited.<br />
" As fishing effort continues to respond to <strong>the</strong> growing demand for fish, proper inland <strong>fisheries</strong> <strong>management</strong> is<br />
becoming more and more urgent." (FAO, 1996: 10-36).<br />
‘Proper <strong>fisheries</strong> <strong>management</strong>’ in this context has usually meant <strong>management</strong> for equilibrium production targets<br />
such as maximum sustainable yield, with measures to achieve <strong>the</strong>se targets enforced by <strong>the</strong> State (e.g., for Lake<br />
Malawi, Tweddle & Magasa, 1989; FAO, 1993; GOM, 1999).<br />
While <strong>fisheries</strong> <strong>management</strong> in Africa shows an increasing interest in community and co-<strong>management</strong> strategies<br />
(e.g. Normann, Nielsen & Sverdrup-Jensen, 1998), <strong>the</strong>se approaches too, are <strong>of</strong>ten based on unjustified assumptions<br />
about static equilibria and livelihoods based entirely on fishing. These assumptions lead to uncritical promotion <strong>of</strong><br />
territorial use rights in undifferentiated and idealised constructs <strong>of</strong> a ‘community’ united by fishing interests (Allison<br />
& Ellis, 2001). The assumption in both cases is that fish yields can be both optimised and stabilised by better<br />
<strong>management</strong>. This does not allow for <strong>the</strong> possibility that optimal strategies may be opportunistic and ‘unstable’ in<br />
<strong>the</strong> conventional sense.<br />
Figure 1: Inland fish production as a proportion <strong>of</strong> fish supply available per caput in sub-Saharan Africa,<br />
1994 (Adapted from FAO, 1996).
68<br />
Lake Malawi Fisheries Management Symposium - Proceedings<br />
Climate and fishery fluctuations in Africa’s inland waters<br />
Conventional <strong>fisheries</strong> <strong>management</strong> in industrialised countries over <strong>the</strong> last 40 to 50 years has been based directly,<br />
or conceptually, on <strong>the</strong> Gordon-Shaefer bioeconomic equilibrium model and its derivatives (Figure 2). This model<br />
proposes an equilibrium between catch and fishing effort, so that fishing effort can be regulated to achieve a<br />
maximum sustainable yield (FMSY), maximum economic yield (FMEY) and related targets. Failure to regulate fishing<br />
effort is thought to lead to a situation where fishing effort tends towards <strong>the</strong> point where economic returns from <strong>the</strong><br />
fishery equal <strong>the</strong> costs <strong>of</strong> exploiting <strong>the</strong> resource – <strong>the</strong> ‘open access equilibrium’ (FOAE). If signals <strong>of</strong> resource<br />
scarcity are distorted or masked by subsidies to <strong>the</strong> fishing industry (in <strong>the</strong> forms <strong>of</strong> grants for modernising fishing<br />
technology, compensation for poor fishing seasons etc), <strong>the</strong>n fishing effort can even exceed <strong>the</strong> open access<br />
equilibrium, possibly leading to stock extinction.<br />
Although <strong>the</strong> Gordon-Shaefer model provides an elegant and persuasive overview <strong>of</strong> how a fishery bioeconomic<br />
system works, it has been extensively criticised for failing to provide <strong>the</strong> basis for successful <strong>fisheries</strong> <strong>management</strong>.<br />
There are many practical difficulties with <strong>the</strong> model: it is difficult to identify <strong>the</strong> target reference points until <strong>the</strong>y<br />
have been exceeded; it is difficult to dis-aggregate <strong>the</strong> models in <strong>fisheries</strong> where one stock is fished by many fleets,<br />
or one fleet fishing many stocks; and it is based on catch and effort data that are <strong>of</strong>ten unreliable (Hilborn &<br />
Walters, 1992). There are also <strong>the</strong> <strong>the</strong>oretical difficulties with <strong>the</strong> equilibrium assumptions, outlined in Section 2,<br />
above. All <strong>the</strong>se problems have led some to question whe<strong>the</strong>r <strong>the</strong> model itself, as well as <strong>the</strong> fishery <strong>management</strong><br />
systems that are built on its basis, may not be appropriate to some <strong>fisheries</strong> - particularly those that fluctuate<br />
extensively (e.g. Sarch & Allison, 2000).<br />
How applicable are bioeconomic equilibrium (or surplus-production) models to African Inland <strong>fisheries</strong>? Three <strong>of</strong><br />
<strong>the</strong> most important aquatic production systems in inland Africa are shallow <strong>lake</strong>s, river floodplains, and <strong>the</strong> pelagic<br />
zones <strong>of</strong> large <strong>lake</strong>s. It is also <strong>the</strong> <strong>fisheries</strong> <strong>of</strong> <strong>the</strong>se systems that undergo <strong>the</strong> most pronounced climate-induced<br />
fluctuations (Kalk, McLachlan & Howard-Williams, 1979; Plisnier, 1997; Sarch & Birkett, 2000). By contrast,<br />
<strong>fisheries</strong> based on longer-lived, larger sized fish in demersal ecosystems in many <strong>of</strong> <strong>the</strong> larger and deeper African<br />
<strong>lake</strong>s seem more likely to fit with prevailing notions <strong>of</strong> equilibrium dynamics and <strong>the</strong> conventional fish stock<br />
<strong>management</strong> approaches based on <strong>the</strong>m. There is a reasonable body <strong>of</strong> evidence suggesting that <strong>fisheries</strong> are<br />
significantly impacting productivity in <strong>the</strong>se latter systems (reviewed in Pitcher & Hart, 1995), which is not <strong>the</strong> case<br />
for <strong>the</strong> more variable <strong>fisheries</strong> we consider in this paper.<br />
Malawi, and <strong>the</strong> African Lakes region more generally, contain important examples <strong>of</strong> all <strong>the</strong>se types <strong>of</strong> fishery<br />
system, although river floodplain <strong>fisheries</strong> are poorly documented in <strong>the</strong> region. In this paper, we use Lake Chilwa<br />
and <strong>the</strong> pelagic <strong>fisheries</strong> <strong>of</strong> Lake Tanganyika to illustrate <strong>the</strong> possible influence <strong>of</strong> climate variability <strong>of</strong> <strong>fisheries</strong> in<br />
shallow <strong>lake</strong>s and <strong>the</strong> pelagic zones <strong>of</strong> <strong>the</strong> Great Lakes, respectively.<br />
Figure 2: The Gordon-Shaefer bioeconomic equilibrium model (Gordon, 1954; Shaefer, 1954) as a basis<br />
for <strong>fisheries</strong> <strong>management</strong>.
69<br />
Lake Malawi Fisheries Management Symposium - Proceedings<br />
Lake level fluctuations and <strong>fisheries</strong> at Lake Chilwa<br />
Africa’s shallow <strong>lake</strong>s are among <strong>the</strong> most productive fishery ecosystems in <strong>the</strong> tropics (Talling & Lemoalle, 1998).<br />
They are also prone to periodic <strong>lake</strong> level fluctuation, even to complete drying out in low-rainfall years. Most inland<br />
water ecosystems (with <strong>the</strong> exception <strong>of</strong> <strong>the</strong> African Great Lakes) are young, in geological and evolutionary terms,<br />
with an adaptable, resilient flora and fauna. They are, in a sense, pre-adapted to cope with a degree <strong>of</strong> humaninduced<br />
change (Moss, 1992). This resilience is a feature not <strong>of</strong>ten emphasised in <strong>fisheries</strong> analyses, typically preoccupied<br />
with stability as a <strong>management</strong> objective (Shepherd, 1991).<br />
Lake Chilwa is in many ways typical <strong>of</strong> <strong>the</strong> shallower African Lakes. The Lake has recently fluctuated around 1850<br />
km 2 including both open-water and wetland areas, is less than 3 m deep, and is subject to extreme fluctuations,<br />
including complete desiccation (Lancaster, 1979). In good years, fish catches can be as high as 25 000 tonnes<br />
(fishery statistics are ra<strong>the</strong>r uncertain and vary between sources) and more than 10 000 people are engaged in fishing<br />
activities. There was a major increase in fishing effort around <strong>the</strong> early 1970s, as <strong>the</strong> region became better integrated<br />
into <strong>the</strong> market economy. Minor recessions in <strong>lake</strong> level, sufficient to reduce fishing for one or two years, can be<br />
expected every six years or so (see Figure 3). Major recessions which will interfere with fishing in <strong>the</strong> open <strong>lake</strong> for<br />
3-5 years can be expected every 60-70 years, with a possibility <strong>of</strong> an intermediate recession in 30-40 years<br />
(Lancaster, 1979). The last drying episode covered <strong>the</strong> period from late 1994 to 1996, when fishing ceased<br />
altoge<strong>the</strong>r. Fishing operations started again in April 1997 (GOM, 1999).<br />
Catch (metric tonnes)<br />
25000<br />
20000<br />
15000<br />
10000<br />
5000<br />
0<br />
1960 1965 1970 1975 1980 1985 1990 1995 2000<br />
Figure 3. Catch fluctuations (shaded bars) and <strong>lake</strong> level variations in Lake Chilwa, Malawi 1962-1998.<br />
Note also that <strong>the</strong> <strong>lake</strong> gauging system was changed in 1989, and <strong>the</strong> <strong>lake</strong> level measurements from this<br />
period onwards may not be directly comparable with those in previous years (lower apparent amplitude <strong>of</strong><br />
fluctuation). Fisheries data from Department <strong>of</strong> Fisheries, GOM (1999); Lake Level Data from<br />
Environmental Affairs Department (2000).<br />
Climate and <strong>fisheries</strong> in <strong>the</strong> pelagic zones <strong>of</strong> <strong>the</strong> African Great Lakes<br />
The <strong>fisheries</strong> for small pelagic fish in Africa’s Great Lakes are among <strong>the</strong> most important on <strong>the</strong> continent,<br />
supplying dried fish (variously known as kapenta, usipa, dagaa or omena according to species and region) to<br />
markets throughout much <strong>of</strong> East and central/sou<strong>the</strong>rn Africa. Anecdotal evidence, oral histories, ecosystem and<br />
environment studies and government fishery statistics all support <strong>the</strong> notion that <strong>of</strong> <strong>the</strong>se small clupeids and<br />
cyprinids fluctuates extensively from year to year, in response to climate-driven variations in primary and secondary<br />
biological productivity (Tweddle & Lewis, 1990; Allison et al., 1995; Plisnier, 1997).<br />
12.0<br />
10.0<br />
8.0<br />
6.0<br />
4.0<br />
2.0<br />
0.0<br />
Lake level (m)
70<br />
Lake Malawi Fisheries Management Symposium - Proceedings<br />
An important study by Plisnier (1997) documents <strong>the</strong> relationship between fluctuations in stock size (measured by<br />
proxy as variations in commercial purse-seine CPUE) and <strong>the</strong> Sou<strong>the</strong>rn Oscillation Index (Figure 4), demonstrating<br />
<strong>the</strong> important link between stock size and climate variations in pelagic <strong>fisheries</strong>. Evidence <strong>of</strong> climate-productivity<br />
links in Lake Malawi’s pelagic <strong>fisheries</strong> are based on less extensive data, but imply a link between wind-stress,<br />
upwelling, and fish production (Tweddle & Lewis, 1990; Allison et al., 1995; Irvine et al., 2001).<br />
CPUE Anomaly (Tonnes/boat)<br />
0.60<br />
0.50<br />
0.40<br />
0.30<br />
0.20<br />
0.10<br />
0.00<br />
-0.10<br />
-0.20<br />
-0.30<br />
1976<br />
1977<br />
1978<br />
1979<br />
1980<br />
1981<br />
1982<br />
1983<br />
1984<br />
1985<br />
1986<br />
1987<br />
1988<br />
1989<br />
1990<br />
1991<br />
1992<br />
1993<br />
1994<br />
Figure 4. The relationship between stock abundance anomalies <strong>of</strong> small pelagic fish (clupeids) in<br />
Nor<strong>the</strong>rn Lake Tanganyika (�), measured as <strong>the</strong> differences from <strong>the</strong> long-term average in Catch per unit<br />
<strong>of</strong> fishing effort by <strong>the</strong> Bujumbura-based industrial purse-seine fishery in Nov-Jan, and <strong>the</strong> Sou<strong>the</strong>rn<br />
Oscillation Index or ‘El Niño effect’ (�) in <strong>the</strong> previous Feb-March. The correlation coefficient <strong>of</strong> 0.62 is<br />
highly significant. (Redrawn from Plisnier, 1997).<br />
Given <strong>the</strong> highly variable rainfall and wind regime in sub-Saharan Africa (Conway, in press) and <strong>the</strong> evidence for<br />
existence <strong>of</strong> strong climate-fish production relationships, <strong>the</strong>re is case to made for <strong>fisheries</strong> research and<br />
<strong>management</strong> agencies to incorporate fish production-climate linkages in <strong>the</strong>ir programmes. These could provide<br />
more relevant scientific information than <strong>the</strong> current efforts at estimating parameters for use in single-species<br />
steady-state fishery assessment models.<br />
While <strong>the</strong>re has been significant recent interest (if not formal research) in understanding <strong>the</strong> causes <strong>of</strong> variability in<br />
<strong>the</strong>se <strong>fisheries</strong>, <strong>the</strong>re has been little published work on <strong>the</strong> consequences <strong>of</strong> that variability for those involved in<br />
catching, processing, distribution, sale and consumption <strong>of</strong> fish. It is this gap in <strong>management</strong>-related research that<br />
we aim to address through work on <strong>the</strong> livelihood strategies <strong>of</strong> fisherfolk dependent on fluctuating resources.<br />
The livelihoods approach and research methodology<br />
The origins <strong>of</strong> <strong>the</strong> livelihoods approach<br />
The livelihoods approach has its origins partly in a literature concerned with understanding <strong>the</strong> differential capability<br />
<strong>of</strong> rural families to cope with crises such as droughts, floods, or plant and animal pests and diseases. This literature<br />
focuses attention on <strong>the</strong> assets <strong>of</strong> rural people, and how different patterns <strong>of</strong> asset holding (land, stock, food stores,<br />
savings etc.) can make big differences to <strong>the</strong> ability <strong>of</strong> families to withstand shocks (Swift, 1989). This set <strong>of</strong><br />
concerns also links to <strong>the</strong> concept <strong>of</strong> vulnerability; defined as a high degree <strong>of</strong> exposure to risk, shocks and stress<br />
and proneness to food insecurity (Chambers, 1989; Davies, 1996). Vulnerability has <strong>the</strong> dual aspect <strong>of</strong> external<br />
threats to livelihood security due to risk factors such a climate, markets or sudden disaster; and internal coping<br />
capability determined by assets, food stores, support from kin or community, or government safety net policies.<br />
4.0<br />
3.0<br />
2.0<br />
1.0<br />
0.0<br />
-1.0<br />
-2.0<br />
-3.0<br />
-4.0<br />
Sou<strong>the</strong>rn Oscillation Index
71<br />
Lake Malawi Fisheries Management Symposium - Proceedings<br />
The approach also borrows ideas from an ecological literature concerned with <strong>the</strong> sustainability <strong>of</strong> ecosystems or<br />
agroecological systems (Holling, 1973; Conway, 1987). Here, sustainability is defined as “<strong>the</strong> ability <strong>of</strong> a system to<br />
maintain productivity in spite <strong>of</strong> a major disturbance, such as is caused by intensive stress or a large perturbation”<br />
(Conway, 1985). The concepts <strong>of</strong> resilience and sensitivity as livelihood attributes also originate in this context<br />
(Bayliss-Smith, 1991). Resilience refers to <strong>the</strong> ability <strong>of</strong> an ecological or livelihood system to “bounce back” from<br />
stress or shocks; while sensitivity refers to <strong>the</strong> magnitude <strong>of</strong> a system’s response to an external disturbance. It<br />
follows from <strong>the</strong>se ideas that <strong>the</strong> most robust livelihood system is one displaying high resilience and low sensitivity;<br />
while <strong>the</strong> most vulnerable displays low resilience and high sensitivity. These ideas are relevant to fishery-based<br />
livelihoods, as will become apparent in due course.<br />
The concept <strong>of</strong> ‘a livelihood’ seeks to bring toge<strong>the</strong>r <strong>the</strong> critical factors that affect <strong>the</strong> vulnerability or strength <strong>of</strong><br />
individual or family survival strategies. These are thought to comprise, chiefly, <strong>the</strong> assets possessed by people, <strong>the</strong><br />
activities in which <strong>the</strong>y engage in order to generate an adequate standard <strong>of</strong> living and to satisfy o<strong>the</strong>r goals such as<br />
risk reduction, and <strong>the</strong> factors that facilitate or inhibit different people from gaining access to assets and activities.<br />
These considerations result in <strong>the</strong> following definition <strong>of</strong> a livelihood (Ellis, 2000, p.10):<br />
“A livelihood comprises <strong>the</strong> assets (natural, physical, human, financial and social capital), <strong>the</strong> activities, and <strong>the</strong><br />
access to <strong>the</strong>se (mediated by institutions and social relations) that toge<strong>the</strong>r determine <strong>the</strong> living gained by <strong>the</strong><br />
individual or household.”<br />
The livelihoods approach is typically set out in <strong>the</strong> form <strong>of</strong> a framework that brings toge<strong>the</strong>r <strong>the</strong> principal<br />
components that are thought to comply with <strong>the</strong> livelihoods definition, as well as demonstrating <strong>the</strong> interactions<br />
between <strong>the</strong>m. There are many different diagrammatic representations <strong>of</strong> this framework (e.g. Carney, 1998;<br />
Scoones, 1998; Reardon & Vosti, 1995). Here, <strong>the</strong> framework is summarised in tabular form (Table 1).<br />
The reference social scope <strong>of</strong> this framework is typically considered to be <strong>the</strong> extended household, including<br />
members who are away from home but send remittances back to <strong>the</strong> resident homestead. The starting point <strong>of</strong> <strong>the</strong><br />
framework are <strong>the</strong> assets owned, controlled, claimed, or in some o<strong>the</strong>r means accessed by <strong>the</strong> household (column A<br />
in Table 1). The livelihoods framework recognises five main asset categories, comprising physical capital<br />
(sometimes also called produced capital or economic capital); natural capital (land, trees, fish stocks etc); human<br />
capital (people, education and health); financial capital (savings, credit); and social capital (kinship networks,<br />
associations).<br />
Access to both assets and activities is enabled or hindered by <strong>the</strong> policy and institutional context <strong>of</strong> livelihoods,<br />
including social relations, institutions and organisations (column B). It is also affected by external factors,<br />
sometimes referred to as <strong>the</strong> vulnerability context, comprising trends and shocks that are outside <strong>the</strong> control <strong>of</strong> <strong>the</strong><br />
household (column C). Assets permit livelihood strategies to be constructed, and <strong>the</strong>se are composed <strong>of</strong> a portfolio<br />
<strong>of</strong> activities, some <strong>of</strong> which may be natural resource based and o<strong>the</strong>rs not so (column E). Finally, this framework<br />
points to outcomes <strong>of</strong> livelihood strategies, distinguished here between livelihood security effects and environmental<br />
sustainability effects (column F).<br />
The livelihoods <strong>of</strong> artisanal fisherfolk are readily described by this type <strong>of</strong> framework. In this instance, key assets<br />
are fishing gears (boats and nets), although many artisanal fishers may also possess land and combine fishing with<br />
farming (Bailey & Pomeroy, 1996). The policy and institutional context <strong>of</strong> artisanal fishing includes, but is not<br />
limited to, <strong>the</strong> role <strong>of</strong> state regulations and ‘community’ based rules that affect access to resources. Social relations<br />
can also determine who has access to fishing opportunities (e.g. <strong>the</strong> ethnicity <strong>of</strong> fishing families may differ from<br />
o<strong>the</strong>r families in coastal communities, and roles within fishing activities are <strong>of</strong>ten strongly gender-differentiated).<br />
Fishing families are no less prone than o<strong>the</strong>r rural dwellers to adverse events and trends, with natural fluctuations in<br />
fish stocks being especially critical for <strong>the</strong>m. Finally, fishing families <strong>of</strong>ten engage in diverse activities in order to<br />
achieve livelihood security – an important attribute that we will return to in <strong>the</strong> context <strong>of</strong> <strong>fisheries</strong> <strong>management</strong>.
72<br />
Lake Malawi Fisheries Management Symposium - Proceedings<br />
Table 1: A framework for micro policy analysis <strong>of</strong> rural livelihoods (modified from Ellis, 2000, p 30).<br />
A B C D E F<br />
Livelihood Access In context Resulting Composed With effects<br />
platform modified by <strong>of</strong> in <strong>of</strong> on<br />
social relations<br />
gender trends livelihood security<br />
class population NR based activities income level<br />
age migration fishing income stability<br />
assets ethnicity technological change cultivation (food) seasonality<br />
relative prices cultivation (non-food) degrees <strong>of</strong> risk<br />
natural capital macro policy livestock<br />
national econ trends nonfarm NR<br />
physical capital institutions world econ trends<br />
rules & customs<br />
Livelihood<br />
human capital<br />
land and sea tenure<br />
Strategies<br />
financial capital markets in practice<br />
shocks non-NR based<br />
social capital<br />
organisations<br />
storms<br />
recruitment failures<br />
rural trade<br />
o<strong>the</strong>r services<br />
rural manufacture<br />
env. sustainability<br />
soils & land quality<br />
associations<br />
NGOs<br />
local admin<br />
diseases<br />
civil war<br />
remittances<br />
o<strong>the</strong>r transfers<br />
water<br />
fish stocks<br />
forests<br />
state agencies biodiversity<br />
Fishing livelihoods research in Malawi<br />
The livelihoods approach is utilised in many different ways, according to <strong>the</strong> goal <strong>of</strong> <strong>the</strong> study or programme. In<br />
development practice, it is being used as a ‘process’ tool to enable participants in development programmes to<br />
identify key constraints and opportunities for development intervention (Ashley & Carney, 1999). In this paper, we<br />
use <strong>the</strong> livelihoods approach as a conceptual tool to interpret published literature on Lake Chilwa <strong>fisheries</strong>, and as a<br />
primary research tool to understand <strong>the</strong> livelihoods <strong>of</strong> people engaged in small-scale fishing on <strong>the</strong> shores <strong>of</strong> Lake<br />
Malawi.<br />
Livelihoods research utilises a range <strong>of</strong> existing methodologies in <strong>the</strong> social and economic sciences, and can<br />
essentially be regarded as a framework to organise <strong>the</strong>se methodologies in such a way as to reduce sectoral and<br />
disciplinary biases. The research methods used for Lake Malawi include combination <strong>of</strong> qualitative and quantitative<br />
techniques.<br />
Assets were determined at household level by administration <strong>of</strong> questionnaires drawn from survey methods used in<br />
agricultural economics. Relatively small sample-sizes were used (typically 40 households per village) to ensure that<br />
data quality was maintained and good relationships between enumerators and respondents could be fostered. The<br />
small sample sizes also meant that each questionnaire could be verified by return visits to households if necessary.<br />
Sample selection was based on stratification following wealth ranking (based on people’s self-defined criteria), to<br />
ensure that poorer households are included in <strong>the</strong> research. Based on people's own definition <strong>of</strong> wealth, three<br />
categories emerged, namely (a) <strong>the</strong> well to do (wopeza bwino), (b) <strong>the</strong> better <strong>of</strong>f (wopeza bwinno pang'ono) and (c)<br />
<strong>the</strong> poor (wosauka). The criteria depend a lot on who has what and who does not have what. The well to do, were<br />
people that had some form <strong>of</strong> capital that enabled <strong>the</strong>m to engage in some productive activities like fishing and<br />
small-scale businesses. They were said to have enough food, live in good houses, own some livestock and could<br />
afford to send <strong>the</strong>ir children to school. The poor were said to be lacking in most things and <strong>the</strong>y did not have<br />
anything to enable <strong>the</strong>m to engage in pr<strong>of</strong>itable productive activities. They <strong>of</strong>ten did not have enough food and had<br />
poor housing.<br />
Three sites were purposely selected along <strong>the</strong> shores <strong>of</strong> Lake Malawi. The sites were Msaka in <strong>the</strong> Sou<strong>the</strong>rn Region<br />
district <strong>of</strong> Mangochi, Lifuu in Salima (Central Region) and Tukombo in Nkhata Bay (Nor<strong>the</strong>rn Region).<br />
A range <strong>of</strong> qualitative tools drawn from Rapid and Participatory Rural Appraisal (RRA/PRA) and institutional<br />
analysis were used to investigate how access to assets is modified by social relations, institutions and organisations.<br />
These included wealth ranking, focus groups, key informant interviews, institutional mapping and ranking <strong>of</strong><br />
organisations’ effectiveness. Trends and shocks were analysed by documenting experiences described in focus
73<br />
Lake Malawi Fisheries Management Symposium - Proceedings<br />
group discussions, <strong>the</strong> use <strong>of</strong> relevant secondary social and economic data and <strong>the</strong> analysis <strong>of</strong> <strong>the</strong> political and<br />
macro-economic context (Allison et al., 2001).<br />
Resultant livelihood strategies were described through analysis <strong>of</strong> income sources (including gifts, remittances and<br />
exchanges) from household questionnaires, and <strong>the</strong> decision-making processes that lead to choice or adoption <strong>of</strong><br />
<strong>the</strong>se strategies were explored at both intra-household and village-level.<br />
Although <strong>the</strong> household questionnaires can provide only a ‘snapshot’ <strong>of</strong> current livelihood strategies, this was<br />
complemented by qualitative investigation <strong>of</strong> dynamic change, pursued though semi-structured interviews and focus<br />
group sessions, and through documentation <strong>of</strong> individual life-stories.<br />
Effects <strong>of</strong> chosen, or enforced, strategies on both livelihood security and environmental sustainability were<br />
investigated through existing monitoring systems, such as district and national production statistics and indicators <strong>of</strong><br />
poverty or well-being.<br />
The research aims to investigate institutional factors that block or enhance people’s ability to pursue a sustainable<br />
livelihood so that policy and development intervention can address <strong>the</strong>se constraints and opportunities.<br />
Livelihoods analysis in Malawi – results<br />
Lake Chilwa livelihoods<br />
Kalk et al. (1979) <strong>of</strong>fer an interesting insight into livelihood responses to fishery fluctuation during <strong>the</strong> 1960s and<br />
1970s at a time <strong>of</strong> gradual transition from quasi-subsistence to a partial cash economy in this area <strong>of</strong> Malawi. This<br />
insight does not appear to have been transferred to current fishery <strong>management</strong> initiatives. The <strong>fisheries</strong> <strong>of</strong> Lake<br />
Chilwa <strong>of</strong>fer an economically unstable environment, determined by <strong>the</strong> seasonal and long-term fluctuations in <strong>lake</strong><br />
level. Yet, at high production periods, <strong>the</strong> <strong>fisheries</strong> permitted readily earned cash, with “a substantial number <strong>of</strong><br />
men gained an income five or more times greater than that prevailing for unskilled or agricultural labour” (Chipeta,<br />
1972). In good years, Lake Chilwa supplies almost half <strong>the</strong> total fish production in Malawi, where fish is said to<br />
supply around 70% <strong>of</strong> animal protein in <strong>the</strong> diets <strong>of</strong> 12 million people (GOM, 1999).<br />
Fishing in Malawi is largely a business, not a subsistence activity (Ferguson et al., 1993). Management that<br />
constrains access to fish in productive periods constrains income-generating opportunities, denies people access to<br />
much-needed protein and serves no conservation purpose in a <strong>lake</strong> where <strong>the</strong> sustainable yield concept is obviously<br />
untenable. And yet, despite wide-spread acceptance that <strong>fisheries</strong> <strong>management</strong>, in its traditional guise <strong>of</strong> stock<br />
conservation measures, is inappropriate, <strong>the</strong>re have been recent measures to introduce fishery closures to allow<br />
recovery after drying periods (even though recovery in <strong>the</strong> past has been rapid). Various gear and mesh-size<br />
restrictions have also been introduced, apparently at <strong>the</strong> behest <strong>of</strong> fishing communities around <strong>the</strong> <strong>lake</strong>, who<br />
participate in an evolving co-<strong>management</strong> scheme with <strong>the</strong> Fisheries Department (Sholtz et al., 1998).<br />
Work reviewed by Agnew (1979) and Agnew & Chipeta (1979) provide a useful baseline from which to review <strong>the</strong><br />
likely choices available to people in <strong>the</strong> latest drying episode, and how <strong>the</strong>se might have been impacted by new<br />
<strong>management</strong> initiatives. These authors summarise <strong>the</strong> short-term choices <strong>of</strong> fishermen during <strong>the</strong> <strong>lake</strong>-drying period<br />
<strong>of</strong> 1967-68 as: 1) fishing on a very much reduced scale in <strong>the</strong> remaining swamps, streams and lagoons in <strong>the</strong> Chilwa<br />
catchment, 2) transfer to nearby Lakes Malombe, Malawi or Chiuta, 3) increasing <strong>the</strong> cultivation <strong>of</strong> rice, cotton,<br />
cassava and vegetables 4) a switch over to commercial handicrafts such as plaiting carpets, 5) spending considerable<br />
time trapping birds and digging for rodents or 6) seeking employment elsewhere. These responses varied according<br />
to income status, asset pr<strong>of</strong>iles, ethnicity and time <strong>of</strong> residence in <strong>the</strong> area.<br />
In <strong>the</strong> drying episode <strong>of</strong> 1968, around 200 fishermen migrated to nearby Lake Malombe, and o<strong>the</strong>rs moved to Lake<br />
Malawi. These were among <strong>the</strong> richest fishermen, whose investment in fishing-related assets meant that <strong>the</strong>y could<br />
not simply cease fishing, as could those with a lower stake in this source <strong>of</strong> livelihood. Since <strong>the</strong> introduction <strong>of</strong><br />
community-based <strong>management</strong> in Lake Malombe and Sou<strong>the</strong>rn Lake Malawi (Sholtz et al. 1998, Chirwa, 1998), <strong>the</strong><br />
option to move fishing operations between <strong>lake</strong>s is constrained. That this may also prevent Malombe’s fishermen<br />
from migrating to Chilwa in productive years, <strong>the</strong>reby relieving pressure on this intensely exploited <strong>lake</strong>, does not<br />
appear to have been explicitly considered.
74<br />
Lake Malawi Fisheries Management Symposium - Proceedings<br />
The repercussions <strong>of</strong> recession in Lake Chilwa waters and consequent decline <strong>of</strong> fishing are much wider than on<br />
fishing alone. The whole <strong>of</strong> <strong>the</strong> Chilwa plains and <strong>lake</strong> must be seen as an economic network. Not only are <strong>the</strong>re<br />
links between fishing and various ancillary services, but also complementary flows <strong>of</strong> income between fishing and<br />
farming. The successful fishermen had larger gardens and produced more cash crops than o<strong>the</strong>r fishermen (Phipps<br />
1973). Recognition that <strong>the</strong>re is an “integrated small-scale economy <strong>of</strong> farming, fishing and cattle-rearing” (Kalk,<br />
1979; p15) does not seem to have led to any specific policy support for <strong>the</strong>se diversified livelihoods. Instead,<br />
sectoral concerns for <strong>the</strong> sustainability <strong>of</strong> individual natural resource systems have prevailed, even when it is known<br />
that notions <strong>of</strong> resource sustainability are questionable. “The Chilwa fishes are clearly well fitted to persist in <strong>the</strong><br />
unpredictable Chilwa ecosystem, provided <strong>the</strong> refugium <strong>of</strong> swamps and streams is maintained”, according to Moss,<br />
(1979, p411), with Kalk (1979, p431) adding: “Man must remain as generalised in activity as <strong>the</strong> <strong>lake</strong> fauna in order<br />
to succeed in <strong>the</strong> Chilwa area”.<br />
Moss (1979) also cautions that more dangerous than overfishing in this resilient system were threats to <strong>the</strong> swamps<br />
through ‘reclamation’ for agriculture or perhaps as irrigation reservoirs, siltation through changes in catchment land<strong>management</strong>,<br />
and pesticides. It is <strong>the</strong>se threats that have led to recent interest in environmental <strong>management</strong> in <strong>the</strong><br />
Chilwa wetland, and its designation as a Ramsar site. (Environmental Affairs Department, 2000).<br />
The EAD report reiterates <strong>the</strong> perceived resilience <strong>of</strong> <strong>the</strong> system. However, in an analysis <strong>of</strong> <strong>fisheries</strong> issues (EAD,<br />
2000, Table 5.2), <strong>the</strong> report highlights “Ignorance, Poverty, Corruption, Migratory fishermen and Lack <strong>of</strong><br />
Resources” as barriers to sustainable utilisation <strong>of</strong> fishery resources, and recommends <strong>the</strong> implementation <strong>of</strong><br />
“community-based natural resource <strong>management</strong> for <strong>the</strong> benefit <strong>of</strong> <strong>the</strong> local people”. There is clearly some<br />
difficulty in accepting that migration may be a legitimate and sustainable strategy to maximise benefits from a<br />
fluctuating resource, a factor that needs to be taken into account in <strong>the</strong> design <strong>of</strong> any community-based <strong>management</strong><br />
scheme.<br />
The mobility and livelihood flexibility <strong>of</strong> <strong>the</strong> fishing families making <strong>the</strong>ir living on <strong>the</strong> shores <strong>of</strong> Lake Chilwa in<br />
<strong>the</strong> 1970s enabled <strong>the</strong>m to respond to <strong>the</strong> extreme fluctuations observed. These were not mere ‘coping strategies’,<br />
but represent active opportunism – adaptations aimed at maximising <strong>the</strong> contribution <strong>of</strong> fishing to household<br />
incomes. It is not particularly useful to talk <strong>of</strong> <strong>the</strong> fish stocks as sustainable in <strong>the</strong> context <strong>of</strong> this level <strong>of</strong> ‘natural’<br />
fluctuation. Around Lake Chilwa, <strong>the</strong>re are large-scale shifts from fishing to farming, pastoralism and o<strong>the</strong>r occupations<br />
when <strong>the</strong> <strong>lake</strong> dries out (and back to fishing when it refills). Such strategies highlight <strong>the</strong> importance <strong>of</strong> enhancing or<br />
maintaining <strong>the</strong> flexibility <strong>of</strong> <strong>lake</strong>shore livelihoods ra<strong>the</strong>r than constraining it with fixed <strong>fisheries</strong> production quotas,<br />
seasons or areas.<br />
Livelihoods on <strong>the</strong> Lake Malawi shoreline<br />
In Malawi, usipa (Engraulicypris sardella) is found throughout <strong>the</strong> <strong>lake</strong>, but only supports substantial <strong>fisheries</strong> in<br />
inshore areas (Thompson et al., 1996; Thompson & Allison, 1997). These <strong>fisheries</strong> are mainly artisanal and carried<br />
out using chilimira seines set by two canoes or small ‘plank boats’. The fishery takes place mainly at night with<br />
light attraction. There is also a substantial daytime beach-seine fishery, <strong>of</strong>ten for juveniles. Landings statistics are<br />
thought to be unreliable and to underestimate <strong>the</strong> true importance <strong>of</strong> <strong>the</strong> fishery, which may reach 50 000 tonnes in<br />
good years (Tweddle & Lewis, 1990). The <strong>fisheries</strong> are known to fluctuate extensively, with fishers able to identify<br />
and refer to ‘good’ and ‘bad’ years for usipa. These seem to be linked to interannual differences in productivity<br />
(Tweddle & Lewis, 1990) which in turn are generated by variations in <strong>the</strong> strength <strong>of</strong> upwelling caused by variations<br />
in wind stress (Allison et al., 1995).<br />
Usipa are marketed largely in sun-dried form and, toge<strong>the</strong>r with <strong>the</strong> small pelagic species <strong>of</strong> o<strong>the</strong>r African <strong>lake</strong>s,<br />
contribute significantly to dietary protein throughout Central and Sou<strong>the</strong>rn Africa. The fishery is quite seasonal, and<br />
exploitation <strong>of</strong> ‘usipa’ is likely to form only part <strong>of</strong> <strong>the</strong> livelihoods <strong>of</strong> those catching it. Coupled with its interannual<br />
variability, this makes this species a useful case-study <strong>of</strong> a fluctuating fishery.<br />
Results from <strong>the</strong> survey show that livelihood diversification and mobility are key factors enabling fishers to ‘track’<br />
resource fluctuations in time and space. People along <strong>the</strong> Lake diversify in a number <strong>of</strong> activities including fishing,<br />
farming and different types <strong>of</strong> small-scale businesses.<br />
This type <strong>of</strong> movement has been adapted for sometime by fishers tracking a 'fluctuating resource'. In <strong>the</strong> case <strong>of</strong> <strong>the</strong><br />
usipa this has led to <strong>the</strong> establishment <strong>of</strong> special relations with people in different beaches. There are two types <strong>of</strong><br />
movements on Lake Malawi, ei<strong>the</strong>r long-term or short term. Long-term movement refers to fishers that have moved
75<br />
Lake Malawi Fisheries Management Symposium - Proceedings<br />
from <strong>the</strong>ir original homes and have established a permanent camp elsewhere. These <strong>of</strong>ten do not have access to land<br />
and thus rely solely on fish and to some extent small-scale business. With short-term movement fishers move in<br />
search <strong>of</strong> fish but operate from <strong>the</strong>ir original homes, only establishing temporary camps. Maintaining access to land,<br />
<strong>the</strong>y are able to return to farming during poor fishing periods. The map below shows <strong>the</strong> movement <strong>of</strong> fishers<br />
around Lifuu beach in Salima District.<br />
These strategies are well established and accepted around <strong>the</strong> Lake shore villages, where migrant fishers are seldom<br />
regarded as problematic, but are ra<strong>the</strong>r seen to bring benefits in <strong>the</strong> form <strong>of</strong> increased trade and economic activity in<br />
<strong>lake</strong> shore villages. Reciprocal access to fishing ‘beaches’ for landing catch and mending nets etc., may be more<br />
important to fishing-dependent communities than claims for territorial exclusivity <strong>of</strong> <strong>the</strong> type encouraged by efforts<br />
to promote community-based <strong>management</strong> (e.g. Sholtz et al. 1998). Such studies are urgently required around <strong>the</strong><br />
o<strong>the</strong>r African Great Lakes, if <strong>the</strong> laudable move towards co-<strong>management</strong> is to develop models for fishery<br />
<strong>management</strong> that reinforce sustainable livelihood strategies. There is a danger that <strong>the</strong> idealised concepts <strong>of</strong> villageowned<br />
fishing grounds currently being promoted don’t fit with <strong>the</strong> ecology <strong>of</strong> <strong>the</strong> fish or <strong>the</strong> livelihoods <strong>of</strong> <strong>the</strong><br />
fishers.<br />
Discussion<br />
The evidence for climate-induced fluctuations in <strong>the</strong> <strong>fisheries</strong> <strong>of</strong> shallow <strong>lake</strong>s, and for small pelagic fish in <strong>the</strong><br />
African Great Lakes indicate that <strong>the</strong> <strong>management</strong> <strong>of</strong> <strong>the</strong>se stocks needs to be informed by an understanding <strong>of</strong> how<br />
fishers, distribution chains and markets cope with fluctuating supplies. Most research on fluctuating stocks has been<br />
targeted at understanding in detail <strong>the</strong> mechanisms causing fluctuation in stock size. This is <strong>the</strong> study <strong>of</strong> fish
76<br />
Lake Malawi Fisheries Management Symposium - Proceedings<br />
recruitment processes and <strong>the</strong> environmental factors driving <strong>the</strong>m (e.g. Cushing, 1996). There has been much less<br />
emphasis on <strong>the</strong> study <strong>of</strong> <strong>the</strong> responses <strong>of</strong> fishers to stock size fluctuations (Allison & Ellis, 2001).<br />
Review <strong>of</strong> secondary data from <strong>the</strong> Lake Chilwa area, and preliminary analysis <strong>of</strong> primary fieldwork on <strong>the</strong> shores<br />
<strong>of</strong> Lake Malawi both reveal <strong>the</strong> importance <strong>of</strong> livelihood diversity and geographical mobility as livelihood strategies<br />
<strong>of</strong> artisanal fisherfolk. Mobility and diversity are required to sustain livelihoods when confronted with resource<br />
variability that is at least partially climate-induced. The Lake Chilwa case demonstrates that livelihood coping and<br />
optimisation strategies existed prior to introduction <strong>of</strong> both State-led and co- <strong>management</strong> systems. More recent<br />
information on <strong>the</strong> impact <strong>of</strong> <strong>fisheries</strong> <strong>management</strong> measures on livelihoods is lacking, but is currently being<br />
pursued by our research team.<br />
The results <strong>of</strong> our research in Malawi are in accord with findings in o<strong>the</strong>r developing countries, where several<br />
studies have suggested that fishers cope with fluctuations through geographical and occupational mobility (Bailey,<br />
1982; Haakonsen, 1992; Geheb & Binns, 1997; Sarch & Allison, 2000; Béné et al. 2000). Fisheries <strong>management</strong><br />
strategies which focus on optimal catch rates ignore both <strong>the</strong> role which inland <strong>fisheries</strong> play in <strong>the</strong> livelihoods <strong>of</strong><br />
many Africans and <strong>the</strong> inherent stock fluctuations which have shaped such livelihood strategies.<br />
Proposals to manage fluctuating <strong>fisheries</strong> need to be based on a better understanding <strong>of</strong> fisherfolk’s livelihood<br />
strategies. In <strong>fisheries</strong> where exploitation has little demonstrable impact on fish stocks, and productivity is closely<br />
linked with climate, it is not useful to talk about sustainable yields, or <strong>of</strong> fixed limits for fishing effort. Nei<strong>the</strong>r are<br />
community-based or co-managed territorial use rights, in <strong>the</strong> form <strong>of</strong> geographically fixed territories, useful for<br />
<strong>fisheries</strong> <strong>management</strong> in areas where <strong>lake</strong> or floodplain levels are highly variable, or where fishers have to track<br />
mobile pelagic resources to sustain <strong>the</strong>ir catch rates.<br />
In Malawi, realisation <strong>of</strong> <strong>the</strong> importance <strong>of</strong> fisherfolk’s mobility is leading to a move away from <strong>management</strong> based<br />
on beach village committees (Sholtz et al., 1998), towards larger spatial scales – <strong>lake</strong> <strong>management</strong> areas defined in<br />
terms <strong>of</strong> movements <strong>of</strong> range <strong>of</strong> operations <strong>of</strong> artisanal fishers, and on ecological criteria (Weyl, personal<br />
communication, 2001). The mechanisms for governance <strong>of</strong> <strong>the</strong>se <strong>lake</strong> spaces are still being discussed.<br />
It is relatively straightforward to outline what <strong>management</strong> approaches should not be taken, less easy to identify<br />
appropriate <strong>management</strong> support for sustainable livelihoods from fluctuating <strong>fisheries</strong>. While removing unnecessary<br />
impediments to sustainable opportunistic exploitation strategies is one important step, it may not be enough, given<br />
<strong>the</strong> increasing pressures on resources and livelihoods in Africa. Common property institutions that have evolved<br />
mechanisms, such as reciprocal access agreements between migrants, should be considered more appropriate than<br />
territory-based approaches as a way <strong>of</strong> implementing any effort-limitations deemed necessary. Even when<br />
embryonic and <strong>of</strong> limited functionality for resource conservation, such as in Malawi, such institutions can be built<br />
upon, ra<strong>the</strong>r than replaced by externally-conceived ‘perfect’ ones.<br />
Formal recognition, in national policy and legislation, <strong>of</strong> <strong>the</strong> legitimacy <strong>of</strong> opportunistic livelihood strategies,<br />
coupled with active removal <strong>of</strong> barriers to mobility and livelihood diversification would seem to be appropriate<br />
policy responses at national or district level. Active support for livelihood diversification (not <strong>the</strong> same as providing<br />
incentives for people to diversify out <strong>of</strong> fishing altoge<strong>the</strong>r) is ano<strong>the</strong>r <strong>management</strong> option.<br />
The apparently greater importance <strong>of</strong> climate, relative to fishing, in driving <strong>the</strong> dynamics <strong>of</strong> fish stocks in many <strong>of</strong><br />
Africa’s shallower wetlands (Sarch & Allison, 2000) also suggests that effort could be redirected at protecting<br />
wetland functions and broader ecosystem integrity and away from trying to manage fish stocks for sustainability.<br />
Management needs to lose its preoccupation with stability and gain an increased appreciation <strong>of</strong> resilience.<br />
‘Modern’ <strong>fisheries</strong> <strong>management</strong> has <strong>of</strong>ten consisted <strong>of</strong> setting stock conservation objectives, and <strong>the</strong>n finding means<br />
<strong>of</strong> modifying fishers’ behaviour or investment to fit <strong>the</strong>se objectives (Mahon, 1997). This has usually meant<br />
imposing closed seasons, closed areas, size limits, gear restrictions, access or ‘fishing effort’ restrictions. While<br />
<strong>the</strong>re has been concern for <strong>the</strong> effects <strong>of</strong> different regulatory options on fishing communities, <strong>the</strong>re has usually been<br />
little systematic research on <strong>the</strong>ir effects on fishers livelihoods. Fisheries <strong>management</strong> is becoming more<br />
consultative, and fishing communities now have greater participation in <strong>management</strong>, sometimes through co<strong>management</strong><br />
arrangements (Pomeroy & Berkes, 1997). There is still little systematic discussion <strong>of</strong> <strong>the</strong> effects <strong>of</strong><br />
different <strong>management</strong> options on livelihoods. There is a requirement for both participatory research to help to
77<br />
Lake Malawi Fisheries Management Symposium - Proceedings<br />
identify acceptable <strong>management</strong> solutions to fishery problems, and fur<strong>the</strong>r studies <strong>of</strong> livelihoods to understand how<br />
fishers cope with and react to both inherent fluctuations and changing externalities.<br />
Acknowledgements<br />
We thank Olaf Weyl and <strong>the</strong> staff <strong>of</strong> NARMAP for <strong>the</strong>ir help and organisational support, and for allowing us to<br />
incorporate our dissemination workshop within <strong>the</strong> National Fisheries Management Symposium. This research is<br />
funded under <strong>the</strong> Fisheries Management Science Programme <strong>of</strong> <strong>the</strong> U.K. Department for International Development<br />
(project number R7336). We also thank Terri Sarah, for contributions to a related paper (Sarah & Allison, 2000).<br />
The opinions presented in this paper are our own, and do not necessarily represent those <strong>of</strong> DFID.<br />
References<br />
Agnes, S. 1979. The People and <strong>the</strong> Land, pp 309-342. In M. Kalk, A. J. McLachlan and C. Howard-Williams (eds.) Lake Chilwa:<br />
Studies <strong>of</strong> Change in a Tropical Ecosystem. The Ne<strong>the</strong>rlands: Dr. W. Junk.<br />
Agnew, S. & Chipeta, C. 1979. Fishing and Fish-trading: Socio-economic Studies, pp 343-368 in Ibid.<br />
Allison, E. H., Patterson, G., Irvine, K., Thompson, A. B. & Menz, A. 1995. The Pelagic Ecosystem, pp 351-377. In A. Menz<br />
(ed.), The Fisheries potential and productivity <strong>of</strong> <strong>the</strong> pelagic zone <strong>of</strong> Lake Malawi/Niassa. Chatham, U.K.: Natural<br />
Resources Institute.<br />
Allison, E. H. & Ellis, F. 2001. The Livelihoods Approach and Management <strong>of</strong> Small-scale Fisheries. Submitted to Marine<br />
Policy.<br />
Allison, E. H., Mvula, P. M. & Ellis, F. 2001. Fisheries Management: by Whom, for Whom? Competing Agendas in <strong>the</strong><br />
Development and Management <strong>of</strong> Fisheries in Lake Malawi. In Geheb, K. and Sarch, M-T. (eds.) Broaching <strong>the</strong><br />
Management Impasse: Perspectives on Fisheries and <strong>the</strong>ir Management from <strong>the</strong> Inland Waters <strong>of</strong> Africa. Oxford:<br />
Oxford University Press.<br />
Ashley, C. & Carney, D. 1999. Sustainable Livelihoods: Lessons from Early Experience, London: Department for International<br />
Development.<br />
Bailey, C. & Pomeroy, C. 1996. Resource Dependency and Development Options in Coastal Sou<strong>the</strong>ast Asia. Society and Natural<br />
Resources 9: 191-199.<br />
Bailey, C. 1982. Small-scale Fisheries <strong>of</strong> San Miguel Bay, Philippines: Occupational and Geographic Mobility. ICLARM<br />
Technical Reports 10, 57p.<br />
Bakun, A. 1998. Ocean Triads and Radical Interdecadal Variation: Bane and Boon to Scientific Fisheries Management, pp 331-<br />
358. In T. J. Pitcher, P. J. B. Hart and D. Pauly (eds.) Reinventing Fisheries Management. Dordrecht, The Ne<strong>the</strong>rlands:<br />
Kluwer.<br />
Bayliss-Smith, T. 1991. Food Security and Agricultural Sustainability in <strong>the</strong> New Guinea Highlands: Vulnerable People,<br />
Vulnerable Places. IDS Bulletin 22(3): 5-11.<br />
Beddington, J. & May, R. M. 1977. Harvesting Natural Populations in a Randomly Fluctuating Environment. Science 197: 463-465.<br />
Béné, C., Mindjimba, K., Belal, E. & Jolley, T. 2000. Evaluating Livelihood Strategies and <strong>the</strong> Role <strong>of</strong> Inland Fisheries in Rural<br />
Development and Poverty Alleviation: The Case <strong>of</strong> <strong>the</strong> Yaéré Floodplain in North Cameroon. Proceedings <strong>of</strong> <strong>the</strong> 10 th<br />
International Conference <strong>of</strong> <strong>the</strong> Institute <strong>of</strong> Fisheries Economics and Trade, Corvallis, Oregon, July 9-14 th 2000.<br />
http://osu.orst.edu/dept/IIFET/2000/papers/bene.pdf<br />
Caddy, J. F., & Gulland, J. A. 1983. Historical Patterns <strong>of</strong> Fish Stocks. Marine Policy 7(4): 267-278.<br />
Carney, D. (ed.) 1998. Sustainable Rural Livelihoods: What Contribution Can We Make? London: Department for International<br />
Development.<br />
Chambers, R. 1989. Editorial Introduction: Vulnerability, Coping and Policy. IDS Bulletin 20(2): 1-7.<br />
Chipeta, C. 1972. A note on Lake Chilwa Cyclic Changes. Journal <strong>of</strong> Interdisciplinary Cyclic Research 3: 87-90.<br />
Chirwa, W.C. 1998. The Lake Malombe and Upper Shire River Fisheries Co-<strong>management</strong> Programme: An Assessment, pp 61-77. In<br />
A. K. Normann, J.R. Nielsen and S. Sverdrup-Jensen (eds.) Fisheries Co-<strong>management</strong> in Africa. U.K.: Institute for<br />
Fisheries Management and Coastal Community Development.<br />
Conway, D. in press. Extreme Rainfall Events and Lake Level Changes in East Africa: Recent Events and Historical Precedents.<br />
In E.O. Odada (ed.) The Second International Symposium on <strong>the</strong> Limnology, Climatology and Palaeoclimatology <strong>of</strong><br />
<strong>the</strong> East African Lakes. In press, Kluwer.<br />
Conway, G. R. 1985. Agroecosystem Analysis. Agricultural Administration 20: 1-55.<br />
Conway, G. R. 1987. The Properties <strong>of</strong> Agroecosystems. Agricultural Systems 24(2): 95-117.<br />
Cushing, D. H. 1996. Towards a Science <strong>of</strong> Recruitment in Fish Populations. Oldendorf/Luhe, Germany: Ecology Institute.<br />
Davies, S. 1996. Adaptable Livelihoods Coping with Food Insecurity in <strong>the</strong> Malian Sahel. London: Macmillan Press.<br />
DeAngelis, D. L., & Waterhouse, J. C. 1987. Equilibrium and Nonequilibrium Concepts in Ecological Models. Ecological<br />
Monographs 57: 1-21.<br />
Ellis, F. 2000. Rural Livelihoods and Diversity in Developing Countries. Oxford: Oxford University Press.<br />
Environmental Affairs Department. 2000. Lake Chilwa Wetland – State <strong>of</strong> <strong>the</strong> Environment. Environmental Affairs Department,<br />
Malawi Government, June 2000.<br />
FAO. 1993. Fisheries Management in <strong>the</strong> South-east Arm <strong>of</strong> Lake Malawi, <strong>the</strong> Upper Shire River and Lake Malombe, with Particular<br />
Reference to <strong>the</strong> Fisheries on Chambo (Oreochromis spp). CIFA Technical Paper 21. Rome: FAO.
78<br />
Lake Malawi Fisheries Management Symposium - Proceedings<br />
FAO. 1996. Fisheries and Aquaculture in Sub-Saharan Africa: Situation and Outlook in 1996. FAO Fisheries Circular No. 922<br />
FIPP/C922. Rome: FAO.<br />
Ferguson, A., Derman, B. & Mkandawire, M. 1993. The New Development Rhetoric and Lake Malawi. Africa 63(1): 1-18.<br />
Geheb, K. & Binns, T. 1997. Fishing Farmers or ‘Farming Fishermen’? The Quest for Household Income and Nutritional Security<br />
on <strong>the</strong> Kenyan Shores <strong>of</strong> Lake Victoria. African Affairs 96: 73-93.<br />
Glantz, M. H. (ed.) 1992. Climate Variability, Climate Change and Fisheries. Cambridge: Cambridge University Press.<br />
GOM. 1999. Resource Report, 1999. Fisheries Department, Government <strong>of</strong> Malawi.<br />
Gordon, H.S. 1954. The Economic Theory <strong>of</strong> a Common Property Resource: The Fishery. Journal <strong>of</strong> Political Economy 62: 124-<br />
142.<br />
Haakonsen. 1992. A Regional Policy on Fishermen Migration in West Africa - Seminar on Artisanal Fishermen Migrations,<br />
Cotonou, Benin, 3-5 December 1991. Marine Policy 16: 237-238.<br />
Hilborn, R., & Walters, C. J. 1992. Quantitative Fisheries Stock Assessment: Choice, Dynamics and Uncertainty. U.K.: Chapman<br />
& Hall.<br />
Holling, C. S. 1973. Resilience and Stability <strong>of</strong> Ecological Systems. Annual Review <strong>of</strong> Ecology and Systematics 4: 1-23.<br />
Irvine, K., Patterson, G., Allison, E. H., Thompson, A. B. & Menz, A. 2001. The Pelagic Ecosystem <strong>of</strong> Lake Malawi, Africa:<br />
Trophic Structure and Current Threats, pp 3-30. In M. Munawar and R.E. Hecky (eds.) The Great Lakes <strong>of</strong> <strong>the</strong> World<br />
(GLOW): Food-web, Health and Integrity. Leiden, The Ne<strong>the</strong>rlands: Backhuys.<br />
Kalk, M. 1979. Focus on Social Problems, pp 417-432 in ibid.<br />
Kalk, M., McLachlan, A. J. & Howard-Williams, C. (eds.) 1979. Lake Chilwa: Studies <strong>of</strong> Change in a Tropical Ecosystem. The<br />
Ne<strong>the</strong>rlands: Dr. W. Junk.<br />
Kawasaki, T. 1983. Why Do Some Pelagic Fishes Have Wide Fluctuations in Their Numbers? Biological Basis <strong>of</strong> Fluctuation<br />
from <strong>the</strong> Viewpoint <strong>of</strong> Evolutionary Ecology. FAO Fisheries Report 291: 1065-1080.<br />
Lancaster, N. 1979. The Changes in <strong>the</strong> Lake Level, pp 41-58. In M. Kalk, A.J. McLachlan and C. Howard-Williams (eds.) Lake<br />
Chilwa: Studies <strong>of</strong> Change in a Tropical Ecosystem. The Ne<strong>the</strong>rlands: Dr. W. Junk.<br />
Larkin, P. A. 1977. An Epitaph for <strong>the</strong> Concept <strong>of</strong> Maximum Sustained Yield. Transactions <strong>of</strong> <strong>the</strong> American Fisheries Society<br />
106(1): 1-11.<br />
Mahon, R. 1997. Does Fisheries Science Serve <strong>the</strong> Needs <strong>of</strong> Managers <strong>of</strong> Small Stocks in Developing Countries? Canadian Journal <strong>of</strong><br />
Fisheries and Aquatic Sciences 54(9): 2207-2213.<br />
Moss, B. 1979. The Lake Chilwa Ecosystem – A Limnological Overview, pp 399-416. In M. Kalk, A.J. McLachlan and C. Howard-<br />
Williams (eds.) Lake Chilwa: Studies <strong>of</strong> Change in a Tropical Ecosystem. The Ne<strong>the</strong>rlands: Dr. W. Junk.<br />
Moss, B. 1992. Uses, Abuses and Management <strong>of</strong> Lakes and Rivers. Hydrobiologia 243/244: 31-45.<br />
Normann, A. K., Nielsen, J. R. & Sverdrup-Jensen, S. 1998. Fisheries Co-<strong>management</strong> in Africa. U.K.: Institute for Fisheries<br />
Management & Coastal Community Development.<br />
Phipps, P. 1973. The ‘Big’ Fishermen <strong>of</strong> Lake Chilwa. A Preliminary Study in Entrepreneurism in Rural Malawi. In M.E. Page (ed.)<br />
Land and Labour in Rural Malawi. Rural Africana 21: 39-48.<br />
Pitcher, T. J. & Hart, P. J. B, (eds.) 1995. The Impact <strong>of</strong> Species Changes in African Lakes. London: Chapman & Hall.<br />
Plisnier, P.-D. 1997. Climate, Limnology and Fisheries Changes in Lake Tanganyika. FAO/FINNIDA: Research for <strong>the</strong><br />
Management <strong>of</strong> <strong>the</strong> Fisheries on Lake Tanganyika. GCP/RAF/271/FIN-TD/72. ftp://ftp.fao.org/fi/ltr/TD72.PDF).<br />
Pomeroy, R. S. & Berkes, F. 1997. Two to Tango: <strong>the</strong> Role <strong>of</strong> Government in Fisheries Co-Management. Marine Policy 21(5):<br />
465-480.<br />
Reardon, T. & Vosti, S. A. 1995. Links Between Rural Poverty and <strong>the</strong> Environment in Developing Countries: Asset Categories<br />
and Investment Poverty. World Development 23(9): 1495-1506.<br />
Sarch, M-T. & Allison, E. H. 2000. Fluctuating Fisheries in Africa's Inland Waters: Well-adapted Livelihoods, Maladapted<br />
Management. Proceedings <strong>of</strong> <strong>the</strong> 10th International Conference <strong>of</strong> <strong>the</strong> Institute <strong>of</strong> Fisheries Economics and Trade.<br />
Corvallis, Oregon, July 9-14th 2000, 11 pp.<br />
http://osu.orst.edu/dept/IIFET/2000/papers/sarch.pdf<br />
Sarch M-T & Birkett, C. M. 2000. Fishing and Farming at Lake Chad: Responses to Lake Level Fluctuations. The Geographical<br />
Journal 166(2): 156-172.<br />
Scoones, I. 1998. Sustainable Rural Livelihoods: A Framework for Analysis. IDS Working Paper 72. Sussex, U.K.: Institute <strong>of</strong><br />
Development Studies.<br />
Shaefer, M. B. 1954. Some Aspects <strong>of</strong> <strong>the</strong> Dynamics <strong>of</strong> Populations Important to <strong>the</strong> Management <strong>of</strong> Commercial Marine Fisheries.<br />
Bulletin <strong>of</strong> <strong>the</strong> Inter-American Tropical Tuna Commission 1: 25-56.<br />
Shepherd, J.G. 1991. Stability and <strong>the</strong> Objectives <strong>of</strong> Fishery Management. MAFF Laboratory Leaflet 64. Lowest<strong>of</strong>t, U.K: Directorate<br />
<strong>of</strong> Fisheries Research.<br />
Sholtz, U., Njaya, F. J., Chimatiro, S, Hummel, M., Donda, S. & Mkoko, B. J. 1998. Status and Prospects <strong>of</strong> Participatory Fisheries<br />
Management Programs in Malawi, pp 407 - 425. In T. Petr (ed.) Inland Fishery Enhancements. Fisheries Technical Paper<br />
374. Rome: FAO.<br />
Spencer, P. D., & Collie, J. S. 1997. Patterns <strong>of</strong> Population Variability in Marine Fish Stocks. Fisheries Oceanography 6(3): 188-<br />
204.<br />
Swift, J. 1989. Why Are Rural People Vulnerable to Famine? IDS Bulletin 20(2): 8-15.<br />
Talling, J. F. & Lemoalle, J. 1998. Ecological Dynamics <strong>of</strong> Tropical Inland Waters. Cambridge: Cambridge University Press.<br />
Thompson, A. B. & Allison, E. H. 1997. Potential Yield Estimates <strong>of</strong> Unexploited Pelagic Fish Stocks in Lake Malawi.<br />
Fisheries Management and Ecology 4: 31-48.
79<br />
Lake Malawi Fisheries Management Symposium - Proceedings<br />
Thompson, A. B., Allison, E. H. & Ngatunga, B. P. 1996. Distribution and Breeding Biology <strong>of</strong> Offshore Pelagic Cyprinidae and<br />
Catfish in Lake Malawi/Niassa. Environmental Biology <strong>of</strong> Fishes 47: 27-42.<br />
Tweddle, D. & Magasa, J. H. 1989. Assessment <strong>of</strong> Multispecies Cichlid Fisheries <strong>of</strong> <strong>the</strong> Sou<strong>the</strong>ast Arm <strong>of</strong> Lake Malawi, Africa.<br />
Journal du Conseil International pour l’Exploration de la Mer 45: 209-222.<br />
Tweddle, D. & Lewis D. S. C. 1990. The Biology <strong>of</strong> Usipa (Engraulicypris sardella) in Relation to Fluctuations in Productivity <strong>of</strong><br />
Lake Malawi and Species Introductions, pp 67-72. In T. J. Pitcher and C. E. Hollingworth (eds.) Collected Reports on<br />
Fisheries Research in Malawi. Occasional Papers 1. London: Overseas Development Administration.
80<br />
Lake Malawi Fisheries Management Symposium - Proceedings<br />
An overview <strong>of</strong> indigenous knowledge as applied to natural resources<br />
<strong>management</strong><br />
E.Y. Sambo 1 and R. Woytek 2<br />
1 University Office, University <strong>of</strong> Malawi, P.O. Box 278, Zomba, Malawi<br />
2 Operational Quality and Knowledge Services, Africa Region, The World Bank, 1818 H Street, NW, Washington, DC 20433, USA<br />
Abstract<br />
Historically, rural communities have acquired detailed knowledge, skills and strategies based on <strong>the</strong>ir interaction with <strong>the</strong> local<br />
environment over long periods <strong>of</strong> time. Local techniques and practices, which are essentially subsistence-oriented and are distinct to<br />
a particular social group and culture, have been developed and built up over centuries <strong>of</strong> experience and adaptation and are<br />
generally in harmony with <strong>the</strong> environmental conditions and responsive to constraints. This stock <strong>of</strong> knowledge is communicated in<br />
local languages and handed down from generation to generation. It is an expression <strong>of</strong> African tradition, rich in intricacies. When<br />
properly understood, this indigenous knowledge (IK) demonstrates how communities appreciate <strong>the</strong>ir environment and constantly<br />
seek to live in harmony with nature. Often this knowledge expresses itself and is communicated through songs, taboos, totem<br />
animals, custom laws and practices, place names and nicknames, riddles and proverbs.<br />
Indigenous knowledge permeates <strong>the</strong> social structure. It may have been influenced by innovations emerging from within itself, from<br />
o<strong>the</strong>r indigenous systems or from external systems but it essentially evolved locally. It is <strong>the</strong> basis for local-level decision-making in<br />
agriculture, food security, natural resource <strong>management</strong>, and a host <strong>of</strong> o<strong>the</strong>r activities in <strong>the</strong> rural communities. IK, <strong>the</strong>refore, deals<br />
with folk beliefs, skills, methods and practices. Some <strong>of</strong> <strong>the</strong> practices have led to mis<strong>management</strong> <strong>of</strong> resources, some are less<br />
efficient than modern technologies, while IK is generally less precise as measured by international science. IK, however, <strong>of</strong>fers<br />
insights into possible alternative approaches to interpreting environmental and development change.<br />
Previously, external solutions <strong>of</strong>fered in natural resource <strong>management</strong> projects <strong>of</strong>ten failed because <strong>the</strong>y did not fit with <strong>the</strong> local<br />
knowledge and circumstances. It is now recognised that <strong>the</strong> local community's decisions to adopt or reject a new development<br />
project is strongly influenced by its existing skills, values and beliefs which are usually reflected in its indigenous knowledge.<br />
Although integration <strong>of</strong> IK in natural resources <strong>management</strong> may not be <strong>the</strong> ultimate answer in itself, <strong>the</strong>re is increasing recognition<br />
<strong>of</strong> <strong>the</strong> value <strong>of</strong> local knowledge in production systems and rural development. Rural people with <strong>the</strong>ir detailed, holistic, integrated<br />
knowledge <strong>of</strong> local ecosystems, are experts in <strong>the</strong>ir own right. Utilising IK in <strong>the</strong> development process requires identification,<br />
validation, documentation and integration.<br />
This paper advocates that <strong>the</strong> opportunity should be seized to utilise <strong>the</strong> available IK for <strong>the</strong> <strong>fisheries</strong> resource <strong>management</strong>, <strong>the</strong><br />
stabilisation <strong>of</strong> land-use activities in <strong>the</strong> catchment, <strong>the</strong> integrated monitoring programme <strong>of</strong> <strong>the</strong> <strong>lake</strong> ecosystem, and for <strong>the</strong> design<br />
<strong>of</strong> <strong>the</strong> institutional arrangements in <strong>the</strong> Lake Malawi Environmental Management Project.<br />
Introduction<br />
Renewable natural resources that are currently <strong>the</strong> subject <strong>of</strong> major impacts in Malawi include land, water, fish,<br />
wildlife and forests. Natural resource <strong>management</strong> poses major challenges as environmental degradation continues<br />
to worsen as a result <strong>of</strong> high population growth rate, poverty, low agricultural productivity, dwindling smallholder<br />
farmlands and escalating input prices, which collectively build up pressure on resource utilisation and exploitation.<br />
The discounted economic cost <strong>of</strong> soil erosion, deforestation, water resources degradation, <strong>fisheries</strong> depletion and<br />
biodiversity loss amounted to 10% <strong>of</strong> <strong>the</strong> GDP by 1994 and it represented a substantial income loss to <strong>the</strong> country<br />
(EAD 1998, p.9). This calls for innovative mechanisms that take into account <strong>the</strong> participation <strong>of</strong> all stakeholders in<br />
<strong>the</strong> natural resource <strong>management</strong> in order to arrest <strong>the</strong> declining situation.<br />
Historically, rural communities have acquired detailed knowledge, skills and strategies based on <strong>the</strong>ir interaction<br />
with <strong>the</strong> local environment over long periods <strong>of</strong> time. This stock <strong>of</strong> knowledge permeates <strong>the</strong> social structure and it<br />
is <strong>the</strong> basis for local-level decision-making in agriculture, food preparation, natural resource <strong>management</strong>, and a host<br />
<strong>of</strong> o<strong>the</strong>r activities in rural communities. It is an expression <strong>of</strong> African tradition, rich in intricacies. When properly<br />
understood, this Indigenous Knowledge (IK) demonstrates how communities appreciate <strong>the</strong>ir environment and<br />
constantly seek to live in harmony with nature. Often this knowledge expresses itself and is communicated through<br />
songs, taboos, totem animals, custom laws and practices, place names and nicknames, riddles and proverbs - all<br />
<strong>the</strong>se have a story to tell (Matusse, 1995). Indigenous knowledge, <strong>the</strong>refore, refers to history, cultural heritage, and<br />
customs as developed in direct response to <strong>the</strong> physical and social realities...and in <strong>the</strong> context <strong>of</strong> Africa, indigenous<br />
means what is African, or what Africa has learned and adopted from o<strong>the</strong>r societies (Chavunduka, 1995). One<br />
scholar says that a particularly striking "philosophy <strong>of</strong> <strong>the</strong> indigens is empathy, selflessness, service to o<strong>the</strong>r beings,<br />
unconditional caring, honesty, accountability, respect for all members <strong>of</strong> your society ...." (Nxumalo, 1995).<br />
Such a complex collection <strong>of</strong> knowledge, described as indigenous knowledge systems (IKS), ethnoscience or<br />
traditional wisdom (Kipuri 1995) evolves over time, has collective ownership and is communicated orally from one
81<br />
Lake Malawi Fisheries Management Symposium - Proceedings<br />
generation to <strong>the</strong> next. Before rural communities experienced any institutionalised foreign intervention, it is <strong>the</strong>se<br />
indigenous knowledge systems that have regulated <strong>the</strong> level <strong>of</strong> exploitation and utilisation <strong>of</strong> environmental<br />
resources and ensured <strong>the</strong>ir survival. The land and its resources belonged to <strong>the</strong> people, held in trust by <strong>the</strong> chief,<br />
and <strong>the</strong> chief had <strong>the</strong> <strong>management</strong> authority as regards access to <strong>the</strong> resource, permission for usage, period <strong>of</strong> usage<br />
and even levels <strong>of</strong> usage. Resource utilisation was effectively regulated since this system was embedded in<br />
traditional governance structures <strong>of</strong> <strong>the</strong> society that excluded challenging authority <strong>of</strong> <strong>the</strong> chief. In <strong>the</strong> post-colonial<br />
era, <strong>the</strong> traditional structures became weakened as a result <strong>of</strong> partial or complete transfer <strong>of</strong> authority over <strong>the</strong><br />
resource, to <strong>the</strong> different sectors <strong>of</strong> government.<br />
The United Nations Conference on Environment and Development (UNCED), commonly known as <strong>the</strong> Earth<br />
Summit, which convened in Rio de Janeiro in June 1992 adopted a global plan <strong>of</strong> action. The Agenda 21 is<br />
considered a blueprint for a global partnership aimed at reconciling <strong>the</strong> twin requirements <strong>of</strong> a high quality<br />
environment and a healthy economy for all peoples <strong>of</strong> <strong>the</strong> world. Chapter 26 <strong>of</strong> Agenda 21 "Streng<strong>the</strong>ning <strong>the</strong> Role<br />
<strong>of</strong> Indigenous People" provides a framework for recognising Indigenous Knowledge Systems (Box 1).<br />
Box 1. Streng<strong>the</strong>ning <strong>the</strong> Role <strong>of</strong> Indigenous People<br />
“Indigenous people, who represent a significant part <strong>of</strong> <strong>the</strong> world’s population, depend on renewable resources and<br />
ecosystems to maintain <strong>the</strong>ir well-being. Over many generations, <strong>the</strong>y have evolved a holistic, traditional scientific<br />
knowledge <strong>of</strong> <strong>the</strong>ir land, natural resources and environment. The ability <strong>of</strong> indigenous people to practise sustainable<br />
development on <strong>the</strong>ir lands has been limited by economic, social and historical factors. Governments should recognise<br />
that indigenous lands need to be protected from environmentally unsound activities, and from activities <strong>the</strong> people<br />
consider to be socially and culturally inappropriate. There should be national dispute-resolution procedures to deal with<br />
concerns about <strong>the</strong> settlement <strong>of</strong> land and use <strong>of</strong> resources. Some indigenous people may require greater control over<br />
<strong>the</strong>ir lands, and self <strong>management</strong> <strong>of</strong> <strong>the</strong>ir resources. They should also participate in development decisions that affect<br />
<strong>the</strong>m, and in <strong>the</strong> creation <strong>of</strong> protected areas, such as parks.<br />
Governments should incorporate <strong>the</strong> rights and responsibilities <strong>of</strong> indigenous people into national legislation. Countries<br />
could also adopt laws and policies to preserve customary practices, and protect indigenous property, including ideas<br />
and knowledge. Indigenous people should be allowed to actively participate in shaping national laws and policies on<br />
<strong>the</strong> <strong>management</strong> <strong>of</strong> resources or o<strong>the</strong>r development processes that affect <strong>the</strong>m. Governments and international<br />
organisations should recognise <strong>the</strong> values, traditional knowledge and resource <strong>management</strong> practices that indigenous<br />
people use to manage <strong>the</strong>ir environments, and apply this knowledge to o<strong>the</strong>r areas where development is taking place.<br />
They should also provide indigenous people with suitable technologies to increase <strong>the</strong> efficiency <strong>of</strong> <strong>the</strong>ir resource<br />
<strong>management</strong>.”<br />
Source: Keating (1993), Chapter 26<br />
The significance <strong>of</strong> traditional knowledge is also incorporated in <strong>the</strong> International Convention on Biodiversity (Box<br />
2). Previously, solutions <strong>of</strong>fered by some development projects failed because <strong>the</strong>y did not fit with <strong>the</strong> local<br />
knowledge and circumstances. Many organisations such as <strong>the</strong> World Bank and IUCN (International Union for<br />
Conservation <strong>of</strong> Nature and Natural Resources) have in <strong>the</strong> past decade began to directly address environmental<br />
issues through promoting environmental sustainability in <strong>the</strong>ir development efforts and emphasising country<br />
ownership (Asibey, 1995). It is now recognised that <strong>the</strong> local community's decisions to adopt or reject a new<br />
development project is strongly influenced by its existing skills, values and beliefs which are usually reflected in its<br />
indigenous knowledge. Thus, involvement <strong>of</strong> <strong>the</strong> community at all stages "is likely to improve project design by<br />
ensuring that full advantage is taken <strong>of</strong> <strong>the</strong> local technology and indigenous knowledge, and by ensuring that <strong>the</strong><br />
project is fully adapted to <strong>the</strong> social organisation and value systems <strong>of</strong> <strong>the</strong> community" (Matusse, 1995).<br />
Such a bottom-up approach empowers <strong>the</strong> community to take charge <strong>of</strong> resource <strong>management</strong> in development activities.<br />
It is to be admitted, however, that due to cultural hybridisation <strong>the</strong>re has been inevitable loss <strong>of</strong> IKS. In any case, during<br />
<strong>the</strong> colonial era, this knowledge was <strong>of</strong>ten regarded as primitive, scorned at, marginalised and dismissed as worthless<br />
(Matowanyika et al., 1995), so that preference towards being "modernised" or "westernised" has played a major role in<br />
eroding IKS. In addition, one <strong>of</strong> <strong>the</strong> biggest pitfalls is that most <strong>of</strong> African IKS remains unrecorded. It is, <strong>the</strong>refore,<br />
essential that researchers, extension agents and rural development experts study indigenous knowledge. Before imposing<br />
essentially foreign perspectives and technologies <strong>the</strong>ir appropriateness to <strong>the</strong> local setting should be examined.
82<br />
Lake Malawi Fisheries Management Symposium - Proceedings<br />
This paper advocates <strong>the</strong> utilisation <strong>of</strong> available IK in <strong>the</strong> Lake Malawi Environmental Management Project.<br />
Various studies undertaken in Malawi over <strong>the</strong> previous years suggest relevant IK is available for <strong>the</strong> <strong>fisheries</strong><br />
resource <strong>management</strong>, <strong>the</strong> stabilisation <strong>of</strong> land-use activities in <strong>the</strong> catchment, <strong>the</strong> integrated monitoring programme<br />
<strong>of</strong> <strong>the</strong> <strong>lake</strong> ecosystem, and for <strong>the</strong> design <strong>of</strong> <strong>the</strong> institutional arrangements <strong>of</strong> <strong>the</strong> programme.<br />
Box 2. Convention on Biological Diversity<br />
“The world’s biological diversity - <strong>the</strong> variability among living organisms - is valuable for ecological, genetic, social,<br />
economic, educational, cultural, recreational and aes<strong>the</strong>tic reasons. The diversity is important for evolution, and for<br />
maintaining <strong>the</strong> life-sustaining systems <strong>of</strong> <strong>the</strong> biosphere. The conservation and sustainable use <strong>of</strong> biological diversity<br />
are <strong>of</strong> critical importance to meet <strong>the</strong> food, health and o<strong>the</strong>r needs <strong>of</strong> <strong>the</strong> growing world population. However, biological<br />
diversity is being significantly reduced by certain human activities, and it is vital to anticipate, prevent and attack <strong>the</strong><br />
causes <strong>of</strong> this loss. Substantial investments are required to conserve biological diversity, but <strong>the</strong>y will pay <strong>of</strong>f with a<br />
broad range <strong>of</strong> environmental, economic and social benefits.<br />
The world needs to conserve biological diversity and make sustainable use <strong>of</strong> its components in a fair and equitable<br />
way. Sustainable use means use in a way and at a rate that does not lead to <strong>the</strong> long-term decline <strong>of</strong> biological<br />
diversity. This will maintain its potential to meet <strong>the</strong> needs and aspirations <strong>of</strong> present and future generations. The uses<br />
include those <strong>of</strong> genetic material, which is any plant, animal, microbial or o<strong>the</strong>r material containing functional units <strong>of</strong><br />
heredity. We also need to conserve ecosystems, which are groupings <strong>of</strong> living and non-living material that act as a unit.<br />
Countries have rights over <strong>the</strong>ir biological resources, but <strong>the</strong>y are also responsible for conserving <strong>the</strong>ir biological<br />
diversity and for using <strong>the</strong>ir biological resources in a sustainable manner…<br />
Many indigenous and local communities have a close dependence on biological resources, and nations should make<br />
use <strong>of</strong> this traditional knowledge <strong>of</strong> <strong>the</strong> conservation and sustainable use <strong>of</strong> biological diversity. Countries are to<br />
preserve and maintain such indigenous and local knowledge and promote its wider use. This is to be done with <strong>the</strong><br />
approval and involvement <strong>of</strong> those who have such knowledge, and <strong>the</strong>se people should benefit from <strong>the</strong> use <strong>of</strong> <strong>the</strong>ir<br />
practices….”<br />
Source: Keating (1993) p.66<br />
The scope <strong>of</strong> IK<br />
Indigenous knowledge encompasses local knowledge that is developed outside <strong>the</strong> formal systems <strong>of</strong> science and<br />
education. It is embedded in community practices and institutions. It is locally managed and unique to a given<br />
culture or society. IK includes all information, experiences and practices community members have acquired over<br />
time to maintain or improve <strong>the</strong>ir livelihoods, to produce and to engage in social, cultural, and productive activities,<br />
to cope with crises or to manage natural resources. Rural people with <strong>the</strong>ir detailed, holistic, integrated knowledge<br />
<strong>of</strong> local ecosystems, are experts in <strong>the</strong>ir own right. They are capable <strong>of</strong> classifying and structuring environmental<br />
data and knowledge using <strong>the</strong>ir own terminology <strong>of</strong> understanding environmental processes and developing skills<br />
and strategies. IK is not static but becomes modified as <strong>the</strong> learning process demands fine adjustments. The<br />
community uses IK as <strong>the</strong> basis for decision making in agriculture, health care, food preparation, education, naturalresource<br />
<strong>management</strong> and as a coping mechanism in general. IK is primarily tacit knowledge <strong>of</strong> communities,<br />
elders, women, farmers, healers, artisans, spiritual leaders, etc. As such, it is not easily codifiable (World Bank,<br />
1998).<br />
Traditional ecological knowledge, traditional technical knowledge and traditional practices enable people make<br />
choices in <strong>the</strong> use <strong>of</strong> natural resources. Facets <strong>of</strong> such knowledge systems and practices include: local soil and<br />
biodiversity classification, traditional hunting norms and regulations, traditional medicine (both human and ethnoveterinary),<br />
traditional institutions <strong>of</strong> chieftainship, community based land allocation (such as for sacred groves),<br />
agricultural production systems (such as slash and burn), informal savings society, etc. Such a knowledge base<br />
persists and defines <strong>the</strong> limits <strong>of</strong> local culture. Thus in order to maintain <strong>the</strong> culture, IK must first be shared.<br />
Various methods <strong>of</strong> exchanging IK exist, including: apprenticeship; artifacts; demonstration; story telling, myths,<br />
legends, taboos and songs; training etc. Secondly, IK must be used, developed and preserved. Because IK is<br />
primarily developed and communicated outside <strong>the</strong> formal systems <strong>of</strong> science and education, it is frequently<br />
overlooked in <strong>the</strong> development process.
83<br />
Lake Malawi Fisheries Management Symposium - Proceedings<br />
Rationale for integrating IK in development<br />
The resilience <strong>of</strong> IK as it gets passed on from generation to generation implies that it is a component <strong>of</strong> human and<br />
social capital. This suggests that <strong>the</strong> community has had <strong>the</strong> opportunity to decide on what values, practices and<br />
beliefs to maintain, on <strong>the</strong> premise that <strong>the</strong>re is general acceptance. Basically, community empowerment is achieved<br />
when choices are endogenous and any future activities based on such consensus are likely to be supported. In such<br />
situations, IK will increase efficiency and effectiveness, thus making IK a basis for sustainable development.<br />
It is important to recognise that communities can be helped to make better use <strong>of</strong> IK for development. This can only<br />
happen by first learning from <strong>the</strong>m (i.e. recognising and identifying <strong>the</strong> IK), validating, recording, documenting,<br />
storing it in a retrievable form, transfering it back to <strong>the</strong> communities, <strong>the</strong>n disseminating successes to a wider<br />
community, and finally promoting <strong>the</strong> exchange <strong>of</strong> <strong>the</strong> successful IK between communities. Learning from <strong>the</strong><br />
community and helping <strong>the</strong> community learn (a bottom-up approach) can lead to empowerment through enablement.<br />
The following approaches have proven to help in creating <strong>the</strong> environment for enablement:<br />
� exchange knowledge <strong>of</strong> local practices in order to build local knowledge networks;<br />
� engage researchers and experts in order to determine research agendas;<br />
� engage authorities in dialogue in order to enhance good governance;<br />
� dialogue with development partners in order to shape endogenous development agenda; and<br />
� leverage local and global knowledge in order to integrate IK in development.<br />
MAINSTREAMING IK INTO DEVELOPMENT ACTIVITIES<br />
The Policy Environment<br />
In <strong>the</strong> past, <strong>the</strong> value <strong>of</strong> harnessing global and local knowledge for development has not received <strong>the</strong> needed<br />
attention in developing countries in general and in Africa in particular. With <strong>the</strong> advent <strong>of</strong> Information and<br />
Communication Technologies this appears to be changing, especially since <strong>the</strong> early 1990’s. In Malawi, <strong>the</strong> National<br />
Science and Technology Policy and <strong>the</strong> draft Science and Technology Bill have been endorsed by stakeholders in<br />
May 2001. The S&T Policy provides for <strong>the</strong> identification, development, protection and promotion <strong>of</strong> IK. This will<br />
help move IK from <strong>the</strong> realm <strong>of</strong> folklore into <strong>the</strong> development domain.<br />
IK in Lake Malawi Environment Management Project (LMEMP)<br />
IK could be <strong>the</strong> most important resource <strong>of</strong> small-scale fishing and farming communities in <strong>the</strong> Lake Malawi basin.<br />
There is no o<strong>the</strong>r resource that is owned, controlled and managed to <strong>the</strong> same extent as IK. The proposed LMEMP<br />
<strong>of</strong>fers a unique opportunity to utilise <strong>the</strong> available IK for <strong>the</strong> <strong>fisheries</strong> resource <strong>management</strong>, <strong>the</strong> stabilisation <strong>of</strong><br />
land-use activities in <strong>the</strong> catchment, <strong>the</strong> integrated monitoring programme <strong>of</strong> <strong>the</strong> <strong>lake</strong> ecosystem, and <strong>the</strong> design <strong>of</strong><br />
<strong>the</strong> institutional arrangements.<br />
IK-related activities would identify options and formulate actions for integrating <strong>the</strong> IK in <strong>the</strong> <strong>management</strong> <strong>of</strong><br />
natural resources. It is a challenge in so far as <strong>the</strong> approach departs from <strong>the</strong> conventional practices <strong>of</strong> project<br />
implementation. The process will involve:<br />
making an inventory <strong>of</strong> actors, resources, publications;<br />
convening a national exchange involving researchers, NGOs, CBOs, local knowledge bearers, etc;<br />
determining areas <strong>of</strong> relevant IK for <strong>the</strong> LMEMP; and<br />
agreeing on action plan involving IK research, exchange and institutional arrangements.<br />
The expected outcomes and impact include:<br />
increased ownership <strong>of</strong> <strong>the</strong> <strong>management</strong> <strong>of</strong> <strong>the</strong> <strong>lake</strong> basin resource by local communities;<br />
higher productivity <strong>of</strong> <strong>the</strong> <strong>lake</strong> basin resources; and<br />
sustainable access to natural resources by communities.<br />
Conclusion<br />
There is a global recognition that indigenous knowledge has an important role to play in consonance with modern<br />
scientific and technological intervention in social and economic development and cultural and political<br />
transformation. IK is a valuable resource <strong>of</strong> <strong>the</strong> local community that needs to be used to <strong>the</strong> community’s<br />
advantage. Incorporating IK in <strong>the</strong> LMEMP will provide not only a testing ground but will also <strong>of</strong>fer an opportunity<br />
to understand and internalise IK in <strong>the</strong> development planning.
84<br />
Lake Malawi Fisheries Management Symposium - Proceedings<br />
References<br />
Asibey, E.O.A. 1995. Indigenous knowledge systems and prudent natural resource <strong>management</strong>. In: Matowanyika,<br />
J.Z.Z., Garibaldi,V. and Musimwa, E. (eds.). Indigenous Knowledge Systems and Natural Resource<br />
Management in Sou<strong>the</strong>rn African. Report <strong>of</strong> <strong>the</strong> Sou<strong>the</strong>rn African Regional Workshop, Harare, Zimbabwe,<br />
20-22 April 1994, IUCN-ROSA, Indigenous Knowledge Systems Series No.1.<br />
Chavunduka, G.L. 1995. Keynote address by Pr<strong>of</strong>essor G.L. Chavunduka, Vice-Chancellor <strong>of</strong> <strong>the</strong> University <strong>of</strong><br />
Zimbabwe. In: Matowanyika, J.Z.Z., Sibanda, H. and Garibaldi, V. (eds.). The Missing Link: Reviving<br />
indigenous knowledge systems in promoting sustainable natural resource <strong>management</strong> in sou<strong>the</strong>rn Africa.<br />
Proceedings <strong>of</strong> a Regional Workshop, held in Midmar, Kwazulu-Natal Province, South Africa, 23-28 April,<br />
1995. IUCN-ROSA Indigenous Knowledge Systems Series No.2.<br />
EAD (Environmental Affairs Department). 1998. Environmental Management Framework. In: State <strong>of</strong> Environment<br />
Report. Malawi Government, Lilongwe.<br />
Keating, M. 1993. Agenda for Change: A plain language version <strong>of</strong> Agenda 21 and <strong>the</strong> o<strong>the</strong>r Rio Agreements,<br />
Chapter 26, Published by <strong>the</strong> Centre for Our Common Future.<br />
Kipuri, Naomi. 1995. International perspectives and importance <strong>of</strong> indigenous knowledge systems and institutions<br />
in natural resource <strong>management</strong>: contributions and experiences in <strong>the</strong> pastoral Maasai <strong>of</strong> East Africa.<br />
Paper presented at <strong>the</strong> Workshop on Indigenous Knowledge Systems in Natural Resource Management.<br />
Held in Kwazulu, Natal Province, South Africa, 23-28 April 1995.<br />
Matowanyika, J.Z.Z., Sibanda, H. and Garibaldi, V. (eds.). 1995. The Missing Link: Reviving indigenous<br />
knowledge systems in promoting sustainable natural resource <strong>management</strong> in sou<strong>the</strong>rn Africa.<br />
Proceedings <strong>of</strong> a Regional Workshop, held in Midmar, Kwazulu-Natal Province, South Africa, 23-28 April,<br />
1995. IUCN-ROSA Indigenous Knowledge Systems Series No.2.<br />
Matusse, R. (1995). Indigenous people and people-centred development: Are we moving South to meet ourselves?<br />
Paper presented at <strong>the</strong> IUCN sponsored Workshop on Indigenous Knowledge Systems in Natural Resources<br />
Management in Sou<strong>the</strong>rn Africa. Held at Midmar, Kwazulu-Natal Province, South Africa, 23-28 April 1995.<br />
Nxumalo, O.E.H.M. (1995). Keynote address by Pr<strong>of</strong>essor O.E.H.M. Nxumalo: Indigenous knowledge systems and<br />
natural resource <strong>management</strong> in South Africa. Delivered to <strong>the</strong> Regional Workshop on <strong>the</strong> Study and<br />
Promotion <strong>of</strong> indigenous Knowledge Systems and natural Resources Management in Sou<strong>the</strong>rn Africa, at<br />
Fern Hill - Harwick, Natal Province, South Africa, 23-28 April 1995.<br />
World Bank. (1998). Indigenous Knowledge for Development: A Framework for Action. Knowledge and Learning<br />
Center, Africa Region, The World Bank.
85<br />
Lake Malawi Fisheries Management Symposium - Proceedings<br />
Decentralised environmental <strong>management</strong> and <strong>the</strong> implications for <strong>fisheries</strong> co<strong>management</strong><br />
in Lake Malawi<br />
John D. Balarin<br />
Chief Technical Advisor, Danida Environment Support Program, Pvt Bag 396, Lilongwe, Malawi, (tel 265-836533, e-mail:<br />
DESPS@<strong>malawi</strong>.net)<br />
Abstract<br />
Malawi has made a political commitment to decentralization through <strong>the</strong> recent appointment <strong>of</strong> <strong>the</strong> District Assemblies. Environment<br />
Management, has been decentralised since 1996. The Environment Act requires communities to participate actively at district level<br />
in State <strong>of</strong> <strong>the</strong> Environment Reporting (SOER) and Environmental Action Planning (EAP) and <strong>management</strong>. These processes have<br />
now become integral to <strong>the</strong> District Development Planning (DDP) system and are <strong>the</strong> responsibility <strong>of</strong> <strong>the</strong> Assemblies. Community<br />
consultation and participation is fundamental to <strong>the</strong> process. The resultant EAPs are implemented at target group level through<br />
micro-projects. As decentralised environmental <strong>management</strong> takes hold, communities will become better empowered to assess <strong>the</strong>ir<br />
own needs, to plan and act accordingly. In addition, <strong>the</strong> empowerment <strong>of</strong> <strong>the</strong> Assemblies as custodians <strong>of</strong> national laws through<br />
district by-laws will bring communities closer to policing and becoming resource managers. In addition, a degree <strong>of</strong> security <strong>of</strong><br />
tenure can be secured through <strong>the</strong> by-law and this may allow a socio-economic change in community behaviour from<br />
“hunter/ga<strong>the</strong>rer” to introduction <strong>of</strong> husbandry system options.<br />
This paper elucidates <strong>the</strong> SOER, EAP and DDP process, its implications for <strong>the</strong> BVCs and <strong>the</strong> future role <strong>of</strong> community participation<br />
in <strong>the</strong> co-<strong>management</strong> <strong>of</strong> Lake Malawi.<br />
Introduction<br />
With <strong>the</strong> election <strong>of</strong> Councilors and <strong>the</strong> formation <strong>of</strong> District Assemblies in late 2000, Malawi has taken a great step<br />
closer towards making community based natural resource <strong>management</strong> (CBNRM) a reality. CBNRM and<br />
decentralization are inextricably linked (Balarin et al. 2001) in as much as <strong>the</strong> latter transfers power for<br />
administration and <strong>management</strong> from a central level to a lower, more appropriate, district, or sub-district level.<br />
Decentralization strives, through consultative processes and popular participation to empower communities to<br />
become pro-active in <strong>the</strong> planning and decision making process <strong>of</strong> development, and advocates for change in policy.<br />
It also brings <strong>the</strong>m closer to being <strong>the</strong> custodians <strong>of</strong> <strong>the</strong> resource with self-imposed by laws and more secure access<br />
rights.<br />
Tools to achieve this are now in place, described in <strong>the</strong> Local Government Decentralization Strategy (OPC,<br />
1998)(LGDMP, 1999) and <strong>the</strong> Strategy for Decentralised Environmental Management (DEM)(EAD, 2000, 2001 a, b<br />
and c).<br />
The 1999 Fisheries and Aquaculture Policy <strong>of</strong> Malawi has “collaborative <strong>management</strong>” as one <strong>of</strong> its key objectives.<br />
Subsequent, subsidiary legislation for <strong>the</strong> first time in <strong>the</strong> history <strong>of</strong> <strong>fisheries</strong> development in Malawi, empowered<br />
communities through <strong>the</strong> Act, to formulate by-laws that can self-govern <strong>the</strong> <strong>management</strong> <strong>of</strong> <strong>the</strong> <strong>fisheries</strong> resources in<br />
<strong>the</strong>ir locality. It would be myopic to think that <strong>the</strong> <strong>fisheries</strong> legislation alone is adequate. To be successful, any<br />
<strong>fisheries</strong> natural resource <strong>management</strong> strategies would need to be coupled with decentralization, and include crosscutting<br />
elements from <strong>the</strong> recent trends in o<strong>the</strong>r sectors (notably forestry, wildlife, water, etc). The stage, is set, now<br />
more-so than before for Malawi to embark on some <strong>of</strong> <strong>the</strong> first steps towards <strong>fisheries</strong> co-<strong>management</strong>.<br />
CBNRM Defined<br />
Guiding Principles <strong>of</strong> CBNRM<br />
Some guiding principles for CBNRM are, in brief (adapted from COMPASS, 2000a):<br />
a. Communities should be prime beneficiaries and take <strong>the</strong> lead role, actively participating in identifying,<br />
planning and implementing CBNRM activities.<br />
b. CBNRM activities should be managed by democratically elected institutions or committees linked to <strong>the</strong><br />
local authority.<br />
c. Communities must develop clearly defined constitutions for <strong>the</strong>ir CBNRM institutions and establish bylaws<br />
for CBNRM in conformity with national policy.<br />
d. User groups and boundaries must be clearly defined with clear rights <strong>of</strong> access, lease or ownership.<br />
e. Natural resources should be treated as economic goods and any intervention should be seen to have<br />
tangible value added benefits to communities.
86<br />
Lake Malawi Fisheries Management Symposium - Proceedings<br />
f. CBNRM programs must be gender sensitive, promote equitable sharing <strong>of</strong> costs and benefits and be<br />
supportive <strong>of</strong> community priorities.<br />
Co-<strong>management</strong> vs CBNRM<br />
Most natural resources in Malawi are state owned and have largely been state regulated for <strong>the</strong> benefit <strong>of</strong> all present<br />
and future generations. However, in recognition that <strong>management</strong> initiatives that do not involve <strong>the</strong> resource users,<br />
is not sustainable, CBNRM strategies aim to place responsibility for resource <strong>management</strong> at <strong>the</strong> lowest appropriate<br />
level. A spectrum <strong>of</strong> co-<strong>management</strong> options emerge (Figure 1)(Balarin et al. 2001). Essentially, <strong>the</strong> current<br />
situation <strong>of</strong> 100 % state <strong>management</strong> <strong>of</strong> resources, should gradually giving way to progressively more resources<br />
coming under varying degrees <strong>of</strong> joint <strong>management</strong> between state and user, until eventually, for some resources, <strong>the</strong><br />
community is 100 % in control.<br />
Figure 1. Conceptual Diagram <strong>of</strong> <strong>the</strong> different stages <strong>of</strong> co-<strong>management</strong><br />
Husbandry vs Natural Resource Management<br />
The NEAP (1994) identified that <strong>the</strong> nexus to environmental degradation in Malawi is poverty and illiteracy.<br />
Because <strong>of</strong> poverty, foraging from natural resources has been a fundamental sustainable livelihood strategy,<br />
especially in times <strong>of</strong> need. CBNRM strategies should <strong>the</strong>refore not only aim at <strong>the</strong> sustainable <strong>management</strong> <strong>of</strong> <strong>the</strong><br />
status quo <strong>of</strong> ecosystems, (ie. cropping according to sustainable maximum yield), it should seek out sustainable<br />
economic benefit streams that <strong>of</strong>fer incentives to <strong>the</strong> user to diversify into alternative, value added uses or income<br />
generating activities. For CBNRM to succeed, extension strategies would have to introduce <strong>the</strong> resource user to<br />
knowledge <strong>of</strong> “best practices” <strong>of</strong> equal or better economic significance.<br />
Husbandry <strong>of</strong> <strong>the</strong> resource is one option capable <strong>of</strong> sustainable enhancement <strong>of</strong> production. To maintain <strong>the</strong> needs<br />
and pressures <strong>of</strong> growing human populations, implementation <strong>of</strong> CBNRM needs to bring about change in<br />
community behaviour. Communities need to change from present practices <strong>of</strong> hunter/ga<strong>the</strong>rer scenario, and move a<br />
socio-economic step forward to <strong>the</strong> next stage in evolution <strong>of</strong> husbandry systems (ie. <strong>the</strong> active farming <strong>of</strong><br />
resources) (see Figure 2)(Balarin et al. 2001).
87<br />
Lake Malawi Fisheries Management Symposium - Proceedings<br />
Figure 2. Conceptual diagram <strong>of</strong> evolution trends in natural resource husbandry.<br />
Institutional Framework<br />
History <strong>of</strong> National Environmental Legislative Framework<br />
The history <strong>of</strong> some <strong>of</strong> <strong>the</strong> more relevant steps in legislative and policy development that have had influence on<br />
environmental <strong>management</strong> and <strong>fisheries</strong> are as follows:<br />
• 1994: National Environmental Action Plan (NEAP)(Vol I and II)<br />
• 1996: Environment Management Policy<br />
• 1996: Environment Management Act<br />
• 1996: Decentralization Policy<br />
• 1997: Fisheries Conservation and Management Act<br />
• 1998: EIA Guidelines<br />
• 1998: Environment Support Program (ESP)<br />
• 1998: First National State <strong>of</strong> <strong>the</strong> Environment Report (SOER)<br />
• 1998: Local Government Act<br />
• 1999: Fisheries and Aquaculture Policy<br />
• 2000: Subsidiary legislation (Community by-laws)<br />
• 2000: First Lake Chilwa State <strong>of</strong> <strong>the</strong> Environment Report<br />
• 2000: First District SOERs<br />
• 2001: First Lake Chilwa Management Plan.<br />
• 2001: First District EAPs<br />
• 2001: Poverty Reduction Strategy Paper (PRSP)
88<br />
Lake Malawi Fisheries Management Symposium - Proceedings<br />
The NEAP was Malawi’s response to Rio 1992, and set <strong>the</strong> stage for <strong>the</strong> formulation <strong>of</strong> <strong>the</strong> Environment Policy and<br />
Act. The Environment Management Act <strong>of</strong> 1996 placed responsibility for environmental <strong>management</strong> at <strong>the</strong> district<br />
level. Environmental monitoring, through State <strong>of</strong> <strong>the</strong> Environment Reporting (SOER) every 2 years and<br />
development <strong>of</strong> mitigation measure through Environmental Action Planning (EAP) every 5 years, became <strong>the</strong><br />
responsibility <strong>of</strong> <strong>the</strong> Assemblies assisted by a Environment District Officer (EDO).<br />
The Environment Act established a clear role for <strong>the</strong> mainstreaming <strong>of</strong> in natural resource <strong>management</strong> (NRM) in<br />
<strong>the</strong> local government structures, notably <strong>the</strong> Assemblies, Area Development Committees (ADC), Village<br />
Development Committees (VDC), and associated community institutions. Environment Impact Assessment (EIAs)<br />
were also a legal requirement for all development projects and <strong>the</strong> EIA guidelines established community<br />
consultation as an essential part <strong>of</strong> <strong>the</strong> process. Despite <strong>the</strong> Decentralization Policy <strong>of</strong> 1996, it was however not<br />
until <strong>the</strong> Local Government Act <strong>of</strong> 1998 that decentralization became a national objective, to place administrative<br />
authority for natural resource <strong>management</strong> (NRM) at <strong>the</strong> lowest appropriate level. This became effective in<br />
November 2000, when local government elections lead to <strong>the</strong> formation <strong>of</strong> <strong>the</strong> District Assemblies.<br />
The legal and political framework is now in place to empower communities to take a more pro-active role in NRM.<br />
The Environment Act and Local Government Act have become integrated through <strong>the</strong> Environmental Affairs<br />
Department (EAD) strategy for decentralised environmental <strong>management</strong> (EAD 2000, 2001 a, b and c). SOERs and<br />
EAPs are now integral parts <strong>of</strong> <strong>the</strong> decentralised, District Development Planning (DDP) process (OPC, 1998).<br />
The District Development Planning Framework and Fisheries Co-<strong>management</strong><br />
In <strong>the</strong> various stages in <strong>the</strong> District Development Planning (DDP) process, Figure 3 (OPC, 1998), community<br />
participation is essential. The DDP cycle from situation analysis, preparation <strong>of</strong> a district socio-economic pr<strong>of</strong>ile<br />
(SEP) culminating in a District Development Planning Framework (DDPF) is synonymous with SOER. SOER is a<br />
process <strong>of</strong> information compilation and analysis and a tool for information dissemination for better planning and<br />
decision making. The process assists communities and planner alike to identify environmental problems, and to<br />
illustrate trends and spatial distribution <strong>of</strong> pressure, state and response indicators (EAD, 2001 a). Prioritization <strong>of</strong><br />
environmental concerns or hot spots, leads to <strong>the</strong> formulation <strong>of</strong> appropriate development objectives and strategies.<br />
The next stage <strong>of</strong> <strong>the</strong> cycle from identification <strong>of</strong> mitigating actions, development options and formulation <strong>of</strong> <strong>the</strong><br />
DDP, for <strong>the</strong> environment sectors, is synonymous with <strong>the</strong> DEAP. DEAPs are community decisions for mitigation<br />
or environmental <strong>management</strong> <strong>of</strong> problems. Communities decide for each priority environmental concern, <strong>the</strong><br />
action, by who, where, when and how (EAD, 2001 a.). Thereafter, once approved by <strong>the</strong> Assembly, DEAPs are<br />
implemented through community based environmental micro-projects and an element <strong>of</strong> participatory M&E is<br />
involved.<br />
In so much as <strong>the</strong> DDP process is consultative and community based, so are <strong>the</strong> preparation <strong>of</strong> SOERs and EAPs.<br />
The process is flexible. It can be applied as a “fast track”, a means to identify priority hot spots that need immediate<br />
intervention even before <strong>the</strong> SOER and DEAP process is complete. The SOER and DEAPs are divided into chapters<br />
by sector, and <strong>fisheries</strong> is dealt with as a separate Chapter. The first district based SOERs and DEAPs are now under<br />
active preparation. Table 1 summarizes <strong>the</strong> status for <strong>the</strong> <strong>fisheries</strong> sector around Lake Malawi.<br />
Table 1. Status <strong>of</strong> decentralised environmental <strong>management</strong> in Lake Malawi Districts<br />
District<br />
Year DESC<br />
Status <strong>of</strong> SOER Status <strong>of</strong> EAPs<br />
Formed DSOER ADC SOER DEAP ADC EAP<br />
Karonga 1999 Draft Final Draft Final<br />
Rumphi 2000 Draft underway Draft underway<br />
Likoma 2001 not started not started not started not started<br />
Nkhata Bay 1998 Draft underway Draft underway<br />
Nkotakota 2000 Draft underway Draft underway<br />
Salima 2000 Draft underway Draft underway<br />
Dedza 1998 Draft underway Draft underway<br />
Mangochi 1998 Draft underway Draft underway<br />
Key: DESC - District Environment Sub-Committee; DEAP - District Environmental Action Plan; DSOER -<br />
District State <strong>of</strong> <strong>the</strong> Environment Report; ADC - Area Development Committee
Figure 3. SOER and DEAP in relation to District Development Planning System<br />
89<br />
Lake Malawi Fisheries Management Symposium - Proceedings<br />
National Environment Management Framework and Fisheries Co-<strong>management</strong><br />
The framework document, <strong>the</strong> National Environment Policy <strong>of</strong> Malawi recognizes <strong>the</strong> importance <strong>of</strong> CBNRM and<br />
calls for “national, regional and district development plans to integrate environmental concerns, in order to improve<br />
environmental <strong>management</strong> and ensure sensitivity to local concerns and needs”.<br />
The DEM strategy (EAD, 2000 a) allows for community based plans, separated by sector, to feed upwards from<br />
community to VDC to ADC level and be consolidated into <strong>the</strong> DEAPs. DEAPs aggregate into <strong>the</strong> NEAP from<br />
which emerge sector investment programs (SIPS). All NRM SIPs are compiled into <strong>the</strong> Environment Support<br />
Program (ESP) and fur<strong>the</strong>r, are consolidated into <strong>the</strong> national Poverty Reduction Support Program (PRSP), <strong>the</strong><br />
umbrella document for all national plans and government budgeting (Fig 4 a and b).<br />
Likewise, <strong>the</strong> SOERs from communities, pass to VDC to ADCs and consolidated in <strong>the</strong> DSOERs, are similarly<br />
aggregate into <strong>the</strong> NSOER and become <strong>the</strong> M&E tool <strong>of</strong> <strong>the</strong> NEAP. The SOERs are reported by <strong>the</strong> Minister to<br />
parliament every year and <strong>the</strong>reby provide a powerful opportunity for communities and districts to communicate<br />
<strong>the</strong>ir concerns and needs to <strong>the</strong> highest policy and decision making level.<br />
The institutionalization <strong>of</strong> <strong>the</strong> SOER DEAP process as part <strong>of</strong> <strong>the</strong> tools <strong>of</strong> <strong>fisheries</strong> co-<strong>management</strong> would provide<br />
<strong>the</strong> sector with a powerful tool for communities to lobby at <strong>the</strong> highest level for resources.
Figure 4a. CBNRM and <strong>the</strong> PRSP (adapted from <strong>the</strong> PRSP working group).<br />
90<br />
Lake Malawi Fisheries Management Symposium - Proceedings<br />
Figure 4b. The national framework for integration <strong>of</strong> EAPs into <strong>the</strong> national Budget.
91<br />
Lake Malawi Fisheries Management Symposium - Proceedings<br />
National Institutional Framework for Environmental Management<br />
Strategic objectives to achieve CBNRM would be to ensure that <strong>the</strong> emerging local government structures at District<br />
Assembly, Area Development Committee (ADC), Wards and Village Development Committee (VDC), provide a<br />
logical institutional anchor point for community based organizations such a Beach Village Committees. CBNRM<br />
should <strong>the</strong>refore be seen as a mainstreamed role <strong>of</strong> local government, and fits within <strong>the</strong> existing institutional<br />
framework for decentralised environmental <strong>management</strong> (Figure 5), notably:<br />
• Parliament is <strong>the</strong> highest policy making authority and it is advised by a Parliamentary Committee on <strong>the</strong><br />
Environment (PCE) that serve as <strong>the</strong> watchdog <strong>of</strong> policy and <strong>the</strong> state <strong>of</strong> <strong>the</strong> environment.<br />
• The Ministry co-ordinates <strong>the</strong> implementation <strong>of</strong> policy, law enforcement and EIA inspections, establishing<br />
standards and maintains international representation, co-ordinating conventions and donor support. The<br />
Ministry is advised by <strong>the</strong> National Council on <strong>the</strong> Environment.<br />
• The various NRM departments administer policy directives, formulate national plans and policy, guiding<br />
<strong>the</strong> districts, provide capacity building support, facilitate EIAs and compile sector NSOERs and NEAPs. To<br />
co-ordinate <strong>the</strong>se sectors, national environmental focal points have been established and <strong>the</strong>re is a National<br />
Steering Committee <strong>of</strong> <strong>the</strong>se focal points, made up <strong>of</strong> <strong>the</strong> directors <strong>of</strong> each sector.<br />
• At district level, <strong>the</strong> Assemblies co-ordinate preparation <strong>of</strong> <strong>the</strong> SOERs and DEAPs, and facilitate <strong>the</strong><br />
implementation <strong>of</strong> micro-projects and awareness campaigns.<br />
• The Assembly is assisted by a District Environment Sub-Committee (DESC)(Figure 6) made up <strong>of</strong> focal<br />
points from each <strong>of</strong> <strong>the</strong> Technical Directorates, assisted by <strong>the</strong> EDO and anchored in <strong>the</strong> <strong>of</strong>fice <strong>of</strong> <strong>the</strong><br />
District Planning Director. They serve to prepare <strong>the</strong> SOERs and EAPs, train <strong>the</strong> ADCs and VDCs, oversee<br />
micro-projects and generally mainstream environmental <strong>management</strong> into all planning processes at all<br />
levels.<br />
• Environment <strong>management</strong> should be mainstreamed in <strong>the</strong> roles <strong>of</strong> all <strong>the</strong> ADCs, Wards and VDCs, all <strong>the</strong><br />
way down to <strong>the</strong> communities.<br />
Decentralization and Fisheries Management<br />
Fisheries <strong>management</strong> in Malawi suffers from a number <strong>of</strong> concerns (Mapila, 2001), amongst which are:<br />
• A poor track record <strong>of</strong> enforcement <strong>of</strong> <strong>the</strong> law.<br />
• Unrestricted access due to problem in allocating security <strong>of</strong> tenure.<br />
• Poor access to research knowledge by <strong>the</strong> user groups.<br />
• Slow take <strong>of</strong>f <strong>of</strong> aquaculture.<br />
• No national or regional coordination mechanism.<br />
Under <strong>the</strong> Local Government Act, envisaged is that Assemblies will establish by laws and that <strong>the</strong>se shall be<br />
extended all <strong>the</strong> way down through <strong>the</strong> subsidiary authorities to community level. In <strong>fisheries</strong>, <strong>the</strong> fishing<br />
communities could be governed by district by-laws which take <strong>the</strong>ir point <strong>of</strong> departure from <strong>the</strong> national law. The<br />
assemblies could mobilize <strong>the</strong>ir legal and administrative powers to:<br />
• Police <strong>the</strong> resource, monitor use patterns and enforce regulations through <strong>the</strong> district police system.<br />
• Policing by <strong>the</strong> Assembly, would free up <strong>the</strong> Fisheries Officer, allowing a change from a policeman role to<br />
becoming a friend <strong>of</strong> <strong>the</strong> community and a technical advisor whose sole purpose would be to impart<br />
knowledge to change fishermen’s behaviour.<br />
• District by laws could provide rights <strong>of</strong> access through allocation <strong>of</strong> lease rights to VDCs who pay lease<br />
fees based on limited entry licensing. They in turn through <strong>the</strong> BVCs, allocate resource use rights and<br />
police those rights through <strong>the</strong>ir constitutions. Security <strong>of</strong> tenure will ultimately lead to behaviour change<br />
and see <strong>the</strong> introduction <strong>of</strong> husbandry systems.<br />
• The Local Government Act empowers one or more Assemblies to come toge<strong>the</strong>r to form an Inter-district<br />
Committee for common resource <strong>management</strong> like Lake Malawi. This could be extended to provincial<br />
administration in neighbouring states.<br />
In <strong>the</strong> coming years, <strong>the</strong> Fisheries Department will have to embark upon a devolution strategy for <strong>the</strong> sector. Some<br />
<strong>of</strong> <strong>the</strong> above becomes food for thought.
92<br />
Lake Malawi Fisheries Management Symposium - Proceedings<br />
Figure 5. Institutional framework for <strong>the</strong> coordination <strong>of</strong> environmental <strong>management</strong>
Figure 6. Institutional framework for decentralised environmental <strong>management</strong>.<br />
93<br />
Lake Malawi Fisheries Management Symposium - Proceedings<br />
Implications for Fisheries Co-<strong>management</strong><br />
In conclusion, in <strong>fisheries</strong> <strong>the</strong> implications <strong>of</strong> decentralization are that <strong>the</strong> Beach Village Committees (BVC) now<br />
find an anchor point in <strong>the</strong> District Assembly for legal recourse to enforce <strong>the</strong>ir constitutions through district bylaws.<br />
In addition, access rights through leasehold becomes possible and this will bring with it a change in behaviour<br />
favouring a more husbandry type approach to <strong>management</strong>.<br />
In addition, <strong>the</strong> BVCs through participation in <strong>the</strong> SOER process are able to undertake a consultative situation<br />
analysis, to better understand <strong>the</strong>ir problems and to identify problem areas or environmental “hot spots” and bring<br />
<strong>the</strong>se to <strong>the</strong> attention <strong>of</strong> <strong>the</strong> authorities. SOERs are published as district reports, consolidated into national reports<br />
and presented to Parliament every year. This provides communities a powerful tool to lobby at <strong>the</strong> highest level for<br />
support. SOERs allow community prioritization <strong>of</strong> problems to be dealt with through EAPs.<br />
The participatory process <strong>of</strong> EAP preparation means that BVCs participate in planning and take ownership <strong>of</strong> <strong>the</strong>ir<br />
own remedial actions to mitigate against prioritized problems. Generally <strong>the</strong>se are expressed in <strong>the</strong> form <strong>of</strong><br />
environmental micro-projects and would be included in <strong>the</strong> DDPs. At an inter-district level, <strong>the</strong> 8 Districts<br />
surrounding Lake Malawi will be able to come toge<strong>the</strong>r and <strong>the</strong>ir combined DDPs would make up a coherent and<br />
comprehensive Lake Malawi Management Plan. A similar initiative has already been completed for Lake Chilwa.<br />
Under <strong>the</strong> Local Government Act, <strong>the</strong> 8 districts could form an inter-district committee to manage Lake Malawi.
94<br />
Lake Malawi Fisheries Management Symposium - Proceedings<br />
The DDPs provide <strong>the</strong> District Assemblies with a basis for seeking funding from government, donors and o<strong>the</strong>r<br />
agencies. Currently available to <strong>the</strong> Lake Malawi BVCs are potential environmental micro-project funds from<br />
Danida, World Bank, Malawi Environment Endowment Trust (MEET), COMPASS/USAID, EU and GTZ.<br />
Key References<br />
Balarin, J. D., Jensen, A. and Ndovi, W (2001) Developing CBNRM Planning and Implementation Tools.<br />
Proceedings, National conference to Develop CBNRM Strategic Plan for Malawi, COMPASS: 14 p.<br />
COMPASS (2000a) Workshop on Principles and Approaches for CBNRM in Malawi. COMPASS Document 10:<br />
100p (March 2000).<br />
COMPASS (2000b) Draft Strategic Plan for CBNRM in Malawi. Compass Document 23: 56p (November 2000).<br />
EAD (2000) Strategy for Decentralization <strong>of</strong> Environmental Management. EAD publication: 50p. (Draft October<br />
2000).<br />
EAD (2001a) Decentralised Environmental Management Manual. Vol. I: A guide to<br />
SOER, DEAP and micro-project preparation. EAD: 126p. (Draft January 2001).<br />
EAD (2001b) Decentralised Environmental Management Manual. Vol. II: Data Capture Tool for SOER. EAD<br />
publication: 75p. (Draft January 2001).<br />
EAD (2001c) Decentralised Environmental Management Manual. Vol. III: A guide to environmental micro-projects.<br />
EAD publication: .. p(in preparation, April 2001).<br />
LGDMP (1999) Village Action Planning Manual for AEC level facilitators. LGDMP publication:160p.<br />
Mapila, S. A. (2001) Towards Responsible Development <strong>of</strong> <strong>the</strong> Fisheries Sector in Malawi. Department <strong>of</strong> Fisheries:<br />
41 p.<br />
OPC (1998) District Development Planning Handbook. OPC publication:128p. (March 1998).
Status <strong>of</strong> <strong>the</strong> small scale fishery in Malawi<br />
Mackson J.R. Ngochera<br />
Fisheries Research Unit, P. O. Box 27, Monkey-bay.<br />
95<br />
Lake Malawi Fisheries Management Symposium - Proceedings<br />
Abstract<br />
Most <strong>of</strong> Malawi’s population is dependent on <strong>fisheries</strong> directly or indirectly as a source <strong>of</strong> food security, livelihood and income. Total<br />
catch in <strong>the</strong> recent years for <strong>the</strong> major water bodies, Lake Malawi, Lake Malombe, Lake Chiuta, Upper Shire and Lower Shire have<br />
declined from an average <strong>of</strong> 60 thousand metric tons in <strong>the</strong> period 1976-1990 to 49 thousand metric tons in 1991-1999. Over <strong>the</strong><br />
same period, <strong>the</strong> number <strong>of</strong> fishermen increased by 27%, similarly <strong>the</strong> number <strong>of</strong> fishing gears and fishing crafts has also increased.<br />
Introduction<br />
The fish stocks <strong>of</strong> Malawian waters are, undoubtedly among <strong>the</strong> most important natural resources <strong>of</strong> Malawi. Out <strong>of</strong><br />
<strong>the</strong> 120000 km 2 area covered by Malawi, 20% is water (Weyl, 2001). There is <strong>the</strong>refore little doubt that a large<br />
number <strong>of</strong> Malawi’s population depends directly or indirectly on <strong>the</strong> fishery as a source <strong>of</strong> food security, livelihood<br />
and income. The value <strong>of</strong> fish does not lie only in <strong>the</strong>ir scientific interest, but also in <strong>the</strong>ir primordial nutritional<br />
status. It is a known fact that fish provides some 70% <strong>of</strong> <strong>the</strong> animal protein consumed by Malawians (Mkoko 1992,<br />
cited by Ribbink (1994) and Turner (1994b)). Currently <strong>the</strong> fishery employs over 48 000 fishermen (Weyl et al.<br />
2000) and fish also contributes about 4% to <strong>the</strong> Gross National Product (GNP) <strong>of</strong> <strong>the</strong> country.<br />
However, it has been noticed in <strong>the</strong> recent years that fish catches in Malawi have declined. The reasons are: <strong>the</strong> ever<br />
increasing fishing effort in <strong>the</strong> shallow waters; <strong>the</strong> absence <strong>of</strong> alternative employment; <strong>the</strong> rapidly growing human<br />
population, which exerts an increased fish demand, on <strong>the</strong> overexploited stocks (Turner 1995) and <strong>the</strong> use <strong>of</strong><br />
destructive fishing gears.<br />
The aim <strong>of</strong> this report is to provide an account <strong>of</strong> <strong>the</strong> status <strong>of</strong> <strong>the</strong> different <strong>fisheries</strong> and fish stocks <strong>of</strong> <strong>the</strong> major<br />
water bodies <strong>of</strong> Malawi. In agreement with <strong>the</strong> current practices in <strong>fisheries</strong> <strong>management</strong> an attempt is made to<br />
apply <strong>the</strong> principles <strong>of</strong> <strong>the</strong> precautionary approach. The FAO Code <strong>of</strong> Conduct for Responsible Fisheries, adopted in<br />
1995 stipulates in article 7.5: “States should apply <strong>the</strong> precautionary approach widely to conservation, <strong>management</strong><br />
and exploitation <strong>of</strong> living aquatic resources in order to protect <strong>the</strong>m and preserve <strong>the</strong> aquatic environment. The<br />
absence <strong>of</strong> adequate scientific information should not be used as a reason for postponing or failing to take<br />
conservation and <strong>management</strong> measures.’’<br />
The findings presented in this report are based on catch-effort data collected by <strong>the</strong> Department <strong>of</strong> Fisheries during<br />
<strong>the</strong> 1976-1999 period. The data was used to calculate CPUE (Catch Per Unit Effort) and relative effort. In <strong>the</strong><br />
analysis <strong>of</strong> catch and effort data, standard methods have been applied. For details <strong>of</strong> <strong>the</strong> methodology, a reference is<br />
made to Sparre and Vanema’s Introduction to Tropical Fish Stock Assessment (FAO 1992) where treatment <strong>of</strong> catch<br />
and effort data are explained in detail.<br />
Total catch in Lake Malawi<br />
Lake Malawi, <strong>the</strong> sou<strong>the</strong>rn most <strong>of</strong> <strong>the</strong> African Rift Valley Great Lakes, supports <strong>fisheries</strong> yielding some 30,000<br />
tons <strong>of</strong> fish annually from waters controlled by Malawi (Tweddle and Magasa, 1989). Over 88% <strong>of</strong> <strong>the</strong> total<br />
landings in Lake Malawi, come from <strong>the</strong> small-scale fishery although <strong>the</strong>re exists a large-scale commercial fishery.<br />
Total catches in <strong>the</strong> small-scale <strong>fisheries</strong> in Lake Malawi, for <strong>the</strong> period 1976-1999 is shown in Figure 1. A clear<br />
increasing trend in <strong>the</strong> period 1976-1989 is observed and peaks <strong>of</strong> more than 30 000 metric tons was attained in<br />
1987, 1989, 1996 and 1997. Catches fluctuated widely during <strong>the</strong> period 1990 – 1999 and <strong>the</strong> highest catch <strong>of</strong><br />
40 000 metric tons was recorded in 1996. The reason for this was <strong>the</strong> good usipa catch (Engraulicypris sardella) in<br />
that year.<br />
Figure 2 shows <strong>the</strong> average contribution to <strong>the</strong> total Lake Malawi small-scale fishery by <strong>the</strong> various districts.<br />
Mangochi and Salima accounted for 45% and 18% respectively. The high fish yields from <strong>the</strong>se two districts are<br />
mainly due to <strong>the</strong> suitable limnological conditions. In addition to <strong>the</strong> suitability <strong>of</strong> <strong>the</strong> area for highly productive<br />
fishing methods such as trawling and seining, <strong>the</strong> broad shallow shelf <strong>of</strong> <strong>the</strong>se areas supports high benthic<br />
productivity. The shape <strong>of</strong> <strong>the</strong> <strong>lake</strong> and <strong>the</strong> direction <strong>of</strong> <strong>the</strong> prevailing winds mean that seasonal upwelling <strong>of</strong><br />
nutrient-rich water occurs mainly in <strong>the</strong> south. (Eccles, 1974 cited by George F. Turner). Most <strong>of</strong> <strong>the</strong> rest <strong>of</strong> <strong>the</strong> <strong>lake</strong>
96<br />
Lake Malawi Fisheries Management Symposium - Proceedings<br />
is <strong>of</strong>ten rocky and very deep and <strong>the</strong> <strong>fisheries</strong> are mainly dependent on pelagic zooplankton-feeding fish, which in<br />
turn are supported by low pelagic primary productivity.<br />
Catch(metric tons)<br />
40000<br />
35000<br />
30000<br />
25000<br />
20000<br />
15000<br />
10000<br />
5000<br />
0<br />
1976<br />
1978<br />
Figure 1. Total traditional catch in Lake Malawi for <strong>the</strong> period 1976 – 1999.<br />
Nkhotakota<br />
13%<br />
Figure 2. Contribution to <strong>the</strong> total catch in Lake Malawi by district.<br />
1980<br />
Nkhata bay<br />
12%<br />
Salima<br />
18%<br />
Figure 3. Average species-group contribution to <strong>the</strong> total Lake Malawi catch<br />
1982<br />
O.big<br />
cicchlids<br />
3.5%<br />
O<strong>the</strong>rs<br />
7.2%<br />
Kambuzi<br />
8.0%<br />
Catf ish<br />
8.0%<br />
Chambo<br />
11.7%<br />
1984<br />
1986<br />
1988<br />
Year<br />
Likoma<br />
4%<br />
Ntchila<br />
0.3%<br />
1990<br />
Usipa<br />
28.7%<br />
1992<br />
Utaka<br />
32.7%<br />
1994<br />
Karonga<br />
8%<br />
1996<br />
1998<br />
Mangochi<br />
45%
97<br />
Lake Malawi Fisheries Management Symposium - Proceedings<br />
Catch composition by species group reveals that utaka has been <strong>the</strong> main dominating group with an average<br />
contribution <strong>of</strong> 32.7%, followed by usipa (28.7%) and chambo (11.7%)(Figure 3). These three species groups<br />
yielded 73.1% <strong>of</strong> <strong>the</strong> total average catch. Contribution by <strong>the</strong> o<strong>the</strong>r species groups has been in <strong>the</strong> range 0.3%-8%.<br />
Fisheries in Lake Malawi appear to be stable when analysed as a bulk biomass. However, when analysed at species<br />
or genus level, some <strong>of</strong> <strong>the</strong> most important stocks seem to have declined. The most apparent cases are those <strong>of</strong><br />
chambo stocks in Lake Malawi, which are considered to be in <strong>the</strong> state <strong>of</strong> decline and precautionary <strong>management</strong><br />
action, are recommended due to <strong>the</strong> excessive fishing effort (Pálson et al. 1999).<br />
Trends in fishing units.<br />
The number <strong>of</strong> fishermen operating in <strong>the</strong> waters <strong>of</strong> Malawi in <strong>the</strong> period 1990-94 (10 601-10 602) has been<br />
relatively stable but has increased by 27% in <strong>the</strong> following years (Figure 4). Also, within <strong>the</strong> same period, <strong>the</strong><br />
number <strong>of</strong> assistants/crew increased by 37%. Currently, <strong>the</strong>re are about 48 000 people that are directly employed in<br />
<strong>the</strong> fishery (Weyl et al. 1999).<br />
Dugout canoes operating in <strong>the</strong> waters <strong>of</strong> Malawi counted 9671 – 11457 in <strong>the</strong> period 1990 – 1999 signifying an<br />
increase <strong>of</strong> 18% (Figure 5). The number <strong>of</strong> plank-boats with engines over <strong>the</strong> same period 1990 – 99 has increased<br />
by 48% (360 – 534). However figures <strong>of</strong> 1993 and 1994 (449 393) are probably errors, since a decrease or increase<br />
<strong>of</strong> 50 units within a year is very unlikely. Plank-boats without engines have also increased by 38% (2 167 – 2 991)<br />
over <strong>the</strong> same period although in 1995 only 1 361 units were counted. This again is obviously an error since a<br />
change <strong>of</strong> such a scale is by no means reasonable.<br />
No/ <strong>of</strong> fishers<br />
Figure 4. Number <strong>of</strong> fishermen and assistants in Malawian waters 1990 – 99.<br />
16000<br />
14000<br />
12000<br />
10000<br />
8000<br />
6000<br />
4000<br />
2000<br />
0<br />
40000<br />
35000<br />
30000<br />
25000<br />
20000<br />
15000<br />
10000<br />
5000<br />
0<br />
1990 1991 1992 1993 1994 1995 1996 1997 1998 1999<br />
Gear ow ner Crew<br />
1990 1991 1992 1993 1994 1995 1996 1997 1998 1999<br />
Boat + engine Boat - engine Dugout canoes<br />
Figure 5. Number <strong>of</strong> small-scale fishing crafts Malawi for <strong>the</strong> period 1990-1999.<br />
The most important gears in Lake Malawi are gillnets, chilimira nets and kambuzi seines. The importance has been<br />
determined by looking at <strong>the</strong> amount <strong>of</strong> catch that each gear contributes in Lake Malawi. (Figure 6). The three gears
98<br />
Lake Malawi Fisheries Management Symposium - Proceedings<br />
contributed over 90% to <strong>the</strong> total Lake Malawi catch, gillnet (43.1%), chilimira (32.9%) and kambuzi seine (14.5%).<br />
Long-lines, chambo seine, mosquito net, fish trap and hand-lines are <strong>of</strong> intermediate importance. They contributed<br />
less than 10% to <strong>the</strong> total Lake Malawi catches and ranged from 0.4% - 3.3%.<br />
Contribution <strong>of</strong> <strong>the</strong> total catch by gillnets over <strong>the</strong> 24-year period has been relatively stable at an average catch <strong>of</strong> 7<br />
thousand metric tons. However, chilimira’s contribution has increased into <strong>the</strong> late 1990s from an average <strong>of</strong> 10<br />
thousand metric tons in <strong>the</strong> 1980s to 16 thousand metric tons in <strong>the</strong> 1990s. Kambuzi seine catches have fluctuated<br />
around an average catch <strong>of</strong> 2 thousand metric tons. The number <strong>of</strong> gillnets and chilimira have increased two-fold<br />
over <strong>the</strong> period 1990-1999 (from 19 699-43 318 for gill nets and from 1 479-2 568 for chilimira nets). The number<br />
<strong>of</strong> kambuzi seines however shows a declining trend over <strong>the</strong> same period, from 654 gears in 1990 to 343 gears in<br />
1999.<br />
a<br />
b<br />
Catch(metric tons)<br />
40000<br />
35000<br />
30000<br />
25000<br />
20000<br />
15000<br />
10000<br />
5000<br />
0<br />
1976<br />
Kambuzi<br />
14.5%<br />
Mosquito<br />
2.9%<br />
Longline<br />
3.3%<br />
1978<br />
Gillnet<br />
43.1%<br />
1980<br />
1982<br />
Handline<br />
0.4%<br />
1984<br />
1986<br />
Fishtrap<br />
1.1%<br />
Chambo<br />
seine<br />
1.8%<br />
Chilimira<br />
32.9%<br />
Figure 6. Gear contribution to <strong>the</strong> (a) total Lake Malawi catch and (b) annual Lake Malawi catch from<br />
1976 to 1999.<br />
1988<br />
1990<br />
1992<br />
1994<br />
1996<br />
Year<br />
Chilimira Gillnet Kambuzi O<strong>the</strong>rs<br />
1998
99<br />
Lake Malawi Fisheries Management Symposium - Proceedings<br />
Catch and effort in Lake Malawi.<br />
Catch, effort and CPUE in <strong>the</strong> sou<strong>the</strong>ast arm small-scale fishery is shown in Figure 7. Unless o<strong>the</strong>rwise stated, effort<br />
refers to <strong>the</strong> relative effort (YT(y) /R(y) where YT(y) is <strong>the</strong> total yield <strong>of</strong> all gears and R(y) is <strong>the</strong> sum <strong>of</strong> relative<br />
CPUE weighted by <strong>the</strong> yields in year (y), normalized effort where all <strong>the</strong> small-scale fishing gears have been<br />
standardized to a common effort unit. CPUE also refers to weighted, relative CPUE where relative catch per unit<br />
effort <strong>of</strong> each gear has been weighted by <strong>the</strong> catch taken by that gear (For fur<strong>the</strong>r details see; Sparre, P. & Venema,<br />
S.C., 1992. Introduction to tropical fish stocks assessment. Part I- Manual. FAO Fisheries Technical Paper, 306/1,<br />
376 pp).<br />
Catches have increased into <strong>the</strong> 1990s from 5 000 metric tons in <strong>the</strong> 1970s to 10 000 tons and a highest catch <strong>of</strong><br />
about 20000 metric tons recorded in 1996 mainly due to high usipa catches in that year. Effort increased in <strong>the</strong> mid<br />
1980s and has been at a relatively high level in <strong>the</strong> 1990s. CPUE however has declined except <strong>the</strong> high value<br />
recorded in 1996.<br />
Effort and CPUE<br />
2.50<br />
2.00<br />
1.50<br />
1.00<br />
0.50<br />
0.00<br />
1976<br />
Figure 7. Catch, effort and CPUE in <strong>the</strong> South East Arm <strong>of</strong> Lake Malawi for <strong>the</strong> period 1976 – 1999.<br />
To obtain an estimate <strong>of</strong> maximum sustainable yield (MSY) for <strong>the</strong> sou<strong>the</strong>ast arm <strong>of</strong> Lake Malawi, relative effort<br />
and relative CPUE for <strong>the</strong> period 1976 – 1999 was used. There was fairly good correlation between ln(CPUE) and<br />
effort. The Fox surplus production model was fitted to <strong>the</strong> data to yield initial MSY estimates for <strong>the</strong> sou<strong>the</strong>ast arm<br />
fishery (Figure 8).<br />
Catch(metric tons)<br />
1978<br />
25000<br />
20000<br />
15000<br />
10000<br />
5000<br />
0<br />
1980<br />
83<br />
99<br />
93<br />
80<br />
82<br />
77<br />
88<br />
86<br />
78 85<br />
79 76<br />
95<br />
90<br />
0 2000 4000 6000 8000 10000 12000 14000 16000<br />
Relative effort<br />
Fox Total Yield Poly. (Fox)<br />
Figure 8. Fox surplus production function <strong>of</strong> <strong>the</strong> SE Arm 1976-99<br />
1982<br />
1984<br />
1986<br />
1988<br />
1990<br />
1992<br />
96<br />
87<br />
1994<br />
97<br />
1996<br />
89<br />
94<br />
91<br />
1998<br />
Catch Relative CPUE Normalised effort<br />
92<br />
98<br />
25000<br />
20000<br />
15000<br />
10000<br />
5000<br />
0<br />
Catch(metric tons)
100<br />
Lake Malawi Fisheries Management Symposium - Proceedings<br />
The statistical quality <strong>of</strong> <strong>the</strong> data is fairly reasonable since a regression <strong>of</strong> CPUE and effort gave a coefficient <strong>of</strong><br />
determination <strong>of</strong> 57%. The results <strong>of</strong> <strong>the</strong> Fox model are estimated at 10 502 metric tons at an effort level <strong>of</strong> 16 667<br />
units. It is however evident that MSY <strong>of</strong> 10 000 tons was exceeded in <strong>the</strong> late 1980s to mid 1990s. Although catches<br />
seem to be increasing, <strong>the</strong> increase in effort in <strong>the</strong> recent years might have remarkable effects in <strong>the</strong> long run.<br />
Catch, effort and CPUE in <strong>the</strong> sou<strong>the</strong>ast arm traditional fishery is shown in Figure 9. Catches have fluctuated<br />
throughout <strong>the</strong> period, around a mean <strong>of</strong> 6 000 tons. Effort was relatively low until late 1980s when it increased and<br />
has remained at that high level, but fluctuating in <strong>the</strong> 1990s. CPUE however has declined in <strong>the</strong> early 1980s from<br />
high values in <strong>the</strong> late 1970s and has since remained at that low level.<br />
Effort and CPUE<br />
3.50<br />
3.00<br />
2.50<br />
2.00<br />
1.50<br />
1.00<br />
0.50<br />
0.00<br />
1976<br />
1978<br />
1980<br />
Figure 9. Catch, effort and CPUE in <strong>the</strong> South West Arm <strong>of</strong> Lake Malawi for <strong>the</strong> period 1976 – 1999.<br />
To obtain an estimate <strong>of</strong> MSY in <strong>the</strong> South West Arm <strong>of</strong> Lake Malawi, relative effort and relative CPUE data was<br />
used. There was a good correlation between ln CPUE and relative effort. The Fox surplus production model was<br />
fitted to <strong>the</strong> data to yield initial MSY estimates for <strong>the</strong> SW Arm fishery (Figure 10). The statistical quality <strong>of</strong> <strong>the</strong><br />
data is also fairly reasonable since a regression <strong>of</strong> CPUE and effort gave a coefficient <strong>of</strong> determination <strong>of</strong> 58%.<br />
The results <strong>of</strong> <strong>the</strong> Fox model are estimated at 6 839 metric tons at an effort level <strong>of</strong> 10 000 units. It is however<br />
evident that MSY was attained at relative effort levels that exceeded current effort and it appears that fMSY was<br />
exceeded in <strong>the</strong> in <strong>the</strong> 1980s to 1990s with no stock recovery (Weyl et al, 2001 in press)<br />
Catch<br />
12000<br />
10000<br />
8000<br />
6000<br />
4000<br />
2000<br />
0<br />
Figure 10. Fox surplus production function <strong>of</strong> <strong>the</strong> SW Arm 1976-1999.<br />
1982<br />
1984<br />
1986<br />
1988<br />
Year<br />
1990<br />
1992<br />
1994<br />
1996<br />
1998<br />
12000<br />
10000<br />
8000<br />
6000<br />
4000<br />
2000<br />
Total Yield Relative CPUE Normalised Effort<br />
81<br />
77<br />
83<br />
78<br />
86<br />
82<br />
76<br />
79<br />
80 84<br />
84<br />
87<br />
88<br />
91<br />
96<br />
89<br />
98<br />
95<br />
97<br />
85<br />
93 90<br />
99<br />
0 5000 10000 15000 20000<br />
Relative ef fort<br />
92<br />
0<br />
Catch (metric tons)
101<br />
Lake Malawi Fisheries Management Symposium - Proceedings<br />
Catch, effort and CPUE in Domira-bay for <strong>the</strong> period 1976-99 are shown in Figure 11. Catches have declined from<br />
high values in <strong>the</strong> 1970s and late 1980s. Effort however has remained relatively stable except <strong>the</strong> high value in 1989.<br />
CPUE has declined from high values in <strong>the</strong> early 1980s and has remained at that low level.<br />
Catch, effort and CPUE in Nkhota-kota for <strong>the</strong> period 1976-1999 are shown in figure 12. Catches show an<br />
increasing trend from low values in <strong>the</strong> 1970s to high values in <strong>the</strong> 1990s. Effort was relatively low in <strong>the</strong> 1970s but<br />
increased substantially in mid 1980s and has remained at that high level. CPUE has remained relatively stable.<br />
Effort/CPUE<br />
3.50<br />
3.00<br />
2.50<br />
2.00<br />
1.50<br />
1.00<br />
0.50<br />
0.00<br />
Figure 11. Catch, effort and CPUE in Domira-bay from 1976-99.<br />
Ef f ort/CPUE<br />
2.50<br />
2.00<br />
1.50<br />
1.00<br />
0.50<br />
0.00<br />
1977<br />
1976<br />
1980<br />
Figure 12. Catch, effort and CPUE in Nkhota-kota from 1976-99.<br />
1983<br />
1986<br />
1989<br />
Catch, effort and CPUE for Nkhata-bay for <strong>the</strong> period 1976-1999 are shown in Figure 13. Catches show an<br />
increasing trend. Effort has also taken a similar trend, increasing from low values in <strong>the</strong> 1970s to high values in <strong>the</strong><br />
1990s except <strong>the</strong> low values in 1995 and 1996. CPUE however has remained relatively stable.<br />
Catch, effort and CPUE in Likoma Island over <strong>the</strong> period 1976-1999 are shown in Figure 14. Catches have<br />
fluctuated without a definite trend. Effort has declined in <strong>the</strong> early 1990s from high levels in <strong>the</strong> 1970s and 1980s.<br />
CPUE has also fluctuated greatly without a definite trend.<br />
1992<br />
1995<br />
1998<br />
Catch<br />
Year<br />
Relative CPUE Normalised effort<br />
1979<br />
1982<br />
1985<br />
1988<br />
Year<br />
1991<br />
1994<br />
1997<br />
Catch Relative CPUE Normalised effort<br />
3500<br />
3000<br />
2500<br />
2000<br />
1500<br />
1000<br />
500<br />
0<br />
8000<br />
6000<br />
4000<br />
2000<br />
0<br />
Catch(metric tons)<br />
10000<br />
Catch(metric tons)
102<br />
Lake Malawi Fisheries Management Symposium - Proceedings<br />
Catch, effort and CPUE for Karonga for <strong>the</strong> period 1976-1999 are shown in Figure 15. Catches show an increasing<br />
trend from low values in <strong>the</strong> 1980s. Effort has also taken a similar trend, increasing from low values in <strong>the</strong> 1980s.<br />
CPUE however has remained relatively stable.<br />
Effort/CPUE<br />
3.50<br />
3.00<br />
2.50<br />
2.00<br />
1.50<br />
1.00<br />
0.50<br />
0.00<br />
1976<br />
1979<br />
Figure 13. Catch, effort and CPUE in Nkhata-bay from 1976-99.<br />
Effort/CPUE<br />
Figure 14. Catch, effort and CPUE in Likoma from 1976-99.<br />
Effort/CPUE<br />
3.50<br />
3.00<br />
2.50<br />
2.00<br />
1.50<br />
1.00<br />
0.50<br />
0.00<br />
2.50<br />
2.00<br />
1.50<br />
1.00<br />
0.50<br />
0.00<br />
1976<br />
1980<br />
Figure 15. Catch, effort and CPUE in Karonga from 1976-99.<br />
1982<br />
1985<br />
1988<br />
1991<br />
1994<br />
1997<br />
Catch<br />
Year<br />
Relative CPUE Normalised effort<br />
1979<br />
1982<br />
1985<br />
1988<br />
1991<br />
1994<br />
1997<br />
Catch<br />
Year<br />
Relative CPUE Normalised effort<br />
1983<br />
1986<br />
1989<br />
Year<br />
1992<br />
1995<br />
1998<br />
Catch Relative CPUE Normalised effort<br />
6000<br />
5000<br />
4000<br />
3000<br />
2000<br />
1000<br />
0<br />
6000<br />
5000<br />
4000<br />
3000<br />
2000<br />
1000<br />
0<br />
4000<br />
3500<br />
3000<br />
2500<br />
2000<br />
1500<br />
1000<br />
500<br />
0<br />
Catch(metric tons)<br />
Catch(metric tons)<br />
Catch(metric tons)
103<br />
Lake Malawi Fisheries Management Symposium - Proceedings<br />
Trends in total catch<br />
Total catches in Malawian waters fluctuated between 50 and 60 thousand metric tons in <strong>the</strong> period 1976-86 (Figure<br />
16). During <strong>the</strong> period 1987-91, catches were in <strong>the</strong> range <strong>of</strong> 60-70 thousand metric tons. Catches declined in <strong>the</strong><br />
early 1990s to a minimum <strong>of</strong> 30 thousand metric tons in 1995. The decline in total catch as seen from Figure 16 is<br />
caused by declining catches in o<strong>the</strong>r water bodies o<strong>the</strong>r than Lake Malawi, in particular in Lake Malombe, Lake<br />
Chilwa, Lake Chiuta and <strong>the</strong> Lower Shire. Also <strong>the</strong> reduced catches in <strong>the</strong> commercial fishery contributes to <strong>the</strong><br />
decline.<br />
Traditional catches in Lake Malawi increased into <strong>the</strong> late 1980s to a peak <strong>of</strong> 33 thousand metric tons in 1987. After<br />
which catches have remained relatively stable. The highest catch in Lake Malawi traditional <strong>fisheries</strong> was recorded<br />
in 1996 (37 thousand tons). Traditional <strong>fisheries</strong> in o<strong>the</strong>r water bodies o<strong>the</strong>r than Lake Malawi were relatively stable<br />
until early 1990s, fluctuating around 30 thousand metric tons with a peak <strong>of</strong> 45 thousand metric tons in 1990.<br />
Catches however declined by 1994 to some 20 thousand metric tons and <strong>the</strong>y dropped to 6-10 thousand metric tons<br />
in 1995/96. The main reason for <strong>the</strong> low catches in <strong>the</strong>se two years is primarily due to <strong>the</strong> low or zero catches in<br />
Lake Chilwa when it dried up.<br />
Catch(metric tons)<br />
90000<br />
80000<br />
70000<br />
60000<br />
50000<br />
40000<br />
30000<br />
20000<br />
10000<br />
0<br />
1976<br />
1978<br />
Figure 16. Annual catch contribution by water body from 1976-99 (* traditional and commercial).<br />
Management measures<br />
Current <strong>fisheries</strong> <strong>management</strong> regulations are based on technical restriction <strong>of</strong> fishing gears, i.e. gear mesh size or<br />
size <strong>of</strong> gear (head line length) and restrictions <strong>of</strong> fishing areas or fishing times- closed areas and seasons for o<strong>the</strong>r<br />
gears such as beach seines. A number <strong>of</strong> gears are without any restrictions such as longlines except for permissible<br />
setting times in Lake Malawi, hand lines, scoop nets and cast nets. Some gear types are locally prohibited such as<br />
kauni for chambo, nkacha in Lake Malawi, beach seines in Lake Chiuta, upper shire and in rivers and dams. Some<br />
species are subject to minimum size i.e. all species <strong>of</strong> chambo (Oreochromis) 15.0 cm, o<strong>the</strong>r tilapia e.g.<br />
Oreochromis shiranus shiranus 10.0 cm folk length and mpasa (Opsaridium microleps) 30.0 cm fork length.<br />
The traditional <strong>fisheries</strong> are ‘’open entry’’, although a license is formally needed to operate in that fishery. An<br />
annual basic fee must be paid depending on <strong>the</strong> type <strong>of</strong> gear being used. In view <strong>of</strong> <strong>the</strong> current status <strong>of</strong> <strong>fisheries</strong> and<br />
fish stocks in Malawian waters, <strong>the</strong> effectiveness <strong>of</strong> <strong>the</strong>se measures appears to be limited.<br />
The fishery in <strong>the</strong> o<strong>the</strong>r smaller water bodies however show declining trends in catch and CPUE and many appear<br />
currently to be at low level in terms <strong>of</strong> resource status (Table 1). The prospects for <strong>fisheries</strong> in Lakes Chilwa, Chiuta,<br />
Malombe and upper shire seem to be extremely discouraging. However due to heavy limitations <strong>of</strong> available data for<br />
Lakes Chilwa and Chiuta, precise recommendations are not given at this stage.<br />
In summary, recommended precautionary <strong>management</strong> actions are as follows:<br />
Lake Malawi traditional fishery:<br />
1980<br />
1982<br />
1984<br />
1986<br />
1988<br />
1990<br />
1992<br />
1994<br />
1996<br />
1998<br />
*L.Malaw i L.Malombe<br />
Year<br />
L.Chilw a L.Chiuta U+L.Shire
104<br />
Lake Malawi Fisheries Management Symposium - Proceedings<br />
• Total <strong>lake</strong> wide ban on chambo seines and ban on kauni for chambo in Area A in order to restore <strong>the</strong><br />
chambo stocks.<br />
Lake Malombe fishery:<br />
• Total ban on gill nets and chambo seines, in order to restore <strong>the</strong> chambo stocks.<br />
• Effort limitations <strong>of</strong> nkacha and kambuzi seine by denying new entries in order to maintain kambuzi<br />
stocks.<br />
Lake Chilwa fishery:<br />
• Currently no <strong>management</strong> recommendations since <strong>the</strong> fishery are seasonal i.e. <strong>the</strong> <strong>lake</strong> dries up.<br />
Lake Chiuta fishery:<br />
• Reduction in effort in order to restore stocks.<br />
Upper Shire fishery:<br />
• Total ban on seines and gill nets, in order to restore stocks.<br />
Table 1. Summary <strong>of</strong> <strong>the</strong> status <strong>of</strong> <strong>fisheries</strong> and fish stocks in Malawian waters (after Bulirani et al. 1999).<br />
Fish Long term trends (1976-1999)<br />
Stock(s) Fishery/Survey Waterbody Area(s) Catch Effort CPUE<br />
All Traditional South East Arm All Increasing Increasing Decreasing<br />
All Traditional South West Arm All Variable Increasing Decreasing<br />
All Traditional Domira-bay All Decreasing Stable Decreasing<br />
All Traditional Nkhotakota All Increasing Increasing Stable<br />
All Traditional Nkhata-bay All Increasing Increasing Stable<br />
All Traditional Likoma All Variable Decreasing Variable<br />
All Traditional Karonga All Increasing Increasing Stable<br />
All Traditional Lake Malombe All Decreasing Increasing Decreasing<br />
All Traditional Lake Chilwa All Decreasing Increasing Decreasing<br />
All Traditional Lake Chiuta All Decreasing Increasing Decreasing<br />
Chambo Traditional Lake Malawi All Decreasing Increasing Decreasing<br />
Chambo Traditional Lake Malombe All Decreasing Increasing Decreasing<br />
Chambo Traditional Upper Shire All Decreasing Variable Decreasing<br />
Kampango Traditional Lake Malawi All Decreasing Increasing Decreasing<br />
Bombe Traditional Lake Malawi All Decreasing Increasing Decreasing<br />
Utaka Traditional Lake Malawi All Variable Increasing Decreasing<br />
Usipa Traditional Lake Malawi All Increasing Increasing Variable<br />
Kambuzi Traditional Lake Malawi All Increasing Increasing Stable<br />
Kambuzi Traditional Lake Malombe All Decreasing Stable Stable<br />
References<br />
Bulirani A.E., Banda M.C., Pálson Ó.K., Weyl O.L.F., Kanyerere G.Z., Manase M., Sipawe R., 1999. Fish Stocks<br />
and Fisheries <strong>of</strong> Malawian Waters: Resource Report. Government <strong>of</strong> Malawi, Fisheries Department,<br />
Fisheries Research Unit.54pp.<br />
Kolding, J. Population ecology and simple sustainable yield estimators in <strong>fisheries</strong>: a review. University <strong>of</strong> Bergen,<br />
High Technology Centre, Norway.<br />
Pálson Ó.K., Bulirani A., Banda M, 1999. A review <strong>of</strong> biology, <strong>fisheries</strong> and population dynamics <strong>of</strong> chambo<br />
(Oreochromis spp., CICHLIDAE) in Lakes Malawi and Malombe. Malawi Fisheries Bulletin.<br />
Sparre, P. and Venema, S.C., 1992. Introduction to tropical fish stock Assessment. Part I – Manual. FAO Fisheries<br />
Technical Paper, 306/1, 376pp.<br />
Turner, G.F., 1995. Management, conservation and species changes <strong>of</strong> exploited Fish stocks in Lake Malawi in The<br />
Impact <strong>of</strong> Species Changes in African Lakes. Tweddle, D. and Magasa, J.D. (1989) Assessment <strong>of</strong> multispecies<br />
cichlid Fisheries <strong>of</strong> <strong>the</strong> Sou<strong>the</strong>ast Arm <strong>of</strong> Lake Malawi, Africa. J. Cons. int. Explor. Mer., 45: 209 –<br />
222.<br />
Weyl O.L.F., Banda M, Sodzabanja G., Mwenekibombwe L.H., Namoto W., Mponda O.C., 2000. Annual<br />
Frame Survey, September 1999. Fisheries Bulletin No.42. Fisheries Department, Lilongwe, Malawi.<br />
Weyl, O.L.F. 2001, Small-scale <strong>fisheries</strong> statistics summary. Short communication No. 2
105<br />
Lake Malawi Fisheries Management Symposium - Proceedings<br />
Effects <strong>of</strong> overfishing on reproductive potential <strong>of</strong> major cichlid fish species in<br />
sou<strong>the</strong>rn Lake Malombe (Malawi): need for “closed area” strategy as a<br />
complementary <strong>management</strong> option?<br />
Collins Jambo 1 and Tom Hecht 2<br />
1 Fisheries Research Unit, P.O. Box 27, Monkey Bay, Malawi.<br />
2 Department <strong>of</strong> Ichthyology and Fisheries Science, Rhodes University, P.O. Box 94, 6140 Grahamstown, South Africa.<br />
Abstract<br />
The three major species Lethrinops ‘pinkhead’, Otopharynx argyrosoma ‘red’ and Copadichromis cf. virginalis, which used to<br />
contribute about 75% to <strong>the</strong> total catches (by weight) <strong>of</strong> Lake Malombe in <strong>the</strong> last decade were investigated. The main aim <strong>of</strong> <strong>the</strong><br />
investigation was to assess <strong>the</strong> impact <strong>of</strong> fishing intensity on reproductive potential <strong>of</strong> <strong>the</strong> three species. Fecundity, reproductive<br />
seasonality, sexual maturity, and sex ratio were related to habitat types <strong>of</strong> <strong>the</strong> south western side (heavily fished) and south eastern<br />
side (lightly fished). The three species have low fecundity and <strong>the</strong>y are synchronous spanners, with a breeding peak during July to<br />
October period. Females <strong>of</strong> all three species mature earlier than males while <strong>the</strong> sex ratio <strong>of</strong> <strong>the</strong> three species was not significantly<br />
different from 1:1 in both sides <strong>of</strong> <strong>the</strong> <strong>lake</strong>. The length-fecundity relationships for L. ’pinkhead’ and O. argyrosoma ‘red’ indicated that<br />
fecundity was more closely related to length in <strong>the</strong> south eastern side than in <strong>the</strong> western side. The frequency occurrence <strong>of</strong> mature<br />
females and juveniles was greater in <strong>the</strong> south eastern side than in <strong>the</strong> south western side <strong>of</strong> <strong>the</strong> <strong>lake</strong>. Juveniles <strong>of</strong> Oreochromis<br />
spp. (chambo) were also abundant in <strong>the</strong> south eastern side. The south eastern side <strong>of</strong> <strong>the</strong> <strong>lake</strong> is characterised by low fishing<br />
intensity, muddy substratum and aquatic macrophytes. It is also functioning as a spawning area for Oreochromis spp. and nursery<br />
area for <strong>the</strong> three haplochromines. These findings provisionally suggest that <strong>the</strong> efficacy <strong>of</strong> closed area method as an additional<br />
<strong>management</strong> tool in Lake Malombe. Such a <strong>management</strong> tool would protect juveniles and breeding stocks <strong>of</strong> <strong>the</strong> main species,<br />
hence meet <strong>the</strong> criteria <strong>of</strong> ensuring <strong>the</strong> sustainability and utilisation <strong>of</strong> fish stocks in Lake Malombe.<br />
Key words: reproduction, fishing intensity, closed area, <strong>management</strong>, Lake Malombe and haplochromines<br />
Introduction<br />
The Lake Malombe fishery has been under severe fishing pressure since 1986 (FAO 1992, Coulter 1993). The<br />
fishery provides <strong>the</strong> cheapest dietary protein to <strong>the</strong> entire human population surrounding <strong>the</strong> <strong>lake</strong> and directly<br />
employs 4660 people. During 1970-1986 period, Oreochromis spp. (chambo) used to dominate <strong>the</strong> catches but<br />
collapsed in 1988. The collapse <strong>of</strong> <strong>the</strong> chambo fishery prompted artisanal fishers to use fine-meshed nets with which<br />
to target <strong>the</strong> small haplochromines (kambuzi). As such, small haplochromines became predominant in <strong>the</strong> catches<br />
after <strong>the</strong> collapse <strong>of</strong> <strong>the</strong> chambo fishery. During 1986-1993, three haplochromines (Lethrinops ‘pinkhead’, O.<br />
argyrosoma ‘red’ and Copadichromis cf. virginalis) contributed about 75% to <strong>the</strong> total annual catch <strong>of</strong> 8 000 tons<br />
(FAO 1993). However, five haplochromines currently constitute about 67% <strong>of</strong> <strong>the</strong> total annual catch by weight<br />
(Jambo 1997).<br />
Recent findings indicate that catches <strong>of</strong> kambuzi have declined from 20 kg per haul in <strong>the</strong> late 1980s (Tweddle et al.<br />
1995) to 3.5 kg per haul (Jambo 1997), indicating that <strong>the</strong> Lake Malombe fishery has been overexploited. The<br />
current overall decline <strong>of</strong> small haplochromines threatens both <strong>the</strong> livelihood <strong>of</strong> <strong>the</strong> rural people who depend on fish<br />
as <strong>the</strong>ir source <strong>of</strong> animal protein and employment, as well as <strong>the</strong> nation’s animal protein supply as a whole.<br />
Considering <strong>the</strong> fact that many African Great Lakes cichlids are narrowly stenotopic, philopatric and practise mouth<br />
brooding (Ribbink et al. 1983), in a way to safe guard <strong>the</strong>ir <strong>of</strong>fspring within <strong>the</strong> same habitat, such a drastic decline<br />
in catch per unit effort threatens <strong>the</strong> biodiversity <strong>of</strong> fish species in Lake Malombe. Fur<strong>the</strong>r increase in fishing effort<br />
and inappropriate use <strong>of</strong> fishing gears on <strong>the</strong> remaining small populations would consequently lead to a total<br />
collapse <strong>of</strong> <strong>the</strong> kambuzi fishery.<br />
Based on Roberts & Polunin (1991) views it was hypo<strong>the</strong>sised, in this study, that high fishing intensity in <strong>the</strong> south<br />
western side <strong>of</strong> Lake Malombe might have depleted populations <strong>of</strong> adult fishes and reduced <strong>the</strong> average size <strong>of</strong><br />
females, resulting in poor recruitment into <strong>the</strong> fishery. In order to test this hypo<strong>the</strong>sis, aspects <strong>of</strong> reproductive<br />
biology <strong>of</strong> <strong>the</strong> three principal haplochromines were investigated in <strong>the</strong> south western side (heavily fished) and south<br />
eastern side (lightly fished) <strong>of</strong> <strong>the</strong> <strong>lake</strong>. The main aim <strong>of</strong> <strong>the</strong> investigation was to assess <strong>the</strong> impact <strong>of</strong> fishing<br />
intensity on reproductive potential <strong>of</strong> <strong>the</strong> three principal species, with a view <strong>of</strong> formulating decisions to do with <strong>the</strong><br />
placing and size <strong>of</strong> a protected area.<br />
Materials and methods<br />
A monthly sample <strong>of</strong> 25 to 45 fish for each species was collected from each sampling station. A standard nkacha<br />
<strong>of</strong>fshore seine net (250 metres long and 9 metres deep) was used at all stations on each sampling trip. The nkacha<br />
<strong>of</strong>fshore seine net is an active gear with a gradation <strong>of</strong> mesh sizes <strong>of</strong> 39 mm and 25 mm on <strong>the</strong> wings and 19 mm on<br />
<strong>the</strong> bunt. It involves divers who pull <strong>the</strong> footrope and tie weights toge<strong>the</strong>r to ‘purse’ <strong>the</strong> net. Sampling stations were
106<br />
Lake Malawi Fisheries Management Symposium - Proceedings<br />
located along two transects across <strong>the</strong> <strong>lake</strong>. On each transect, two sampling stations were situated in <strong>the</strong> south<br />
western side and <strong>the</strong> o<strong>the</strong>r two stations in <strong>the</strong> south eastern side <strong>of</strong> <strong>the</strong> <strong>lake</strong> (Figure 1).<br />
Figure 1. Map <strong>of</strong> Sou<strong>the</strong>rn Lake Malombe showing <strong>the</strong> location <strong>of</strong> major landing sites and sampling<br />
stations. SS refers to sampling stations on <strong>the</strong> two transects.<br />
For each specimen, total length to <strong>the</strong> nearest millimetre and total body mass to <strong>the</strong> nearest gram were measured.<br />
Fish mass was taken as <strong>the</strong> mass <strong>of</strong> <strong>the</strong> fish minus gut contents. The breeding seasons as well as sexual maturity<br />
were determined by a monthly visual appraisal <strong>of</strong> <strong>the</strong> gonad activity stages. The visual assessment <strong>of</strong> gonadal stages<br />
was done using <strong>the</strong> descriptions <strong>of</strong> Marsh et al. (1986) (Table 1). To eliminate possible error, only those data which<br />
were collected during <strong>the</strong> peak period <strong>of</strong> gonad activity, were used.<br />
To establish <strong>the</strong> breeding seasonality, <strong>the</strong> percentage frequency occurrence <strong>of</strong> females with active ripe (AR), ripe<br />
(R) and spent (S) stages for each species, was plotted against sampling time (months). The breeding season was <strong>the</strong>n<br />
identified by comparing peaks <strong>of</strong> AR, R and S stages. Only mature females with AR, R and S gonadal stages were<br />
used in this investigation to avoid <strong>the</strong> possible masking effect, which immature fish could have had on <strong>the</strong> results.<br />
To establish <strong>the</strong> length at 50% sexual maturity, with minimal possible error, <strong>the</strong> data collected during <strong>the</strong> period <strong>of</strong><br />
maximum gonad activity were used. Fish with active ripe, ripe and spent gonads were considered mature. For each<br />
species and sex, <strong>the</strong> percentage frequency <strong>of</strong> such mature fish was plotted against total length. A logistic curve was<br />
fitted to <strong>the</strong> percentage <strong>of</strong> sexually mature individuals by length (L), using King's (1995) equation:<br />
P = 1/(1 + e -r(L - L m )<br />
where r is <strong>the</strong> slope <strong>of</strong> <strong>the</strong> curve and Lm is <strong>the</strong> mean length which corresponds to size at 50% maturity. The logistic<br />
curve was used in order to minimise unreasonably high estimation <strong>of</strong> Lm.
Table 1. Criteria used for categorising gonads to reproductive stage.<br />
Stage Description <strong>of</strong> female gonadal stages<br />
Immature (I) Eggs were elongate, pale yellow / pale orange in colour<br />
107<br />
Lake Malawi Fisheries Management Symposium - Proceedings<br />
Active Ripe (AR) Eggs were ovoid in shape and <strong>the</strong>y were closely packed and pale orange in<br />
colour<br />
Ripe (R) Eggs were irregular in shape and loosely connected to one ano<strong>the</strong>r. They<br />
were bright orange in colour.<br />
Spent (S) Ovaries were thin and opaque wall. Red eggs dominated with few bright<br />
orange eggs.<br />
Description <strong>of</strong> male gonadal stages<br />
Immature (I) Testes were translucent and almost colourless.<br />
Ripe (R) Testes were opaque and creamy.<br />
Spent (S) Testes were thin, flaccid and irregular.<br />
To determine <strong>the</strong> absolute fecundity <strong>of</strong> each species <strong>the</strong> ripe ovaries for each fish were separately preserved in<br />
Gilson's solution. After keeping <strong>the</strong> ovaries in Gilson's solution for one week, <strong>the</strong> number <strong>of</strong> eggs were counted<br />
(Bagenal 1978). The length-fecundity relationship was determined by regression analysis. The best regression fit<br />
was given by <strong>the</strong> linear equation:<br />
F = b L + a<br />
where F is <strong>the</strong> absolute number <strong>of</strong> eggs counted per individual, L is <strong>the</strong> total length <strong>of</strong> fish and a, b are linear<br />
equation constants. Relative fecundity (number <strong>of</strong> eggs per gram fish weight) was used to compare reproductive<br />
strategies <strong>of</strong> <strong>the</strong> three species.<br />
Sex ratio for each species was evaluated by recording <strong>the</strong> number <strong>of</strong> fish sampled by sex. The numbers <strong>of</strong> males and<br />
females were compared using a Chi-square test to determine whe<strong>the</strong>r sex ratio differed significantly from unity. This<br />
test was done to evaluate if size-selective fishing, which has been aggravated by use <strong>of</strong> small meshed nets, might<br />
have altered <strong>the</strong> sex ratios <strong>of</strong> <strong>the</strong> three species.<br />
Results<br />
Reproductive seasonality<br />
For all three species, a high frequency <strong>of</strong> potential breeding females (AR and R) was evident between July and<br />
October, with prominent peaks in July and October for active ripe female and in August for ripe females. A high<br />
frequency <strong>of</strong> potential breeding ripe females was also noted for O. argyrosoma ‘red’ in December (Figure 2). From<br />
<strong>the</strong>se data it is evident that all three species breed mainly from July to August.<br />
Sexual maturity<br />
Gonads <strong>of</strong> 991 males and 979 females were examined. More than 50 % <strong>of</strong> <strong>the</strong> males, irrespective <strong>of</strong> species and side<br />
<strong>of</strong> <strong>the</strong> <strong>lake</strong>, were mature at approximately <strong>the</strong> same size (79 mm), thus corresponding to an age <strong>of</strong> between two and<br />
three years. However, <strong>the</strong>y appear to attain 100% sexual maturity at different lengths (TL). In contrast, females <strong>of</strong><br />
<strong>the</strong> three species attained 50% sexual maturity at different lengths (Table 2)
108<br />
Lake Malawi Fisheries Management Symposium - Proceedings<br />
Table 2. Comparison <strong>of</strong> length at 50% sexual maturity (Lsm) in millimetres and length-at-age 1 (L-at-1) in<br />
millimetres for both sexes <strong>of</strong> <strong>the</strong> three species studied in <strong>the</strong> sou<strong>the</strong>rn Lake Malombe<br />
Species Male<br />
Female<br />
Lsm L-at-1 Lsm L-at-1<br />
L. ‘pinkhead’ 79 67 66 86<br />
O. argyrosoma ‘red’ 77 69 72 89<br />
C. cf. virginalis 79 32 83 45<br />
% Frequency<br />
% Frequency<br />
50<br />
40<br />
30<br />
20<br />
10<br />
0<br />
70<br />
60<br />
50<br />
40<br />
30<br />
20<br />
10<br />
0<br />
L. ' pinkhead' ( n=297)<br />
Active ripe Ripe<br />
Jun Jul Aug Sep Oct Nov Dec Apr May Jun<br />
Months<br />
C. cf. virginalis (n=189)<br />
Active ripe Ripe<br />
Jun Jul Aug Sep Oct Nov Dec Apr May Jun<br />
Months<br />
% Frequency<br />
70<br />
60<br />
50<br />
40<br />
30<br />
20<br />
10<br />
0<br />
O. argyrosoma ' red' (n=389)<br />
Active ripe Ripe<br />
Jun Jul Aug Sep Oct Nov Dec Apr May Jun<br />
Months<br />
Figure 2. Frequency distribution <strong>of</strong> female fish with active ripe (AR) and ripe (R) gonads.<br />
Size distribution and Sex ratio<br />
The frequency occurrence <strong>of</strong> smaller mature females was greater in <strong>the</strong> south eastern side than in <strong>the</strong> south western<br />
side. Females <strong>of</strong> L. ‘pinkhead’ and O. argyrosoma ‘red’ dominated in <strong>the</strong> smaller size classes (66-75 mm) while<br />
females <strong>of</strong> C. cf. virginalis dominated in <strong>the</strong> larger size classes (78-90 mm) (Figure 3 a,b and c).<br />
These results suggest that more <strong>of</strong> <strong>the</strong> immature females in <strong>the</strong> L. ‘pinkhead’ and O. argyrosoma ‘red’ populations<br />
were vulnerable to <strong>the</strong> standard nkacha net. However, <strong>the</strong>re was no significant difference in size between sexes and<br />
sides (ANOVA) P>0.05 (Table 3). Similarly, <strong>the</strong> sex ratio <strong>of</strong> <strong>the</strong> three species did not differ significantly from 1:1,<br />
X² test; P > 0.05 (Table 4).
109<br />
Lake Malawi Fisheries Management Symposium - Proceedings<br />
Table 3. Mean lengths (mm) <strong>of</strong> potential breeding males and females in <strong>the</strong> south western (SW) side and<br />
south eastern (SE) side <strong>of</strong> Lake Malombe.<br />
Species SW<br />
(Heavily fished)<br />
L. ‘pinkhead’ 78<br />
67<br />
O. argyrosoma’red’ 71<br />
72<br />
C. cf. virginalis 79<br />
SE<br />
(Lightly fished)<br />
78<br />
67<br />
76<br />
71<br />
80<br />
83 83<br />
Table 4. Sex ratio <strong>of</strong> <strong>the</strong> three species sampled from sou<strong>the</strong>rn Lake Malombe, irrespective <strong>of</strong> <strong>the</strong> sides.<br />
Species Male Female Ratio x²<br />
L. ‘pinkhead’ 1450 1441 1:1.03 0.017<br />
O. argyrosoma ‘red’ 801 1014 1:1.23 0.001<br />
C. cf. virginalis 749 802 1:1.07 0.790<br />
Discussion<br />
Breeding seasonality<br />
It appears that all three species breed throughout <strong>the</strong> year with one or two distinct peaks occurring from July to<br />
October for L. ‘pinkhead’ and C. cf. virginalis and in September and December for O. argyrosoma ‘red’. In general,<br />
<strong>the</strong>se results confirm <strong>the</strong> findings <strong>of</strong> Tweddle & Turner (1977), Mwanyama (1993) and Banda et al. (1994) who<br />
found that <strong>the</strong> main breeding season for most Malawian cichlids falls between August and September. The high<br />
frequency occurrence <strong>of</strong> potential breeding fish, throughout <strong>the</strong> year, provides fur<strong>the</strong>r evidence that <strong>the</strong> three species<br />
breed throughout <strong>the</strong> year and this makes <strong>the</strong> application <strong>of</strong> a closed season problematic. Never<strong>the</strong>less, high<br />
frequency <strong>of</strong> spent ovaries and juveniles after November suggests that a fine-tuned closed season would cover <strong>the</strong><br />
month <strong>of</strong> November so that juveniles could be protected.<br />
The breeding peaks <strong>of</strong> <strong>the</strong> three species occurred during <strong>the</strong> phytoplankton biomass peaks. This could be a strategy,<br />
which synchronises <strong>the</strong> breeding behaviour with availability <strong>of</strong> food. Eccles (1974), Lowe-McConnell (1987) and<br />
Mwanyama (1993) have indicated that more nutrients are available during <strong>the</strong> period June to September from<br />
sediments pertubated by <strong>the</strong> south easterly winds and between February and March during <strong>the</strong> rainy season. These<br />
findings provide some evidence that <strong>the</strong> synchrony in breeding <strong>of</strong> <strong>the</strong> three species may reflect a direct response to<br />
food availability. Similar relationships have also been found for cichlid species elsewhere (McKaye 1984 and Marsh<br />
et al. 1986). It was also apparent that <strong>the</strong> main breeding season <strong>of</strong> <strong>the</strong> three species occurred during <strong>the</strong> time when<br />
CPUE was also highest, indicating that <strong>the</strong> three species are more vulnerable to fishing during <strong>the</strong>ir breeding season.<br />
From a fishery perspective, <strong>the</strong> coincidence <strong>of</strong> greater CPUE and breeding season during <strong>the</strong> open season, suggested<br />
that <strong>the</strong> closed season (1January-31 March) was ineffective in protecting breeding stocks.
(a) L. ‘pinkhead’<br />
% Frequency<br />
(b) O. argyrosoma ‘red’<br />
% Frequency<br />
12<br />
10<br />
8<br />
6<br />
4<br />
2<br />
0<br />
15<br />
10<br />
5<br />
0<br />
(c) C. virginalis<br />
% Frequency<br />
South western side<br />
Male<br />
Female<br />
55 6 65 69 73 77 8 85 89 93 98<br />
Total length (mm)<br />
15<br />
10<br />
5<br />
0<br />
South western side<br />
South western side<br />
Male<br />
Female<br />
55 62 66 70 74 78 82 86 90 94 99<br />
Total length (mm)<br />
Male<br />
Female<br />
65 69 73 77 81 85 89 93 97 103<br />
Total length (mm)<br />
110<br />
Lake Malawi Fisheries Management Symposium - Proceedings<br />
South eastern side<br />
Figure 3 a, b and c Length frequency distribution <strong>of</strong> mature fish <strong>of</strong> three principal species in <strong>the</strong> sou<strong>the</strong>rn<br />
Lake Malombe.<br />
% Frequency<br />
% Frequency<br />
15<br />
10<br />
5<br />
0<br />
12<br />
10<br />
8<br />
6<br />
4<br />
2<br />
0<br />
% Frequency<br />
10<br />
8<br />
6<br />
4<br />
2<br />
0<br />
South eastern side<br />
Male<br />
Female<br />
58 63 67 71 75 79 83 87 91 100<br />
Total length (mm)<br />
Male<br />
Female<br />
33 60 64 68 72 76 80 84 88 92105<br />
Total length (mm)<br />
South eastern side<br />
Male<br />
Female<br />
30 62 66 70 74 78 82 86 90 94 100111123<br />
Total length (mm)
111<br />
Lake Malawi Fisheries Management Symposium - Proceedings<br />
The spawning period <strong>of</strong> O. argyrosoma ‘red’ coincided with <strong>the</strong> onset <strong>of</strong> <strong>the</strong> rainy season in December. This species<br />
belongs to a group <strong>of</strong> small zoobenthic feeders, substrate spawners and it is most abundant in <strong>the</strong> shallower parts <strong>of</strong><br />
<strong>the</strong> <strong>lake</strong> (Eccles & Trewavas 1989). During <strong>the</strong> rainy season <strong>the</strong> preferred habitats for O. argyrosoma ‘red’ had high<br />
turbidity values. Considering <strong>the</strong> fact that high turbidity does not prohibit breeding <strong>of</strong> some haplochromines<br />
(Greenwood 1974), it appears that breeding <strong>of</strong> O. argyrosoma ‘red’ coincides with high water turbidity.<br />
Sexual maturity<br />
Analysis <strong>of</strong> <strong>the</strong> data, using non-pooled data, showed that <strong>the</strong> sizes at 50% maturity <strong>of</strong> female fish, from both sides <strong>of</strong><br />
<strong>the</strong> <strong>lake</strong>, were not significantly different. Results for <strong>the</strong> three species have shown that <strong>the</strong> females mature<br />
approximately six months to one year before <strong>the</strong> males. The early maturing <strong>of</strong> females is considered to be<br />
advantageous to <strong>the</strong> reproductive potential <strong>of</strong> <strong>the</strong> three species because females could breed at least once before <strong>the</strong>y<br />
are exploited in <strong>the</strong>ir second year <strong>of</strong> life.<br />
Cichlid females maturing at a small size could also mean a reduction in absolute population fecundity (Fryer & Iles<br />
1972, Pitcher & Hart 1982) resulting in insufficient recruitment levels from such small and early maturing females.<br />
However, some scholars have argued that while mouth brooding cichlids may mature at a small size and lay few<br />
eggs, recruitment is guaranteed due to <strong>the</strong> fact that <strong>the</strong> young are painstakingly cared for by <strong>the</strong> parent. This implies<br />
that although females <strong>of</strong> <strong>the</strong> three species are maturing early, at a small size, <strong>the</strong>y may still have a good recruitment<br />
potential, which may however need to be conserved by protecting <strong>the</strong> breeding grounds.<br />
Studies on sexual maturity <strong>of</strong> related species such as Haplochromis virginalis (107 mm), H. quadrimaculatus<br />
(164 mm) and H. pleurostigmoids (130 mm) have shown that <strong>the</strong>y all matured during <strong>the</strong>ir third year (Fryer & Iles<br />
1972). Tweddle & Turner (1977) who investigated <strong>the</strong> sexual maturity <strong>of</strong> Lethrinops. parvidens , L. longipinnis,<br />
and H. anaphyrmus (closely related to <strong>the</strong> species studied here) also postulated that <strong>the</strong>y breed in <strong>the</strong>ir third year.<br />
According to Fryer & Iles (1972), reduction in size at 50% maturity in all female individuals might have been a<br />
direct adaptation to heavy fishing. It appears that <strong>the</strong> reduction in size at sexual maturity for C. cf. virginalis has<br />
been compensated by a faster growth rate (Jambo 1997). Pitcher & Hart (1982) and Gulland (1988) pointed out that<br />
a smaller size at sexual maturity coupled with an increasing growth rate <strong>of</strong>fers <strong>the</strong> potential for compensatory<br />
adjustment to <strong>of</strong>fset declining spawner stock size. This phenomenon could probably explain why <strong>the</strong>se three species<br />
have been resilient to heavy exploitation and give an impression that <strong>the</strong> fishery could be restored if <strong>the</strong>re is a<br />
substantial curtailment <strong>of</strong> fishing and proper <strong>management</strong>.<br />
Sex ratio<br />
For all three species <strong>the</strong> overall sex ratio was approximately 1:1 at 95% confidence interval. This suggests that <strong>the</strong>re<br />
was an equal removal <strong>of</strong> both sexes by <strong>the</strong> standard fishing gear in sou<strong>the</strong>rn Lake Malombe. However, it was<br />
apparent that for all three species, males slightly outnumbered females two months prior to <strong>the</strong> breeding season. This<br />
may be a reproductive strategy that could increase <strong>the</strong> reproductive success <strong>of</strong> <strong>the</strong> females through <strong>the</strong> exercise <strong>of</strong><br />
mate choice. Lande (1981) quoted by McKaye (1986) and Turner (1993) emphasised that such preponderance <strong>of</strong><br />
males satisfies <strong>the</strong> polygynandry <strong>of</strong> mouth brooding cichlids, whereby females have numerous males from which to<br />
choose and apportion <strong>the</strong>ir eggs and hence achieve greater mating success. Ano<strong>the</strong>r explanation could be that males,<br />
as in Tilapia moori (Konings 1988), move about in groups prior to and during <strong>the</strong> spawning period whilst females<br />
are solitary in less accessible breeding grounds. Such a breeding behaviour could contribute to males dominating <strong>the</strong><br />
catches during and/or prior to <strong>the</strong> breeding season.<br />
Fecundity<br />
In this study, <strong>the</strong> linear function best described <strong>the</strong> significant relationship between absolute fecundity and length.<br />
However, <strong>the</strong> relationships for L. ‘pinkhead’ and O. argyrosoma ‘red’ were poorer in <strong>the</strong> south western side than in<br />
<strong>the</strong> south eastern side <strong>of</strong> <strong>the</strong> <strong>lake</strong>. The possible explanation for such a poor length-fecundity relationship in <strong>the</strong> south<br />
western side could be that <strong>the</strong> high fishing intensity has influenced a shift in <strong>the</strong> size distribution <strong>of</strong> <strong>the</strong>se species<br />
resulting in <strong>the</strong> impairment <strong>of</strong> reproductive output (Sadovy 1996).<br />
This study indicates that relative fecundity indicate is variable among <strong>the</strong> three species and between <strong>the</strong> sides <strong>of</strong> <strong>the</strong><br />
<strong>lake</strong>. Considering <strong>the</strong> fact that mean weights for each species, in both sides <strong>of</strong> <strong>the</strong> <strong>lake</strong> were not significantly<br />
different (t-test, P>0.05), it appears that <strong>the</strong> higher values <strong>of</strong> relative fecundity for C. cf. virginalis, in <strong>the</strong> south<br />
western side, might have been a reproductive adaptation to high fishing pressure. Pitcher & Hart (1982) and Sadovy<br />
(1996) pointed out that changes in reproductive strategy are expected to involve increases in relative fecundity at a
112<br />
Lake Malawi Fisheries Management Symposium - Proceedings<br />
given size and age when fish populations are subjected to high fishing pressure. The lower value <strong>of</strong> relative<br />
fecundity <strong>of</strong> O. argyrosoma ‘red’, in <strong>the</strong> south western side, could be an indication <strong>of</strong> poor habitat breeding<br />
conditions for this species in <strong>the</strong> south western side. It could be envisaged that <strong>the</strong> sandy substratum <strong>of</strong> <strong>the</strong> south<br />
western side <strong>of</strong> <strong>the</strong> <strong>lake</strong> may have contributed to <strong>the</strong> low values <strong>of</strong> relative fecundity <strong>of</strong> O. argyrosoma ‘red’ while<br />
<strong>the</strong> muddy substratum <strong>of</strong> <strong>the</strong> south eastern side <strong>of</strong> <strong>the</strong> <strong>lake</strong> may have contributed to <strong>the</strong> better habitat conditions for<br />
reproductive success <strong>of</strong> O. argyrosoma ‘red’.<br />
In overall, absolute fecundity estimates from this investigation showed general agreement with estimates by<br />
Mwanyama's (1993). Mwanyama (1993) documented a range <strong>of</strong> 13 to 78 eggs. The slight difference might have<br />
originated from sampling, differences in population structure in both sides and period <strong>of</strong> sampling. Comparisons <strong>of</strong><br />
absolute fecundity values <strong>of</strong> each species with respect to sides <strong>of</strong> <strong>the</strong> <strong>lake</strong> showed that L. ‘pinkhead’ and C. cf.<br />
virginalis had <strong>the</strong> highest mean values <strong>of</strong> absolute fecundities (28 and 51 eggs respectively) in both sides <strong>of</strong> <strong>the</strong> <strong>lake</strong>,<br />
where as for O. argyrosoma ‘red’ <strong>the</strong> highest mean value was observed in <strong>the</strong> south eastern side <strong>of</strong> <strong>the</strong> <strong>lake</strong>. These<br />
results provide circumstantial evidence that absolute fecundity <strong>of</strong> L. ‘pinkhead’ and C. cf. virginalis have not been<br />
affected much by high fishing intensity.<br />
Conclusions and recommendations<br />
The three dominant species breed throughout <strong>the</strong> year with distinct peaks occurring between July and October. From<br />
a fishery perspective, <strong>the</strong> high frequency occurrence <strong>of</strong> breeding females during July - October period suggested that<br />
<strong>the</strong> old closed season (January- March) was ineffective in protecting breeding females. As such, a new closed season<br />
for Lake Malombe (October- December) was adopted. It was also evident that <strong>the</strong> breeding peaks coincided with<br />
phytoplankton biomass peaks, suggesting that intraspecific competition for food between adults and juveniles is<br />
reduced during <strong>the</strong> period <strong>of</strong> greater fish abundance.<br />
Of <strong>the</strong> three species, females <strong>of</strong> L. ‘pinkhead’ and O. argyrosoma ‘red’ mature earlier than males irrespective <strong>of</strong> side<br />
<strong>of</strong> <strong>the</strong> <strong>lake</strong> while males <strong>of</strong> <strong>the</strong> three species attain sexual maturity at approximately <strong>the</strong> same size (79 mm). The<br />
relative small size at sexual maturity is <strong>of</strong> an advantage for <strong>the</strong> population because females are given a chance to<br />
spawn at least once before <strong>the</strong>y are caught. However, benefits <strong>of</strong> early maturation are limited in Lake Malombe due<br />
to <strong>the</strong> current high fishing pressure. According to Jennings & Beverton (1991), a reduction in size at 50% sexual<br />
maturity for females could be a direct consequence <strong>of</strong> overfishing or response to physical and biological<br />
characteristics <strong>of</strong> <strong>the</strong> environment. These views suggest that in overall, degradation <strong>of</strong> substratum and high fishing<br />
intensity may have caused a reduction in size at sexual maturity <strong>of</strong> L. ’pinkhead’ and O. argyrosoma ‘red’ in Lake<br />
Malombe.<br />
In conclusion, <strong>the</strong> south eastern side <strong>of</strong> <strong>the</strong> <strong>lake</strong> is characterised by low fishing intensity, muddy substratum and<br />
aquatic macrophytes. These factors appear to have been associated with greater abundance <strong>of</strong> breeding females and<br />
higher frequency <strong>of</strong> juveniles ra<strong>the</strong>r than fecundity and sex ratios. Considering <strong>the</strong>se results, it could be suggested<br />
that <strong>the</strong> existing sanctuary area, situated in <strong>the</strong> sou<strong>the</strong>rn part <strong>of</strong> Lake Malombe, should be extended. It is appreciated<br />
that <strong>the</strong> optimum size <strong>of</strong> <strong>the</strong> sanctuary has to be scientifically established. However, given <strong>the</strong> seriousness <strong>of</strong> <strong>the</strong><br />
situation, it is recommended that <strong>the</strong> sanctuary area boundary be increased immediately but in consultation with <strong>the</strong><br />
fishers. It is anticipated that enlarged and well managed sanctuary area will protect <strong>the</strong> unique aquatic environment<br />
in <strong>the</strong> south eastern side (which tends to be <strong>the</strong> breeding ground), <strong>the</strong> breeding fish stocks, and juveniles, hence<br />
prevent <strong>the</strong> total collapse <strong>of</strong> <strong>the</strong> fishery.<br />
Acknowledgements<br />
Special thanks are due to Mr O.K. Mhone and A. Phiri for <strong>the</strong>ir assistance in identifying fish species, weighing and<br />
measuring fish, and counting eggs. We sincerely thank Dr. Tony Booth and Mr. Dennis Tweddle who<br />
enthusiastically provided statistical advice and supervised data processing. Overseas Development Agency (ODA)<br />
funded this study.
113<br />
Lake Malawi Fisheries Management Symposium - Proceedings<br />
References<br />
Bagenal, T.B. 1978. Methods for assessment <strong>of</strong> fish production in freshwaters, IBP Handbook 3. Blackwell Scientific<br />
Publications Ltd., Oxford.<br />
Banda, M.C., Tomasson, T. & Tweddle, D. 1994. Assessment <strong>of</strong> trawl <strong>fisheries</strong> <strong>of</strong> <strong>the</strong> south east arm <strong>of</strong> Lake Malawi using<br />
exploratory surveys and commercial catch data. Conference on Inland Fisheries Stock Assessment, Hull England, April<br />
1994.<br />
Coulter, G.W. 1993. Report on Fisheries Research Strategies. The Government <strong>of</strong> Malawi Fisheries Department. ODA-FRAMS<br />
pp 58.<br />
Eccles, D.H. 1974. An outline <strong>of</strong> <strong>the</strong> physical limnology <strong>of</strong> Lake Malawi (Lake Nyasa). Limnol. Oceanogr., 19:730-742.<br />
Eccles, D.H. & Trewavas, E. 1989. Malawian cichlid fishes. The classification <strong>of</strong> some Haplochromine genera. Herten (W.<br />
Germany), Lake Fish movies.<br />
FAO. 1992. Fisheries Management in <strong>the</strong> South East Arm <strong>of</strong> Lake Malawi, <strong>the</strong> Upper Shire and Lake Malombe. CIFA Technical<br />
paper, Vol. 21 GOM/FAO/UNDP Chambo Fisheries Research Project.<br />
Fryer, G. & Iles, T.D. 1972. The Cichlid Fishes <strong>of</strong> <strong>the</strong> Great Lakes <strong>of</strong> Africa: Their Biology and Evolution, Oliver and Boyd.<br />
Edinburgh.<br />
Greenwood, H. 1974. Cichlid fishes <strong>of</strong> Lake Victoria, East Africa: <strong>the</strong> biology and evolution <strong>of</strong> a species flock. Bull. Br. Mus.<br />
nat. Hist. (Zool.), suppl., 6:1-134.<br />
Gulland, J.A. 1988. Fish Population Dynamics: The implication for <strong>management</strong>. Wiley, London.<br />
Jambo, C. 1997.<br />
King, M. 1995. Fisheries Biology, Assessment And Management. Fishing News Books. Pp341.<br />
Konings, A. 1988. Cichlids Of Lake Malawi. Tfh Publications. Neptune City. 495 Pp.<br />
Lande. 1981.<br />
Lowe-Mcconnell, R.H. 1987. Ecological Studies In Tropical Communities. Cambridge Uni. Press, Cambridge, 382 Pp.<br />
Marsh, B., Marsh, A.C. & Ribbink, A.J. 1986. Reproductive seasonality in a group <strong>of</strong> rock-frequenting cichlid fishes in Lake<br />
Malawi. J. Zool., London (A) 209:9-20.<br />
Mckaye, K.R. 1984. Behavioural aspects <strong>of</strong> cichlid reproductive strategies: patterns <strong>of</strong> territoriality and brood defence in Central<br />
American substratum spawners and African mouthbrooders. In: Fish Reproduction, (eds G.W. Potts and R.J. Wooten).<br />
Academic Press, London. pp245-273<br />
Mckaye, K.R. 1986. Mate choice and size assortative pairing by cichlid fishes <strong>of</strong> Lake Jilo'a, Nicaragua. J. Fish. Biol., 29<br />
(Supp.A), 135-50).<br />
Mwanyama, N.C. 1993. Relations entre les ressources alimentaires, I'alimentation et la reproduction des chambos (poissons<br />
tilapia's di genre Oreochromis dans les lacs Malawi et Malombe (Afrique centrale) Ph.D. <strong>the</strong>sis, Universite' de<br />
Provence-Axix-Marseille, 158p.<br />
Pitcher, T.J.& Hart, P.J.B. 1982. Fisheries Ecology, Croom Helm, Beckenham, 414 pp.<br />
Ribbink, A.J., Marsh, B.A., Marsh, A.C., Ribbink, A.C. & Sharp, B.J. 1983. A preliminary survey <strong>of</strong> <strong>the</strong> cichlid fishes <strong>of</strong> rocky<br />
habitats in Lake Malawi. S. Afr. J. Zool., 18:149-310.<br />
Sadovy, Y.J. 1996. Reproduction <strong>of</strong> reef fishery species. In: Reef Fisheries (eds N.V.C. Polunin and C.M. Roberts). Chapman &<br />
Hall.<br />
Turner, G.F. 1993. Teleost mating behaviour. In: Behaviour <strong>of</strong> Teleost Fishes (ed. T.J. Pitcher). Chapman & Hall, London.<br />
pp.307-331.<br />
Tweddle, D.& Turner, J.L. 1977. Age, growth and mortality rates <strong>of</strong> some cichlid fishes <strong>of</strong> Lake Malawi. J. Fish. Biol., 10:385-<br />
398.<br />
Tweddle, D., Turner, G.F. & Saisay, M.B.D. 1995. Changes in species composition and abundance as a consequence <strong>of</strong> fishing in<br />
Lake Malombe, Malawi. In: The Impact <strong>of</strong> Changes in African Lakes (eds. T.J. Pitcher and P.J.B. Hart). Chapman &<br />
Hall. London, pp413-424.
114<br />
Lake Malawi Fisheries Management Symposium - Proceedings<br />
Management Recommendations for <strong>the</strong> Nkacha Net Fishery <strong>of</strong> Lake Malombe<br />
Kissa R. Mwakiyongo 1 & Olaf L.F. Weyl 2<br />
1 Fisheries Research Unit, P.O. Box 27, Monkey Bay, Malawi, e-mail: fru@<strong>malawi</strong>.net<br />
2 National Aquatic Resource Management Programme, P.O. Box 27, Monkey Bay, Malawi, e-mail: narmapbay@<strong>malawi</strong>.net<br />
Abstract<br />
Fish catches from <strong>the</strong> nkacha net fishery on Lake Malombe were sampled on a monthly basis from March 2000 to January 2001.<br />
Although more than 60 species were identified, <strong>the</strong> catch composition was dominated (about 80%) by only five species. These were<br />
Copadichromis chrysonotus, C. virginalis, Lethrinops sp. ‘pinkhead’, Otopharynx argyrosoma and O. tetrastigma. This species<br />
composition was similar to that recorded in previous assessments and indicated a relative stability in <strong>the</strong> species that drive <strong>the</strong><br />
nkacha net fishery. This paper investigates size selectivity for ¼ inch and ¾ inch mesh size nkacha nets from a yield per recruit<br />
(YPR) perspective for three <strong>of</strong> <strong>the</strong> five species: C. virginalis, L. sp. ‘pinkhead’ and O. argyrosoma. Management recommendations<br />
for <strong>the</strong> Lake Malombe nkacha net fishery are made using two target reference points (TRPs), F0.1 and Fmax, derived from <strong>the</strong> YPR<br />
models.<br />
Introduction<br />
The Lake Malombe fishery has undergone dramatic changes both in gear use and in catch composition (Weyl et al.<br />
2001). Chambo seines and gill nets dominated <strong>the</strong> fishery up to <strong>the</strong> mid 1980s when chambo (Oreochromis spp.)<br />
was <strong>the</strong> mainstay <strong>of</strong> <strong>the</strong> fishery. With <strong>the</strong> collapse <strong>of</strong> <strong>the</strong> chambo fishery in Lake Malombe, kambuzi seines and<br />
nkacha nets became increasingly important and currently over 90 % <strong>of</strong> total fish catch is from nkacha nets (Weyl et<br />
al. 2001). However, even this fishery is considered to be declining in Lake Malombe with catches fluctuating<br />
between 2000 and 4000 tones from 1995 to 1999 and over <strong>the</strong> same period <strong>the</strong> number <strong>of</strong> kambuzi seines, chambo<br />
seines and nkacha nets have also declined (Weyl et al. 2000). The latest count (Weyl et al. 2000) shows 165 nkacha<br />
nets being operated in Lake Malombe and <strong>the</strong> Upper Shire River.<br />
Although <strong>the</strong> legal minimum mesh size for nkacha nets is ¾ inch (GOM 2000), <strong>the</strong> mesh size in most common use<br />
in nkacha nets is ¼ inch (pers obs.). This study investigates <strong>the</strong> species composition in nkacha net catches to<br />
determine whe<strong>the</strong>r <strong>the</strong>re have been major species composition changes over <strong>the</strong> last eight years and investigates <strong>the</strong><br />
effect <strong>of</strong> <strong>the</strong> dominance <strong>of</strong> <strong>the</strong> ¼-inch mesh size on <strong>the</strong> fishery.<br />
Methods<br />
Fish catches from <strong>the</strong> nkacha net fishery on Lake Malombe (14 o 29’–14 o 45’S, 35 o 12’–35 o 20’E), Malawi, were<br />
sampled (n=107) from ¼ inch and ¾ inch mesh size nkacha nets on a monthly basis from March 2000 to January<br />
2001. No sampling was carried out between 1 October and 31 December, 2000, as this period is closed to nkacha net<br />
fishing in Lake Malombe. In most cases <strong>the</strong> landed catch was sub-sampled and all fish in <strong>the</strong> sample were identified<br />
to species level, each species component <strong>of</strong> <strong>the</strong> catch was weighed and each fish was measured for total length (TL)<br />
in millimeters. Since, age and growth data were available for only three species in <strong>the</strong> <strong>lake</strong> Malombe fishery,<br />
Copadichromis virginalis, Lethrinops sp. ‘pinkhead’, and Otopharynx argyrosoma, fur<strong>the</strong>r analysis was restricted to<br />
<strong>the</strong>se species.<br />
Age specific selectivity<br />
Length-specific selectivity was estimated using cumulative length frequency distributions for Copadichromis<br />
virginalis, Lethrinops sp. ‘pinkhead’, and Otopharynx argyrosoma in <strong>the</strong> nkacha net fishery. For age-specific<br />
selectivity, length frequencies were converted to age-frequencies using <strong>the</strong> von Bertalanffy growth parameters<br />
determined by Jambo (1997). Both age- and length-specific selectivity was described by a logistic distribution as<br />
selectivity was assumed to increases to, and remain at, a maximum. The selectivity pattern <strong>of</strong> <strong>the</strong> nkacha net fishery<br />
was <strong>the</strong>refore assumed to be temportally invariant and described by <strong>the</strong> logistic function:<br />
S<br />
a<br />
=<br />
( ) 1<br />
−(<br />
a−φ<br />
) / σ −<br />
1+<br />
e<br />
where Sa is <strong>the</strong> selection <strong>of</strong> <strong>the</strong> gear on fish <strong>of</strong> age or length a, φ is <strong>the</strong> age- or length-at-50% selection and σ <strong>the</strong><br />
width <strong>of</strong> <strong>the</strong> selectivity function.
Per-Recruit analysis<br />
Yield-per-recruit (YPR) as a function <strong>of</strong> fishing mortality (F) were determined by:<br />
where N a<br />
~ is <strong>the</strong> relative proportion <strong>of</strong> fish at age a is defined recursively as:<br />
~<br />
N<br />
a<br />
⎧1<br />
⎪ ~<br />
= ⎨N<br />
⎪ ~<br />
⎩N<br />
a−1<br />
115<br />
Lake Malawi Fisheries Management Symposium - Proceedings<br />
where Sa is selectivity at age a, F is <strong>the</strong> instantaneous rate <strong>of</strong> fishing mortality on fully recruited cohorts, M is <strong>the</strong><br />
instantaneous rate <strong>of</strong> natural mortality and max is <strong>the</strong> maximum recorded age. In all per-recruit models <strong>the</strong> weightat-age<br />
was described by:<br />
Wa= α( la ) β<br />
e<br />
max−1<br />
−(<br />
M + S<br />
e<br />
a −1<br />
−(<br />
M + S<br />
F )<br />
max −1<br />
−(<br />
M + Sa<br />
F )<br />
[ 1 − e ] ( M + S F ) ∆a<br />
max<br />
~<br />
YPRF = wa<br />
S a FN<br />
a<br />
a<br />
∑<br />
a=<br />
0<br />
F )<br />
( 1 − e<br />
−(<br />
M + S<br />
max −1<br />
F )<br />
if a = 0<br />
if 1 ≤ a < max<br />
if a = max<br />
where la is <strong>the</strong> length-at-age determined by <strong>the</strong> von Bertalanffy growth equation and α and β are parameters<br />
∆ a <strong>of</strong> 1/12 th <strong>of</strong> a year.<br />
describing <strong>the</strong> length-weight relationship. All summations were conducted with a step size ( )<br />
)<br />
Input parameters used in YPR models for <strong>the</strong> three species in <strong>the</strong> Lake Malombe nkacha fishery are summarised in<br />
Table 1. Growth and mortality parameters were obtained from data presented in Jambo (1997), mortality estimates<br />
were derived from Weyl 2001, and all summations were run using 5 years to define <strong>the</strong> parameter for maximum age<br />
(max). Gear specific fishing effort was standardised to <strong>the</strong> effort exerted by one nkacha unit per year.<br />
Table 1. Input parameters used in per-recruit analysis for three species in <strong>the</strong> Lake Malombe nkacha<br />
fishery.<br />
Parameters C. virginalis L. pinkhead O. argyrosoma<br />
L ∞ Predicted asymptotic length<br />
146mm 118.4 101.7<br />
K Brody growth coefficient<br />
0.88 0.6 0.52<br />
Max Maximum age 5 5 5<br />
M Natural mortality rate 0.97 yr -1 0.62 yr -1 0.55 yr -1<br />
F Fishing mortality rate 1.59 yr -1 0.81 yr -1 0.71 yr -1<br />
Q Catchability coefficient 0.0096 0.0049 gear -1 .yr -1 0.0044 gear -1 .yr -1<br />
α Parameter for length/weight equation<br />
0.044687 0.02138 0.041687<br />
β<br />
,,<br />
2.33 2.7 2.33<br />
a50: ¼ Age-at-50%-selectivity<br />
0.706131 1.302769 1.891944<br />
bδ50: ¼ Width <strong>of</strong> <strong>the</strong> selectivity logistic ogive<br />
0.091881 0.241381 0.349569<br />
A50: ¾ Age-at-50%-selectivity<br />
0.68007 1.426617 2.054715<br />
δ50: ¾ inch Width <strong>of</strong> <strong>the</strong> selectivity logistic ogive<br />
0.086659 0.250679 0.345974
116<br />
Lake Malawi Fisheries Management Symposium - Proceedings<br />
Target Reference Points<br />
In order to determine target reference point (TRP) fishing mortality for <strong>the</strong> ¼ inch and ¾ inch mesh sizes, two<br />
TRP’s were investigated:<br />
1) F0.1 or marginal yield strategy which corresponds to <strong>the</strong> rate <strong>of</strong> fishing mortality at which <strong>the</strong> slope <strong>of</strong> <strong>the</strong><br />
YPR curve falls to 10% <strong>of</strong> its value at <strong>the</strong> origin.<br />
2) Fmax which corresponds with <strong>the</strong> asymptote <strong>of</strong> <strong>the</strong> YPR curve.<br />
Results<br />
Species selectivity<br />
Over sixty species <strong>of</strong> fish were identified in <strong>the</strong> nkacha net fishery, however only five dominated <strong>the</strong> catch. These<br />
were Copadichromis chrysonotus, C. virginalis, L. sp. ‘pinkhead’, O. argyrosoma and O. tetrastigma, each one <strong>of</strong><br />
which made up >5% <strong>of</strong> <strong>the</strong> catch (Table 2). The monthly trends in catch composition for <strong>the</strong> period March 2000 –<br />
January 2001 indicated that <strong>the</strong> five most dominant species toge<strong>the</strong>r made up between about 60% and 90% <strong>of</strong> <strong>the</strong><br />
total nkacha net catch (Figure 1).<br />
100<br />
90<br />
80<br />
70<br />
60<br />
50<br />
40<br />
30<br />
20<br />
10<br />
0<br />
Relative abundance (%) O. tetrastigma O. argyrosoma L. sp. "pinkhead" C. virginalis C. chrysonotus O<strong>the</strong>rs<br />
Mar '00 Apr '00 May '00 Jun '00 Jul '00 Aug '00 Sep '00 Jan '01<br />
Month<br />
Figure 1. Monthly trends in catch composition (%) from March 2000 to January 2001.<br />
Size selectivity<br />
Size selectivity comparisons between ¼ inch and ¾ inch nkacha net mesh sizes for C. virginalis, L. sp. ‘pinkhead’<br />
and O. argyrosoma are shown in Figs. 2, 3 and 4, respectively. For C. virginalis, <strong>the</strong> mean selectivity for ¼ inch<br />
mesh size was 67 mm versus 66 mm for <strong>the</strong> ¾ inch mesh size (Figure 2). For L. sp. ‘pinkhead’ <strong>the</strong> mean<br />
selectivities for ¼ inch and ¾ inch mesh sizes were 64 mm and 67 mm, respectively (Figure 3). The mean<br />
selectivities <strong>of</strong> O. argyrosoma for ¼ inch and ¾ inch mesh sizes were, respectively, 63 mm and 66 mm (Figure 4).<br />
The very small mean size selectivity differences (1 mm – 3 mm) between ¼ inch and ¾ inch mesh sizes among <strong>the</strong><br />
three species demonstrates that <strong>the</strong>re is little or no influence on fish size selection by <strong>the</strong> two different mesh sizes.<br />
Age-at –selectivity is shown in Table 1.<br />
Per recruit analysis<br />
The YPR curves for ¼ inch and ¾ inch nkacha net mesh sizes for C. virginalis, L. sp. ‘pinkhead’ and O. argyrosoma<br />
are shown in Figure 6. The response <strong>of</strong> YPR to differences in <strong>the</strong> age at capture using ¼ inch or ¾ inch nkacha nets<br />
was marginal for <strong>the</strong> three species. The number <strong>of</strong> nkacha gear units calculated for <strong>the</strong> F0.1 and Fmax TRP’s for C.<br />
viginalis, L. sp. ‘pinkhead’ and O. argyrosoma are presented in Table 3. C. virginalis was <strong>the</strong> least resilient to
117<br />
Lake Malawi Fisheries Management Symposium - Proceedings<br />
increased fishing effort (F0.1 = 84-85 gears; Fmax = 154-160 gears), while O. argyrosoma was <strong>the</strong> most resilient (F0.1<br />
= 161-168 gears; Fmax = 348-395 gears) <strong>of</strong> <strong>the</strong> three species.<br />
(a)<br />
Frequency<br />
600<br />
500<br />
400<br />
300<br />
200<br />
100<br />
0<br />
0 20 40 60 80 100 120 140<br />
Total length (mm)<br />
Figure 2. Size selectivity <strong>of</strong> Copadichromis virginalis caught by (a) ¼ inch and (b) ¾ inch nkacha net<br />
mesh sizes in Lake Malombe.<br />
(a)<br />
Figure 3. Size selectivity <strong>of</strong> Lethrinops sp. ‘pinkhead’ caught by (a) ¼ inch and (b) ¾ inch nkacha net<br />
mesh sizes in Lake Malombe.<br />
(a)<br />
Frequency<br />
Frequency<br />
800<br />
600<br />
400<br />
200<br />
0<br />
600<br />
400<br />
200<br />
0<br />
0 20 40 60 80 100 120 140<br />
Total length (mm)<br />
0 20 40 60 80 100 120 140<br />
Total length (mm)<br />
Figure 4. Size selectivity <strong>of</strong> Otopharynx argyrosoma caught by (a) ¼ inch and (b) ¾ inch nkacha net<br />
mesh sizes in Lake Malombe.<br />
(b)<br />
(b)<br />
(b)<br />
Frequency<br />
Frequency<br />
Frequency<br />
100<br />
80<br />
60<br />
40<br />
20<br />
0<br />
150<br />
100<br />
50<br />
0<br />
120<br />
100<br />
80<br />
60<br />
40<br />
20<br />
0<br />
0 20 40 60 80 100 120 140<br />
Total length (mm)<br />
0 20 40 60 80 100 120 140<br />
Total length (mm)<br />
0 20 40 60 80 100 120 140<br />
Total length (mm)
118<br />
Lake Malawi Fisheries Management Symposium - Proceedings<br />
Table 2. Catch composition in <strong>the</strong> nkacha net fishery <strong>of</strong> Lake Malombe, all months combined. (n = 107<br />
catches)<br />
Family Species name (%) Family Species name (%)<br />
ANGUILLIDAE<br />
Anguilla nebulosa labiata 0.00<br />
CICHLIDAE cont.<br />
Oreochromis shiranus 1.17<br />
BAGRIDAE Bagrus meridionalis 0.29<br />
CHARACIDAE Brycinus imberi 0.08<br />
CICHLIDAE Astatotilapia calliptera 0.12<br />
Aulonocara guen<strong>the</strong>ri 0.98<br />
Aulonocara macrochir 0.10<br />
Buccochromis atritaeniatus 0.85<br />
Buccochromis nototaenia 0.18<br />
Copadichromis chrysonotus 17.98<br />
Copadichromis cyaneus 0.08<br />
Copadichromis trimaculatus 0.04<br />
Copadichromis virginalis 11.93<br />
Corematodus taeniatus 0.01<br />
Ctenopharynx intermedius 0.31<br />
Ctenopharynx nitidus 0.00<br />
Ctenopharynx pictus 0.01<br />
Dimidiochromis compreceps 0.06<br />
Dimidiochromis kiwinge 0.02<br />
Fossochromis rostratus 0.00<br />
Hemitaeniochromis discorhynchus 0.21<br />
Hemitilapia oxyrhynchus 0.01<br />
Lethrinops “deep water” altus 4.44<br />
Lethrinops lethrinus 1.55<br />
Lethrinops longipinnis 0.28<br />
Lethrinops macrochir 0.01<br />
Lethrinops parvidens 0.38<br />
CLARIIDAE<br />
CYPIRINIDAE<br />
Oreochromis spp. 0.52<br />
Oreochromis squamipinnis 0.88<br />
Otopharynx argyrosoma 7.60<br />
Otopharynx spp. 0.06<br />
Otopharynx tetraspilus 1.10<br />
Otopharynx tetrastigma 16.68<br />
Placidochromis subocularis 0.75<br />
Protomelas labridens 0.23<br />
Protomelas similis 0.33<br />
Protomelas triaenodon 0.02<br />
Rhamphochromis longiceps 0.53<br />
Rhamphochromis macrophthalmus 0.15<br />
Rhamphochromis spp. 0.32<br />
Sciaenochromis gracilis 0.02<br />
Stigmatochromis woodi 1.41<br />
Tilapia rendalli 0.00<br />
Tramitichromis lituris 0.13<br />
Trematocranus placodon 1.42<br />
Clarias gariepinus 0.67<br />
Bathyclarias longibarbis 0.00<br />
Bathyclarias spp. 0.00<br />
Barbus arcislongae 0.05<br />
Barbus litamba 0.16<br />
Engraulicypris sardella 0.83<br />
Opsaridium microcephalus 0.13<br />
Lethrinops sp. ‘pinkhead’ 23.97 MASTACEMBELIDAE Aethiomastacembelus shiranus 0.00<br />
Lethrinops spp. 0.03<br />
Maravichromis anaphyrmus 0.05<br />
Mylochromis mola 0.05<br />
Nyassachromis argyrosoma 0.66<br />
MOCHOKIDAE<br />
MORMYRIDAE<br />
Synodontis njassae 0.02<br />
Hippopotamirus discorhynchus 0.13<br />
Table 3. Number <strong>of</strong> gear units calculated for <strong>the</strong> F0.1 and Fmax TRPs for Copadichromis virginalis,<br />
Lethrinops sp. ‘pinkhead’ and Otopharynx argyrosoma in Lake Malombe.<br />
Number <strong>of</strong> gears<br />
Species F0.1 Fmax<br />
Copadichromis virginalis 84-85 154-160<br />
Lethrinops sp. ‘pinkhead’ 122-131 224-249<br />
Otopharynx argyrosoma 161-168 348-395
Yield-per-recruit<br />
2.5<br />
2.0<br />
1.5<br />
1.0<br />
0.5<br />
0.0<br />
0.0 0.2 0.4 0.6 0.8 1.0 1.2 1.4 1.6 1.8<br />
2.0<br />
1.6<br />
L. "spp" pinkhead<br />
F0.1 Fmax<br />
1.2<br />
0.8<br />
0.4<br />
0.0<br />
0.0 0.2 0.4 0.6 0.8 1.0 1.2 1.4 1.6 1.8<br />
1.2<br />
1.0<br />
O. argyrosoma<br />
F0.1 Fmax<br />
0.8<br />
0.6<br />
0.4<br />
0.2<br />
0.0<br />
C. virginalis<br />
F CUR<br />
F 0.1<br />
F CUR<br />
0.0 0.2 0.4 0.6 0.8 1.0 1.2 1.4 1.6 1.8<br />
F<br />
119<br />
Lake Malawi Fisheries Management Symposium - Proceedings<br />
Fmax<br />
F CUR<br />
1/4 inch mesh<br />
3/4 inch<br />
Figure 5. Yield per recruit curves for ¼ inch and ¾ inch mesh sizes nkacha nets for Copadichromis<br />
virginalis , Lethrinops sp. ‘pinkhead’ and Otopharynx argyrosoma in Lake Malombe.<br />
Discussion<br />
The use <strong>of</strong> TRPs for <strong>the</strong> <strong>management</strong> <strong>of</strong> a fishery is common practice (Caddy & Mahon 1995), and <strong>the</strong> Malawi<br />
Department <strong>of</strong> Fisheries recommends TRPs based on catch per unit effort (CPUE) in <strong>the</strong> small-scale fishery<br />
(Bulirani et al. 1999). The yield-per-recruit (YPR) approach allows for <strong>the</strong> determination <strong>of</strong> at least two commonly<br />
used TRPs: firstly, <strong>the</strong> fishing mortality which corresponds to <strong>the</strong> maximum <strong>of</strong> <strong>the</strong> yield-per-recruit curve (Fmax) and<br />
secondly, <strong>the</strong> marginal yield or F0.1 strategy (Gulland & Boerema 1973, Deriso 1987). The Fmax approach has<br />
received some criticism in <strong>the</strong> past (Punt 1993), and <strong>the</strong> F0.1 TRP is this is considered to be more robust <strong>management</strong><br />
strategy (King, 1995).<br />
It has long been recognised that when a single gear catches several different species it is impossible to manage each<br />
species at its optimum level (Murawski & Finn, 1988). This complicates <strong>the</strong> <strong>management</strong> <strong>of</strong> multi-species <strong>fisheries</strong>.<br />
One approach that has been applied in such cases is to manage <strong>the</strong> fishery according to <strong>the</strong> least resilient species<br />
(Weyl 1998). In <strong>the</strong> Lake Malombe scenario, C. virginalis was <strong>the</strong> least resilient <strong>of</strong> <strong>the</strong> three species and 85 nkacha<br />
nets are recommended if <strong>the</strong> species is to be managed at a F0.1 level. Based on surplus production models, Weyl et<br />
al. (2001) recommended 170 nkacha gear units for Lake Malombe in order to maintain a MSY <strong>of</strong> 5000 – 7000 tons.<br />
This study shows that from a YPR perspective, this level <strong>of</strong> fishing would exceed <strong>the</strong> F0.1 TRP for all three species<br />
(Table 2). Management at Fmax, for any <strong>of</strong> <strong>the</strong> three species, would allow for 150-160 gears which approximate<br />
Weyl et al.’s (2001) estimate for MSY. Since difference in selectivity <strong>of</strong> ¼- and ¾-inch meshes yielded only a<br />
marginal difference in YPR <strong>the</strong> failure <strong>of</strong> <strong>the</strong> nkacha net fishery to adopt <strong>the</strong> ¾-inch mesh nets is not considered<br />
drastic.
120<br />
Lake Malawi Fisheries Management Symposium - Proceedings<br />
However, it should be recognized that <strong>the</strong> Fmax and F0.1 strategies do not take into account whe<strong>the</strong>r sufficient<br />
spawner biomass is conserved to ensure sufficient recruitment in <strong>the</strong> future (Deriso 1987, Sissenwine & Shepherd<br />
1987, Clarke 1991, Punt 1993). It is also recognised that <strong>the</strong> per-recruit approach has limitations, such as its<br />
assumption <strong>of</strong> constant recruitment (Perreiro 1992), and, <strong>the</strong>refore, its use as a predictive tool is limited to shortterm<br />
predictions. It is crucial that relevant long-term directed catch-at-age or –length data are collected, in all<br />
<strong>fisheries</strong>, to allow for <strong>the</strong> combination <strong>of</strong> <strong>the</strong> per-recruit data with o<strong>the</strong>r age-structured models in order to provide<br />
more accurate, comprehensive and sustainable strategies for long-term <strong>management</strong>.<br />
Acknowledgements<br />
We should like to thank Mr. Davis S. Mandere for help in fish identification. We also extend our gratitude to all <strong>the</strong><br />
research and support staff who assisted in <strong>the</strong> programme. This study was funded by <strong>the</strong> Fisheries Department and<br />
<strong>the</strong> National Aquatic Resource Management Programme (NARMAP).<br />
References<br />
Bulirani, A.E., Banda, M.C., Palsson, O.K., Weyl, O.L.F., Kanyerere, G.Z., Manase, M.M. & Sipawe, R.D. 1999. Fish Stocks<br />
and Fisheries <strong>of</strong> Malawian Waters: Resource Report. Government <strong>of</strong> Malawi, Fisheries Department, Fisheries Research<br />
Unit.54pp.<br />
Caddy, J.F. & Mahon, R. 1995. Reference points for <strong>fisheries</strong> <strong>management</strong>. FAO Fisheries Technical Paper No. 347, Rome,<br />
FAO. 83 pp.<br />
Clark, W.G. 1991. Groundfish exploitation rates based on life history parameters. Can. J. Fish. Aquat. Sci. 48: 734-750.<br />
Deriso, R.B. 1987. Optimal F0.1 criteria and <strong>the</strong>ir relationship to maximum sustainable yield. Can. J. Fish. Aquat. Sci. 44 (Suppl.<br />
2): 339-348.<br />
FAO. 1993. Fisheries <strong>management</strong> in south-east Lake Malawi, <strong>the</strong> Upper Shire River and Lake Malombe, with particular<br />
reference to <strong>the</strong> <strong>fisheries</strong> on chambo (Oreochromis spp.). CIFA Tech. Pap. 21. FAO, Rome. 113 pp.<br />
Gulland, J.A. & Boerema, L.K. 1973. Scientific advice on catch levels. Fish. Bull. 71: 325-335.<br />
Jambo, C.J. 1997. Aspects <strong>of</strong> <strong>the</strong> ecology and reproductive biology <strong>of</strong> three cichlid fish species <strong>of</strong> sou<strong>the</strong>rn Lake Malombe<br />
(Malawi). M.Sc. Thesis. Rhodes University, Grahamstown, South Africa. 126 pp.<br />
King, M. 1995. Fisheries biology, assessment and <strong>management</strong>. Fishing News Books, Oxford. 341 pp.<br />
Murawski, S.A. & Finn, J.T. 1988. Biological bases for mixed-species <strong>fisheries</strong>: species co-distribution in relation to<br />
environmental and biotic variables. Can. J. Fish. Aquat. Sci., 45: 1720-1735.<br />
Pereiro, J.A. 1992. Some conceptual remarks on yield per recruit. Fish. Res. 13: 423-428.<br />
Punt, A.E. 1993. The use <strong>of</strong> spawner-biomass-per-recruit in <strong>the</strong> <strong>management</strong> <strong>of</strong> line<strong>fisheries</strong>. Special Publication <strong>of</strong> <strong>the</strong><br />
Oceanographic Research Institute, Durban, 2: 80-89.<br />
Sissenwine, M.P. & Shepherd, J.G. 1987. An alternative perspective on recruitment overfishing and biological reference points.<br />
Can. J. Fish. Aquat. Sci. 44: 913-918.<br />
Weyl, O.L.F. 1998, The dynamics <strong>of</strong> a sub-tropical <strong>lake</strong> fishery in central Mozambique. PhD Thesis, Rhodes University, 200p.<br />
Weyl, O.L.F. 2001. Mortality rates and catchability coefficients for three major target species in <strong>the</strong> nkacha net fishery <strong>of</strong> Lake<br />
Malombe. National Aquatic Resource Management Programme (NARMAP) Working Paper No. 3. 7 pp.<br />
Weyl, O.L.F., Banda, M., Sodzabanja, G., Mwenekibombwe, L.H., Namoto, W. & Mponda, O.C. 2000. Annual frame survey:<br />
September 1999. Fisheries Bulletin No. 42. Department <strong>of</strong> Fisheries , Lilongwe, Malawi. 56+23 pp.<br />
Weyl, O.L.F., Banda, M.C., Manase, M., Namoto, W. & Mwenekibombwe, L.H. 2001. Analysis <strong>of</strong> catch and effort data for <strong>the</strong><br />
<strong>fisheries</strong> <strong>of</strong> Lake Malombe, 1976-1999. Fisheries Bulletin No. 45. Department <strong>of</strong> Fisheries , Lilongwe, Malawi. 53 pp.
121<br />
Lake Malawi Fisheries Management Symposium - Proceedings<br />
Drifting Long Line, A Potential Fishing Method for <strong>the</strong> Nor<strong>the</strong>rn Part <strong>of</strong> Lake<br />
Nyasa/Malawi/Niassa<br />
K.J. Kihedu, M.K.L. Mlay, J.A. Mwambungu and B.P. Ngatunga<br />
Tanzania Fisheries Research Institute, Kyela Centre, P.O. Box 98, Kyela, Mbeya Region, East Africa<br />
Abstract<br />
Fishing gears commonly used in <strong>the</strong> Tanzanian Waters <strong>of</strong> Lake Nyasa consist <strong>of</strong> open water seine nets (Ndaturu/Pajero)) gillnets<br />
(vilepa) traps (migono) beach seine nets (kokoro) and hook and line (ndoano). These methods <strong>of</strong> fishing exploit mainly <strong>the</strong> near<br />
shore and riverine species. Based on recommendation <strong>of</strong> <strong>the</strong> UK/SADC Pelagic Fish Resource Assessment Project on <strong>the</strong> use <strong>of</strong><br />
drifting long line to exploit <strong>of</strong>fshore fish communities, trial fishing was carried out <strong>of</strong>f Lupingu, Ikombe, Manda and Mbamba-bay<br />
villages in Tanzania. The results were encouraging and <strong>the</strong>y are presented and discussed. With a mean daily catch rate <strong>of</strong><br />
5.8 kg/100 hooks/2hours <strong>of</strong> fishing, this method proved to local fishermen to be more pr<strong>of</strong>itable and environmentally friendly than<br />
using <strong>the</strong> destructive beach seine nets.<br />
Introduction<br />
Lake Nyasa is <strong>the</strong> most sou<strong>the</strong>rn <strong>of</strong> <strong>the</strong> African great <strong>lake</strong>s situated in <strong>the</strong> rift valley <strong>of</strong> East Africa. It lies between<br />
9° 30'S and 14° 30'S. It is <strong>the</strong> third largest <strong>lake</strong> in Africa with respect to surface area and <strong>the</strong> second most<br />
voluminous. The <strong>lake</strong> is long and narrow with an approximate length <strong>of</strong> 550 km and a mean width <strong>of</strong> 50-60 km.<br />
With a surface area <strong>of</strong> 28 800 km² and a volume <strong>of</strong> 8 400 km³ it gives an average depth <strong>of</strong> 292 m. (Menz 1995). The<br />
maximum depth is given as 785 m by Gonfiatini et al. (1979), with deepening <strong>of</strong> <strong>the</strong> basin towards <strong>the</strong> north.<br />
Tanzanian shoreline <strong>of</strong> Lake Nyasa extend 300 km in <strong>the</strong> north west to north east. Most <strong>of</strong> <strong>the</strong> inshore area <strong>of</strong> <strong>the</strong><br />
<strong>lake</strong> on <strong>the</strong> Tanzanian side is very deep with few patches <strong>of</strong> shallow zones especially around <strong>the</strong> mouths <strong>of</strong> rivers<br />
Songwe, Kiwira, Mbaka, Rufilyo and Ruhuhu.<br />
The <strong>fisheries</strong> <strong>of</strong> <strong>the</strong> <strong>lake</strong> are very varied exploiting most <strong>of</strong> <strong>the</strong> inshore water communities as well as <strong>the</strong> river<br />
running species and some <strong>of</strong>fshore communities.<br />
Most <strong>of</strong> <strong>the</strong> fishing in Tanzanian waters <strong>of</strong> <strong>the</strong> Lake is done with dug-out canoes. Fishing gears commonly in use<br />
consist <strong>of</strong> open water seine nets, gillnets, beach seine nets, traps and hooks. Longline has been used in Lake Nyasa<br />
to catch fish mainly catfishes (Bagrus meridionalis, Clarias species and Bathyclarias species). No pelagic longline<br />
has been reported on Lake Nyasa (ICLARM and GTZ 1991). The UK/SADC pelagic Fish Resource Assessment<br />
Project had recommended fishing with pelagic handline or longline using usipa or some o<strong>the</strong>r fish as bait in catching<br />
Rhamphochromis spp. especially <strong>the</strong> larger individuals that occur in 100-200 m <strong>of</strong> water (UK/SADC interim report,<br />
1993).<br />
Acoustic evidence strongly suggests that fish biomass fur<strong>the</strong>r <strong>of</strong>fshore remained relatively constant (Rufli, 1982).<br />
The fish in <strong>the</strong> Pelagic zone formed a simple but highly structured community. Fish biomass <strong>of</strong> <strong>the</strong> pelagic zone <strong>of</strong><br />
Lake Nyasa was estimated to be 90 kg/ha (Rufli and Vitullo, 1982). Fish stocks in Lake Nyasa still seem to be high<br />
enough suggesting that <strong>the</strong> fish are less heavily exploited in <strong>the</strong> <strong>lake</strong> especially in <strong>the</strong> pelagic zone.<br />
Materials and Methods<br />
Fishing was conducted in <strong>the</strong> Tanzanian pelagic waters <strong>of</strong> Lake Nyasa in Ludewa district <strong>of</strong>f Lupingu village<br />
(Figure 1). An 18 footer rubber dingy mounted with a 30Hp Yamaha out-board petrol engine was used during<br />
fishing operations. Three gangs <strong>of</strong> longlines each consisting <strong>of</strong> 100 hooks <strong>of</strong> sizes No. 7, No 11 and No. 13 were<br />
constructed. According to <strong>the</strong> numbering system <strong>of</strong> hooks number 7 was <strong>the</strong> largest and number13 <strong>the</strong> smallest. For<br />
each gang, hooks were attached to 0.5 mm thick mon<strong>of</strong>ilament line and individually hang 4m apart on a 0.8mm<br />
thick mon<strong>of</strong>ilament line 400 m long. During <strong>the</strong> fishing operations <strong>the</strong> three gangs were joined toge<strong>the</strong>r to constitute<br />
a line 1200 m long. Each line was suspended at each end on a rope 4 x100 m deep attached to a surface buoy with a<br />
flag at both ends (fig.3). The hooks were baited with Engraulicypris sardella ‘usipa’, a bait known to be preferred<br />
by most <strong>of</strong> <strong>the</strong> predator fish found in <strong>the</strong> <strong>lake</strong>.<br />
The long line was set early in <strong>the</strong> morning at <strong>the</strong> depth <strong>of</strong> 100 m at a point where <strong>the</strong> water depth was 130 m or more<br />
targeting for any available predatory fish at that depth. The longline was left in <strong>the</strong> water for 2hrs before hauling.<br />
This is considered as <strong>the</strong> maximum time <strong>the</strong> fish is allowed to feed and taking into consideration that <strong>the</strong> quality <strong>of</strong><br />
<strong>the</strong> bait deteriorates with time (Allison et al. 1995).<br />
The total catch from each longline was weighed and <strong>the</strong>n sorted into species and <strong>the</strong> total length <strong>of</strong> each fish was<br />
recorded. These data were prerequisite for <strong>the</strong> information required; <strong>the</strong> catch rate and catch composition.
122<br />
Lake Malawi Fisheries Management Symposium - Proceedings<br />
The same method was employed when setting drifting longlines at Ikombe, Manda and Mbamba-bay (Fig.1). In<br />
<strong>the</strong>se demonstrations however hooks No.13, 11 and 9 were employed instead <strong>of</strong> hook sizes No.13, 11 and 7 set at<br />
Lupingu.<br />
Malawi<br />
Kyela<br />
Itungi port Matema<br />
Nkanda<br />
Ludewa<br />
Lupingu<br />
Manda<br />
Figure 1. Lake Nyasa (Tanzania side).<br />
Results and Discussion<br />
TANZANIA<br />
Mbinga<br />
Mbamba-bay<br />
MOZAMBIQUE<br />
Catch rates<br />
Catch rates (kg/300 hooks/2 hours) for <strong>the</strong> three longlines from pelagic waters <strong>of</strong> Lake Nyasa <strong>of</strong>f Lupingu village<br />
(Ludewa district) set for three weeks in August/September, 1995 are shown in Table 1. Total daily catch ranged<br />
between 279kg/300h/2hrs and 13.5kg/300h/2hrs (mean = 5.759kg/300h/2hrs). Catches were higher in hook size<br />
umber 11 (Average catch rate = 2.63kg/100h/2hrs) and least in hook size number 7 (Average catch rate =<br />
0.99kg/100h/2hrs). There is no significant difference in catches with respect to varied water depth, wea<strong>the</strong>r and<br />
station (t-test; p.0.05).<br />
Table 1: Catch rates (kg/100 hooks/2 hours) for three different sizes <strong>of</strong> hooks from pelagic waters <strong>of</strong><br />
Lake Nyasa <strong>of</strong>f Lupingu village (Ludewa district) caught in August/September, 1995.<br />
LL 7 LL 11 LL 13 TOTAL<br />
Date Cruise No. Depth. Wea<strong>the</strong>r Station Weight Station Weight Station Weight<br />
22.8.95AM 1 140m Strong wind 1 3.5 3 7.29 2 2.25 13.50<br />
23.8.95AM 2 140m Strong wind 1 0.00 2 1.05 3 1.74 2.79<br />
24.8.95AM 3 180m Calm 2 1.00 3 0.15 1 1.33 3.48<br />
25.8.95AM 4 150m Calm 3 0.00 1 2.46 2 0.85 3.41<br />
26.8.95AM 5 130m Calm 3 0.35 2 4.17 1 2.94 7.46<br />
27.8.95AM 6 130m Calm 2 0.58 1 1.73 3 1.16 3.47<br />
28.8.95AM 7 160m Strong wind 1 0.85 2 0.92 3 1.37 5.14<br />
29.8.95AM 8 150m Strong wind 2 1.05 3 0.90 1 2.38 4.33<br />
30.8.95AM 9 135m Strong wind 3 1.36 2 7.21 1 4.54 13.11<br />
31.8.95AM 10 130m Calm 3 0.44 1 1.05 2 1.70 3.19<br />
1.9.95AM 11 150m Calm 3 0.00 2 2.12 1 1.95 4.07<br />
2.9.95AM 12 140m Calm 3 0.00 1 0.4 2 3.31 3.71<br />
2.9.95PM 13 130m Calm 3 0.00 1 2.45 2 0.90 3.35<br />
3.9.95AM 14 150m Calm 3 0.00 1 7.10 2 1.90 9.00<br />
4.9.95AM 15 160m Calm 2 0.84 1 0.40 3 2.97 4.21<br />
5.9.95AM 16 140m Calm 1 6.52 3 3.11 2 2.20 11.83<br />
6.9.95AM 17 130m Strong wind 2 0.36 3 2.22 1 1.80 4.38<br />
TOTAL WEIGHT 16.86 44.73 35.29 100.43<br />
AVERAGE WEIGHT (KG) 0.99 2.63 2.08 575.90
123<br />
Lake Malawi Fisheries Management Symposium - Proceedings<br />
Catch composition<br />
Catch composition <strong>of</strong> fish caught in three hook lines is summarized in Table 2. The species caught contribute five<br />
families out <strong>of</strong> <strong>the</strong> ten considered to exist in Lake Nyasa. The families are cichlidae (Rhamphochromis and<br />
Lethrinops), Clarridae (Clarias spp.) (Bathyclarias sp.), Bagridae (Bagrus meridionalis), Mochokidae (Synodontis<br />
njassae) and Cyprinidae (Opsaridium spp.). From all three longlines <strong>the</strong> catch composition showed that <strong>the</strong><br />
predatory cichlids <strong>of</strong> <strong>the</strong> genus Rhamphochromis are more common in <strong>the</strong> catches followed by clariid catfishes,<br />
Bathyclarias spp. O<strong>the</strong>r fish in <strong>the</strong> catch included Bagrus meridionalis, Synodontis njassae, Clarias spp., Lethrinops<br />
spp. and <strong>the</strong> predatory cyprinids Opsaridium microlepis and O.microcephalum. Hook number 7 caught more bigger<br />
fish Bagrus meridionalis, number 11 caught more medium sized fish, Rhamphochromis ferox while small fish-<br />
Rhamphochromis longiceps was caught mainly on hook number 13.<br />
Table 2. The size composition <strong>of</strong> fish caught in three hook lines <strong>of</strong>f Lupingu village in August/September,<br />
1995<br />
Family Genus/Species Weight (Kg/haul) and numbers/haul per 100<br />
hooks<br />
Line No. 7 Line No. 11 Line No. 13<br />
Kg. No. Kg. No. Kg. No.<br />
Claridae Bathyclarias spp. 0.01 0.07 1.19 0.41 0.29 0.24<br />
Clarias spp. 0.09 0.07 0.00 0.00 0.00 0.00<br />
Bagridae Bagrus meridionalis 0.53 0.60 0.15 0.24 0.30 0.18<br />
Mochokidae Syodontis njassae 0.00 0.00 0.01 0.06 0.01 0.06<br />
Cichlidae Rhamphochromis spp 0.35 0.97 1.30 3.53 1.32 3.52<br />
Lethrinops spp. 0.11 0.13 0.06 0.41 0.07 0.35<br />
Cyprinidae Opsaridium microcephalum 0.00 0.00 0.00 0.00 0.02 0.06<br />
Opsaridium microlepis 0.00 0.00 0.01 0.06 0.00 0.02<br />
TOTAL 1.08 2.62 2.07<br />
Length distribution<br />
Catch rates (Kg /300hooks/2hrs) for three longlines from pelagic waters <strong>of</strong> Lake Nyasa <strong>of</strong>f Nkanda village (Kyela<br />
district) set for 12 days in October, 1998. Deductions as Shown in Table 3 show that <strong>the</strong> total daily catch ranged<br />
between 2.2 kg/300 h/2 hours and 18.95 kg/300 hooks/2 hours (Mean = 9:40 kg/300 hooks/2 hours). Catches were<br />
higher in hook size number 13 (Average catch rate = 3.61 kg/100h/2 hours) and least in hook size No. 9 (average<br />
catch rate = 2.57 kg/100 hooks/2 hours).<br />
The catch composition <strong>of</strong> fish caught from <strong>the</strong> three gangs <strong>of</strong> long lines from <strong>the</strong> pelagic waters <strong>of</strong> Lake Nyasa <strong>of</strong>f<br />
Nkanda Village (Kyela district) set for two weeks in October 1998 is summarized in Table 4. The species caught<br />
include Rhamphochromis and Lethrinops (cichlidae), Bathyclarias spp. (claridae), Bagrus meridionalis (bagridae)<br />
and Synodonts njassae (mochokidae). The catch composition show that Bagrus meridionalis was more common in<br />
<strong>the</strong> catches followed by predatory cichlid <strong>of</strong> <strong>the</strong> genus Rhamphochromis and by clariid catfishes, Bathyclarias spp.<br />
Table 3. Catch rates (Kg/100 hooks/2 hours) for three different sizes <strong>of</strong> hooks from Pelagic Waters <strong>of</strong><br />
Lake Nyasa <strong>of</strong>f Nkanda Village (Kyela District) caught in October, 1998.<br />
LL 9 LL 11 LL 13<br />
Date Cruise No. Water Station Weight Station Weight Station Weight Total<br />
Depth.<br />
Weight<br />
8.10.98 1 120m 3 0.50 2 2.30 1 4.90 7.70<br />
9.10.98 2 120m 2 0.10 1 0.15 3 -<br />
0.25<br />
12.10.98 3 119m 3 0.70 1 1.55 2 1.75 4.00<br />
13.10.98 4 120m 1 2.35 3 8.61 2 4.45 15.41<br />
14.10.98 5 120m 1 3.65 2 2.55 3 1.05 7.25<br />
15.10.98 6 120m 2 9.15 1 2.75 3 4.22 16.12<br />
16.10.98 7 120m 3 0.46 1 2.15 2 2.45 5.06<br />
17.10.98 8 123m 3 5.10 1 7.85 2 6.00 18.95<br />
18.10.98 9 120m 2 4.05 1 5.25 3 5.95 15.25<br />
21.10.98 10 120m 1 4.30 3 1.25 2 5.45 11.00<br />
21.10.98 11 120m 3 0.45 1 1.50 2 0.25 2.20<br />
22.10.98 12 120m 3 1.50 2 1.90 3 2.05 5.45<br />
TOTAL WEIGHT 32.31 37.81 38.52 107.09<br />
AVERAGE WEIGHT(KG) 2.68 3.02 3.21 8.92
124<br />
Lake Malawi Fisheries Management Symposium - Proceedings<br />
Table 4. The catch composition <strong>of</strong> fish caught in three hook lines <strong>of</strong>f Nkanda village in October, 1998<br />
Family Genus/Species Weigh (kg/haul) and numbers/haul per 100 hooks<br />
Line No. 9 Line No. 11 Line No. 13<br />
Kg. No. Kg. No. Kg. No.<br />
Claridae Bathyclarias spp. 0.45 0.38 0.43 0.54 0.77 0.38<br />
Bagridae Bagrus meridionalis 1.80 3.50 2.48 5.08 2.05 3.77<br />
Mochokidae Synodontis njassae 0.00 0.00 0.00 0.00 0.02 0.15<br />
Cichlidae Diplotaxodon spp. 0.00 0.08 0.05 0.31 0.02 0.31<br />
Rhamphochromis spp. 0.28 0.77 0.13 0.62 0.38 0.92<br />
Lethrinops spp. 0.04 0.31 0.13 0.62 0.01 0.15<br />
TOTAL: 2.57 3.22 3.61<br />
Catch rates ( Kg/300hooks/2hrs) for three longlines from pelagic waters <strong>of</strong> Lake Nyasa <strong>of</strong>f Manda village (Ludewa<br />
district) set for 14 days ( June/July 1999) are shown in Table 5, <strong>the</strong> daily catch ranged between 2.70 kg/300 hooks/2<br />
hours and 33.73 kg/300 hooks/2 hours. (Mean = 16.33 kg/300 hooks/2 hours). Catches were higher in hook size<br />
number 9 (average catch rate = 5.58 kg/100 hooks/2 hours) and least in hook size number 11 (average catch rate =<br />
5.24 kg/100 hooks/2 hours).<br />
The catch composition summarized in Table 6 below. Species caught include Rhamphochromis, Diplotaxodon,<br />
Lethrinops (Cichlidae), Bathyclarias spp. and Clarias (Claridae), Bagrus meridionalis (Bagridae) and Synodontis<br />
njassae (Mochokidae). The catch composition showed that Bagrus meridionalis was more common in <strong>the</strong> catches<br />
followed by Rhamphochromis followed by Diplotaxodon and by clariid catfishes Clarias and Bathyclarias. spp.<br />
Catch rates (Kg/300hooks/2hrs) for three sets <strong>of</strong> longlines from pelagic waters <strong>of</strong> Lake Nyasa <strong>of</strong>f Mhalo village<br />
(Mbamba-bay) Mbinga district set for 9 days May,2000. Table 7, show <strong>the</strong> daily catch ranged between 1.41 kg/300<br />
hooks/2 hours and 6.72 kg/300 hooks/2 hours (Mean = 3.68 kg/300 hooks/2 hours). Catches were higher in hook<br />
size No. 13 (average catch rate 1.57 kg/100 hooks/2 hours) and least in hook size No. 9 (average catch rate<br />
0.97 kg/100 hours/2 hours).<br />
Table 5. Catch rates (kg/100 hooks/2 hours) from three different sizes <strong>of</strong> hooks from Pelagic Waters <strong>of</strong><br />
Lake Nyasa <strong>of</strong>f Fokland (Manda) caught in June-July, 1999<br />
Date Cruise Water Long Line<br />
Long Line<br />
Long Line<br />
Total<br />
No. Depth(m) Hook No. 9 Hook No. 11 Hook No. 13 Weight<br />
Station Weight Station Weight Station Weight<br />
No. (kg) No. (kg) No. (kg)<br />
20.06.99 1 120 3 4.50 2 0.95 1 0.25 6.40<br />
21.06.99 2 115 3 4.25 2 - 1 - 4.25<br />
22.06.99 3 115 3 6.03 1 13.57 2 11.93 31.53<br />
23.06.99 4 115 1 18.28 2 1.90 3 - 20.18<br />
24.06.99 5 110 2 6.45 1 6.59 3 14.09 27.13<br />
25.06.99 6 110 2 0.30 1 10.20 3 1.35 11.85<br />
26.06.99 7 110 1 6.62 2 2.50 3 0.49 9.61<br />
27.06.99 8 115 1 1.81 2 0.45 3 0.90 3.16<br />
02.07.99 9 110 1 0.33 2 1.38 3 0.99 2.70<br />
03.07.99 10 115 1 3.12 2 8.30 3 11.45 22.87<br />
04.07.99 11 120 1 2.69 2 8.84 3 4.49 16.02<br />
05.07.99 12 110 2 6.75 1 8.34 3 8.31 23.40<br />
06.07.99 13 115 2 3.55 1 3.55 3 8.62 15.72<br />
07.07.99 14 115 1 13.40 2 6.74 3 13.59 33.73
125<br />
Lake Malawi Fisheries Management Symposium - Proceedings<br />
Table 6. The catch composition <strong>of</strong> fish caught in three hook line <strong>of</strong>f Forkland-Manda in June-July, 1999<br />
Family Genus/Species Weight (kg/haul) and number/haul per 100 hooks<br />
Line No. 9 Line No. 11 Line No. 13<br />
Kg. No. Kg. No. Kg. No.<br />
Claridae Bathyclarias spp. 0.69 0.57 1.01 0.50 0.84 0.43<br />
Clarias spp. 0.94 0.93 1.14 0.93 0.15 0.21<br />
Bagridae Bagrus meridionalis 3.44 3.07 2.17 2.64 2.96 2.71<br />
Mochokidae Syonodontis njassae - - 0.04 0.07 0.01 0.07<br />
Cichilidae Rhamphochromis spp. 0.16 0.50 0.65 2.43 1.26 3.64<br />
Diplotaxodon spp. 0.04 0.57 0.06 0.50 0.13 1.29<br />
Lethrinops spp. 0.08 0.36 0.02 0.14 0.11 0.50<br />
O<strong>the</strong>rs 0.09 0.21 0.04 0.14 - -<br />
The catch composition <strong>of</strong> fish caught from <strong>the</strong> three sets <strong>of</strong> long lines from <strong>the</strong> pelagic waters <strong>of</strong> Lake Nyasa <strong>of</strong>f<br />
Mhalo – Mbamba-bay (Mbinga district) set for 9 days in February 2000 is summarized in Table 8.<br />
Species caught include: Rhamphochromis, Diplotaqxodon and Lethrinops (Cichlidae) Bathyclarias spp. and Clarias<br />
(Claridae) and Bagrus meriodionalis (Bagridae). The catch composition showed that Rhamphochromis spp. were<br />
more common in <strong>the</strong> catches (actually dominating <strong>the</strong> catches) followed by Diplotaxodon and by Lethrinops spp.<br />
As pointed out earlier Rhamphchromis species were considered more abundant for long line fishery in <strong>the</strong> pelagic<br />
waters <strong>of</strong> Lake Nyasa. The setting <strong>of</strong> <strong>the</strong>se demonstrations thus took into consideration feeding habits <strong>of</strong> this<br />
predatory cichlid. The major feeding period <strong>of</strong> which is in <strong>the</strong> morning and a minimum peak in <strong>the</strong> afternoon.<br />
However as observed from <strong>the</strong> catch composition Bagrus meridionalis was more common. Important also are <strong>the</strong><br />
clariid catfishes Bathyclarias species and Clarias species. Since <strong>the</strong>y constitute significantly to <strong>the</strong> long line catches<br />
in <strong>the</strong> nor<strong>the</strong>rn part <strong>of</strong> <strong>the</strong> <strong>lake</strong>, it is imperative to consider <strong>the</strong>ir feeding behaviour in future demonstrations.<br />
Table 7. Catch rates (kg/100 hooks/2 hours from three different sizes <strong>of</strong> hooks from Pelagic Waters <strong>of</strong><br />
Lake Nyasa <strong>of</strong>f Mhalo (Mbamba-bay) caught in May, 2000<br />
Date Cruise Water Long Line Hook Long Line Hook Long Line Hook Total<br />
No. Depth(m) No. 9<br />
No. 11<br />
No. 13<br />
Weight<br />
Station Weight Station Weight Station Weight<br />
No. (kg) No. (kg) No. (kg)<br />
8.02.2000 1 120 1 0.51 2 1.70 3 2.46 4.67<br />
9.02.2000 2 115 3 1.73 2 0.65 1 0.51 2.89<br />
10.02.2000 3 120 3 - 2 0.50 1 0.91 1.41<br />
11.02.2000 4 120 3 1.69 2 0.53 1 2.08 4.30<br />
12.02.2000 5 120 1 - 2 2.77 3 3.95 6.72<br />
13.02.2000 6 120 1 0.28 2 0.82 3 1.49 2.59<br />
16.02.2000 7 120 1 2.27 3 2.50 2 0.95 5.72<br />
17.02.2000 8 120 2 0.35 1 0.25 3 1.05 1.65<br />
18.02.2000 9 130 3 1.90 1 0.60 2 0.70 3.20<br />
Table 8. The catch composition <strong>of</strong> fish caught in three hook lines <strong>of</strong>f Mhalo-Mbamba-bay in February,<br />
2000<br />
Family Genus/Species Weight (kg/haul) and numbers (haul/100 hooks)<br />
Line No. 9 Line No. 11 Line No. 13<br />
Kg. No. Kg. No. Kg. No.<br />
Claridae Bathyclarias spp. 0.16 0.11 - - - -<br />
Clarias spp. 0.04 0.11 - - - -<br />
Bagridae Bagrus meridionalis 0.04 0.11 - - - -<br />
Cichilidae Rhamphochromis spp. 0.64 2.00 0.98 3.33 1.96 4.22<br />
Diplotaxodon spp. 0.03 0.11 0.06 0.22 0.03 0.22<br />
Lethrinops spp. 0.06 0.22 - - - -
126<br />
Lake Malawi Fisheries Management Symposium - Proceedings<br />
Table 9. Range and mean <strong>of</strong> total lengths (cm) <strong>of</strong> fish caught by long line fishery from Pelagic Waters <strong>of</strong><br />
Lake Nyasa <strong>of</strong>f Nkanda/Ikombe in October, 1998.<br />
Fish Species Range Mean N.<br />
Bagrus meridionalis 18.0 – 84.0 37.1 154<br />
Rhamphochromis spp. 20.0 – 45.0 31.7 33<br />
Clarias spp. 28.0 – 72.0 59.5 14<br />
Diplotaxodon spp. 16.0 – 23.0 19.1 9<br />
Synodontis njassae 13.0 – 18.0 15.0 3<br />
Haplochromis spp. 16.0 – 28.0 23.5 14<br />
Table 10. Range and mean <strong>of</strong> total lengths (cm) <strong>of</strong> fish caught by long line fishery from Pelagic Waters <strong>of</strong><br />
Lake Nyasa <strong>of</strong>f Fokland (Manda) in June- July, 1999.<br />
Fish Species Range Mean N.<br />
Bagrus meridionalis 19.0 – 66.5 40.7 118<br />
Rhamphochromis spp. 17.0 – 45.0 31.64 92<br />
Clarias sp. 19.0 – 90.0 61.0 23<br />
Diplotaxodon spp. 13.5 – 26.0 19.3 34<br />
Bathyclaria spp. 36.0 – 87.5 59.5 21<br />
Lethrinops spp. 11.0 – 27.5 23.1 14<br />
Synodontis njassae 13.0 – 15.0 14.0 2<br />
Haplochromis spp. 21.0 – 34.5 29.3 5<br />
Copadichromis spp. 10.0 – 10.0 10.0 1<br />
Table 11. Size range and mean <strong>of</strong> total lengths (cm) <strong>of</strong> fish species caught by long line fishery from<br />
Pelagic Waters <strong>of</strong> Lake Nyasa <strong>of</strong>f Mhalo (Mbamba-bay) in February, 2000.<br />
Fish Species Range Mean N.<br />
Rhamphochromis spp. 13.8 – 45.5 27.7 87<br />
Bagrus meridionalis 33 33 1<br />
Bathyclarias spp. 31.5 31.5 1<br />
Diplotaxodon spp. 16.0 – 24.5 21.5 5<br />
Lethrinops spp. 18.5 – 25.0 21.8 2<br />
Recommendations<br />
Fishermen should be encouraged to practice drifting longline because:<br />
• It is cost effective<br />
• Environmentally friendly<br />
• Targets for mainly large fish<br />
• Hooks # 9-13 are recommended<br />
• O<strong>the</strong>r baits also be investigated<br />
• Demonstrations should cover <strong>the</strong> entire Tz coast.<br />
References<br />
Gonfiatini, R., Zuppi, G., Eccles, D. H. & Ferro, W. 1979. Isotope investigation <strong>of</strong> Lake Malawi. In Isotope in <strong>lake</strong> studies.<br />
International Atomic Energy Agency, Vienna.<br />
ICLARM & G.T.Z. 1991. The context <strong>of</strong> small scale integrated agriculture – Aquaculture systems in Africa. A case study <strong>of</strong><br />
Malawi: ICLARM Stud. Rev.<br />
Menz A. 1995. The fishery Potential and Productivity <strong>of</strong> <strong>the</strong> pelagic zone <strong>of</strong> Lake Malawi/Niassa. Chathan, U.K. Natural<br />
Resources Institute.<br />
Rufli, H. 7 Vitullo, J. A. 1952. Preliminary estimate <strong>of</strong> <strong>the</strong> abundance <strong>of</strong> Pelagic Fish Stocks in Lake Malawi. In biological<br />
studies on <strong>the</strong> pelagic ecosystem <strong>of</strong> Lake Malawi. Rome/FAO/UNDP F< LDP/MLW/75/019 Technical Report I:<br />
138/153.<br />
UK/SADC. 1993. Pelagic Fish Resource Assessment Project. Interim Technical Report.<br />
Walezak, P.S. 1982. Feeding habits and daily food consumption rates <strong>of</strong> <strong>the</strong> major Pelagic fish species <strong>of</strong> Lake Malawi.<br />
Supplement to: Biological Studies <strong>of</strong> <strong>the</strong> Pelagic Ecosystem <strong>of</strong> Lake Malawi, FAO Technical Report 1, FI:<br />
DP/MLW/75/019, Field document 15.
127<br />
Lake Malawi Fisheries Management Symposium - Proceedings<br />
Gear and species selectivity <strong>of</strong> <strong>the</strong> chilimira kauni fishery in Lake Malawi<br />
Jacqueline Chisambo<br />
Fisheries Research Unit, P.O. Box 27, Monkey Bay<br />
Abstract<br />
Kauni fishing in Lake Malawi occurs by using a chilimira net (an open water seine net) at night using light from paraffin lamps to<br />
attract <strong>the</strong> fish. Kauni fishing occurs in both <strong>the</strong> south-east (SEA) and south-west arms (SWA) <strong>of</strong> Lake Malawi. Catches from kauni<br />
gears landing at Kela beach (SEA) and Msaka beach (SWA) were examined for a one-year period to determine <strong>the</strong> potential effects<br />
on <strong>the</strong> fish stocks. Catch composition and length frequency assessments were performed. The kauni fishery in both areas was<br />
multi-species with 70 species recorded in <strong>the</strong> Kela fishery and 65 species in Msaka. At Kela <strong>the</strong> major genera targeted were<br />
Rhamphochromis, Oreochromis and Copadichromis, which made up over 75 % <strong>of</strong> <strong>the</strong> catch composition. At Msaka <strong>the</strong> major<br />
genera were Rhamphochromis, Engraulicypris and Copadichromis, which made up over 85 % <strong>of</strong> <strong>the</strong> catch. Length frequencies <strong>of</strong><br />
Oreochromis spp. Rhamphochromis spp. and Copadichromis virginalis are examined and recommendations for managing this<br />
fishery are made.<br />
Introduction<br />
It is a well-known fact for Lake Malawi that <strong>the</strong>re has been a decline in <strong>the</strong> chambo Oreochromis spp. stocks.<br />
Catches <strong>of</strong> chambo in Lake Malawi peaked at 8-9 000 tons in <strong>the</strong> late 1970s and in <strong>the</strong> mid-1980s but declined in<br />
1986-87 (Bulirani et al. 1999). The south-east arm is <strong>the</strong> most important fishing ground for chambo. Catches were<br />
stable at 5-6 000 tons during 1986-92 but have declined to 1 800-2 800 tons a year (Bulirani et al. 1999). The bulk<br />
<strong>of</strong> <strong>the</strong> catch has been taken in <strong>the</strong> traditional fishery, which uses various gears such as gill nets, chambo seines,<br />
kambuzi seines and chilimira nets. The chambo stocks are now considered threatened and in need <strong>of</strong> <strong>management</strong><br />
(Bulirani et al. 1999).<br />
In <strong>the</strong> south-east arm <strong>of</strong> Lake Malawi it was observed that, while chambo formed only a small component <strong>of</strong> <strong>the</strong><br />
chilimira net fishery as a whole, <strong>the</strong> high effort levels in this fishery result in <strong>the</strong> fishery contributing between 25%<br />
and 46% <strong>of</strong> <strong>the</strong> total chambo catch (Weyl, 1999). The chambo is being exploited by chilimira nets (open water<br />
seine nets; FAO, 1993), which are locally known as kauni (a term referring to <strong>the</strong> light attraction method by using<br />
lamps at night to attract fish into <strong>the</strong> nets: Banda unpublished). The chilimira that targets chambo is a derivative <strong>of</strong><br />
<strong>the</strong> gear used for catching usipa and this derivative gear used in <strong>the</strong> kauni fishery is known to operate in both <strong>the</strong><br />
sou<strong>the</strong>ast and southwest arms <strong>of</strong> <strong>the</strong> <strong>lake</strong>. It has been found that <strong>the</strong> chilimira fishers in Area A <strong>of</strong> <strong>the</strong> south–eastern<br />
arm directly target chambo (Weyl, 1999, Weyl & Banda, 2001). A preliminary report on <strong>the</strong> fishery in this area<br />
showed that over 80% <strong>of</strong> <strong>the</strong> chambo caught in <strong>the</strong> kauni fishery was immature (Banda unpublished). This indicated<br />
that <strong>the</strong> fishing method was affecting <strong>the</strong> recruitment <strong>of</strong> chambo (Banda, unpublished). Due to this observation<br />
Banda recommended <strong>the</strong> closure <strong>of</strong> <strong>the</strong> kauni fishery.<br />
The chambo directed kauni fishery <strong>of</strong> Area A is <strong>of</strong> major concern and it has been recommended that <strong>the</strong>re should be<br />
a closure <strong>of</strong> this fishery in this area since it is an important fishing ground for chambo (Weyl, 1999; Bulirani et al.<br />
1999). This recommendation came about in order to restore chambo stocks to previous levels and increase<br />
production. The <strong>fisheries</strong> Conservation and Management Regulations 2000 prohibit ‘kauni for chambo’ thus<br />
catching chambo in <strong>the</strong> kauni fishery is illegal (Fisheries Management and Conservation Act, 2000).<br />
This paper is a result <strong>of</strong> a one-year study <strong>of</strong> <strong>the</strong> chilimira/kauni fishery in <strong>the</strong> sou<strong>the</strong>rn part <strong>of</strong> Lake Malawi. The<br />
objective <strong>of</strong> this study was to examine and compare <strong>the</strong> kauni <strong>fisheries</strong> in <strong>the</strong> south east arm (SEA) and south west<br />
arm (SWA) <strong>of</strong> Lake Malawi to determine <strong>the</strong> potential effects <strong>of</strong> <strong>the</strong>se <strong>fisheries</strong> on <strong>the</strong> fish stocks.<br />
Methodology<br />
Catch assessment <strong>of</strong> <strong>the</strong> kauni <strong>fisheries</strong> operating at Kela (SEA) and Msaka (SWA) landing sites were conducted<br />
once for three consecutive days a month for a one-year period. At <strong>the</strong>se landing sites, as many gears as possible<br />
were sampled. The weight <strong>of</strong> <strong>the</strong> entire catch was assessed and a sample was randomly selected and weighed. The<br />
species composition <strong>of</strong> <strong>the</strong> catches was assessed as each fish in <strong>the</strong> sample was sorted to species level. Each species<br />
group was weighed separately and each fish was measured for total length (TL) in millimetres.<br />
Results<br />
The kauni fishermen, landing at Kela, fish in Area A, south <strong>of</strong> Boadzulu Island, while those landing at Msaka<br />
usually fish close to Mumbo Island. It was observed that both <strong>the</strong> <strong>fisheries</strong> in <strong>the</strong> SWA and SEA are multi-species<br />
catching many different species, many <strong>of</strong> which were cichlids. The number <strong>of</strong> species recorded at Kela was 70 and
128<br />
Lake Malawi Fisheries Management Symposium - Proceedings<br />
at Msaka 65 (Table 1). The contribution <strong>of</strong> <strong>the</strong> different species in <strong>the</strong> fishery varied from month to month as well<br />
as by area.<br />
The fish species identified in <strong>the</strong> fishery were lumped in major species groups for species composition analysis.<br />
These major groups were Rhamphochromis spp. Oreochromis spp. Copadichromis spp. as well as usipa<br />
(Engraulicypris sardella) and ‘o<strong>the</strong>r’ group. The ‘o<strong>the</strong>r’ group consisted <strong>of</strong> all o<strong>the</strong>r species caught in <strong>the</strong> fishery<br />
that were not included in <strong>the</strong> major species groups.<br />
At Msaka <strong>the</strong> main contributing species groups were Rhamphochromis spp, usipa and Copadichromis spp.<br />
However, <strong>the</strong> contribution <strong>of</strong> <strong>the</strong>se various groups varied for <strong>the</strong> different months <strong>of</strong> <strong>the</strong> year. The ‘o<strong>the</strong>r’ group<br />
contributed significantly in November. There was no data collected in June, and in December <strong>the</strong>re was an anomaly<br />
in <strong>the</strong> data that lead to all <strong>the</strong> data in December being discarded (Figure 1). The Rhamphochromis spp group<br />
contributed 51% <strong>of</strong> <strong>the</strong> total catch followed by usipa, which contributed 25%. The ‘o<strong>the</strong>r’ group contributed 14%,<br />
Copadichromis spp. group contributed 10%, and chambo contributed only 0.5% <strong>of</strong> <strong>the</strong> total catch (Figure 2).<br />
In Kela <strong>the</strong> situation was different. The most important species groups were Rhamphochromis spp. and chambo<br />
followed by <strong>the</strong> ‘o<strong>the</strong>r’ group and <strong>the</strong> Copadichromis spp. group. These species groups contribution also varied<br />
each month (Figure 3). Rhamphochromis spp. contributed 37% <strong>of</strong> <strong>the</strong> total catch followed by chambo which<br />
contributed 34%. The ‘o<strong>the</strong>r’ group contributed 21%, Copadichromis spp. 5% and usipa only 3% to <strong>the</strong> total catch<br />
(Figure 4).<br />
Length frequency analyses were conducted for some <strong>of</strong> <strong>the</strong> most important species groups i.e. Oreochromis spp. and<br />
Rhamphochromis spp. For <strong>the</strong> Copadichromis spp. group, one <strong>of</strong> <strong>the</strong> species that contributed significantly from this<br />
group C. virginalis was used in <strong>the</strong> analysis. Selectivity analyses for <strong>the</strong> different species groups were conducted by<br />
combining all <strong>the</strong> individuals caught in <strong>the</strong> different mesh sizes (0.5 to 2 inch) in <strong>the</strong> fishery. This is due to <strong>the</strong> fact<br />
that analyses with <strong>the</strong> separate mesh sizes showed no significant difference in <strong>the</strong> sizes <strong>of</strong> individuals caught.<br />
100%<br />
80%<br />
60%<br />
40%<br />
20%<br />
0%<br />
Mar<br />
Apr<br />
May<br />
Jun<br />
Jul<br />
Figure 1. Monthly trends in catch composition (%) <strong>of</strong> Msaka kauni fishery.<br />
Aug<br />
Sep<br />
Oct<br />
Nov<br />
Dec<br />
Jan<br />
Feb<br />
O<strong>the</strong>r<br />
Rhamphochromis spp.<br />
Oreochromis spp.<br />
Usipa<br />
Copadichromis spp.
0.5%<br />
24.5%<br />
129<br />
Lake Malawi Fisheries Management Symposium - Proceedings<br />
Figure 2. Cumulative species composition by weight (%) <strong>of</strong> Msaka kauni fishery (2000 Mar–2001 Feb).<br />
100%<br />
80%<br />
60%<br />
40%<br />
20%<br />
0%<br />
Mar<br />
Figure 3: monthly trends in catch composition (%) <strong>of</strong> Kela kauni fishery.<br />
21%<br />
14%<br />
10%<br />
Apr<br />
May<br />
Jun<br />
Jul<br />
Aug<br />
Sep<br />
34% 5%<br />
3%<br />
Oct<br />
51%<br />
Nov<br />
37%<br />
Rhamphochromis spp<br />
Copadichromis spp<br />
Rhamphochromis spp<br />
Copadichromis spp<br />
Usipa<br />
Oreochromis spp<br />
Figure 4: cumulative species composition by weight (%) <strong>of</strong> Kela kauni fishery (2000 Mar–2001 Feb).<br />
Dec<br />
For <strong>the</strong> Oreochromis spp. group, <strong>the</strong> length frequency showed that <strong>the</strong> majority <strong>of</strong> individuals caught were bigger<br />
than 150 mm TL. Few juvenile chambo were caught in this fishery, 3 % <strong>of</strong> individuals were 150 mm or less in total<br />
length. This lack <strong>of</strong> juvenile chambo in <strong>the</strong> kauni fishery is not <strong>the</strong> result <strong>of</strong> <strong>the</strong> gear selecting for <strong>the</strong> adults but<br />
ra<strong>the</strong>r because fishing occurs in areas where <strong>the</strong> juveniles are not found being an open water fishery (juvenile<br />
chambo are found in shallow water closer to shore). The length at 50% maturity for chambo species is 203 mm total<br />
Jan<br />
Feb<br />
Usipa<br />
Oreochromis spp<br />
O<strong>the</strong>r<br />
O<strong>the</strong>r<br />
O<strong>the</strong>r<br />
Rhamphochromis spp.<br />
Oreochromis spp.<br />
Usipa<br />
Copadichromis spp.
130<br />
Lake Malawi Fisheries Management Symposium - Proceedings<br />
length (Palsson et al. 1999). In this fishery 50% selectivity was at 210 mm showing that mature adults are mostly<br />
caught.<br />
The length frequency for <strong>the</strong> Rhamphochromis spp. group showed that 97% <strong>of</strong> <strong>the</strong> individuals caught were 110 mm<br />
or bigger in total length. This group is very diverse with a length at maturity range <strong>of</strong> 109–232 mm standard length<br />
(Turner et al. 2000). This range reflects <strong>the</strong> fact that <strong>the</strong>re are different species with different lengths at maturity<br />
caught in this fishery. Many <strong>of</strong> <strong>the</strong> individuals caught belonged to <strong>the</strong> species R. longiceps and R. ferox which are<br />
on <strong>the</strong> lower side <strong>of</strong> <strong>the</strong> maturity range having lengths at maturity <strong>of</strong> 109-130 mm SL and 138 –143 mm SL<br />
respectively. In this fishery 50% selectivity was at 183 mm TL.<br />
The length frequency for C. virginalis, a major species in <strong>the</strong> Copadichromis spp. group showed that 89 % <strong>of</strong> <strong>the</strong><br />
individuals caught were 110 mm or bigger in total length. The length at maturity for this species is 106 mm TL<br />
(Marechal, 1991). Mean (50%) selectivity was at 128 mm indicating that mature adults are mainly caught in this<br />
fishery.<br />
Frequency<br />
500<br />
450<br />
400<br />
350<br />
300<br />
250<br />
200<br />
150<br />
100<br />
50<br />
0<br />
Figure 5. Length frequency for Oreochromis spp. sampled from <strong>the</strong> kauni fishery (n=3015).<br />
Frequency<br />
10<br />
1400<br />
1200<br />
1000<br />
800<br />
600<br />
400<br />
200<br />
0<br />
40<br />
10<br />
70<br />
50<br />
100<br />
90<br />
130<br />
130<br />
170<br />
Figure 6. Length frequency for Rhamphochromis spp. sampled from <strong>the</strong> kauni fishery (n=6943).<br />
160<br />
210<br />
190<br />
Length at maturity range<br />
109 mm-232 mm<br />
Mean selectivity 183 mm<br />
250<br />
220<br />
290<br />
TL (mm)<br />
250<br />
TL (mm)<br />
Length at 50%<br />
maturity 203mm<br />
Mean selectivity 210 mm<br />
330<br />
280<br />
370<br />
310<br />
410<br />
340<br />
450<br />
370<br />
490<br />
400<br />
430
Frequency<br />
140<br />
120<br />
100<br />
80<br />
60<br />
40<br />
20<br />
0<br />
5<br />
20<br />
Length at maturity<br />
106 mm<br />
35<br />
50<br />
131<br />
Lake Malawi Fisheries Management Symposium - Proceedings<br />
Figure 7. Length frequency for C. virginalis sampled from <strong>the</strong> kauni fishery (n=661).<br />
65<br />
80<br />
95<br />
TL (mm)<br />
Discussion<br />
In Kela and Msaka it was observed that <strong>the</strong> Rhamphochromis spp. group was very important, contributing 37% and<br />
51%, respectively. Usipa was more important in Msaka, were it contributed 25% to <strong>the</strong> catch, than at Kela were it<br />
only contributed 3% <strong>of</strong> <strong>the</strong> total catch. The Oreochromis spp. group was more important at Kela, were it<br />
contributed 34% <strong>of</strong> <strong>the</strong> total catch. At Msaka this group was <strong>of</strong> minor importance, contributing less than 1% to <strong>the</strong><br />
total catch <strong>of</strong> <strong>the</strong> kauni fishery.<br />
Due to <strong>the</strong> wide-ranging nature <strong>of</strong> <strong>the</strong> Rhamphochromis stocks, <strong>the</strong>y are not considered threatened by local<br />
overexploitation at <strong>the</strong> moment and are <strong>the</strong>refore not in need <strong>of</strong> any restrictions (Turner et al. 2000). The<br />
Copadichromis stocks do not form a huge component in <strong>the</strong> fishery (contributing 5% in Kela and 10% in Msaka)<br />
and <strong>the</strong> sizes <strong>of</strong> individuals harvested are <strong>of</strong> those that have reached adult size. For this reason, <strong>the</strong> Copadichromis<br />
stocks do not seem to be threatened by <strong>the</strong> kauni fishery. However, it should be kept in mind that o<strong>the</strong>r <strong>fisheries</strong><br />
also harvest this species group and <strong>the</strong>se should be closely monitored. For <strong>the</strong> usipa stocks, no <strong>management</strong><br />
recommendations can be given because <strong>the</strong> stock experiences large fluctuations that appear to be caused by<br />
environmental factors (Allison et al. 1995). However, due to <strong>the</strong> declining nature <strong>of</strong> <strong>the</strong> chambo fishery,<br />
Oreochromis spp. stocks need <strong>management</strong> intervention if <strong>the</strong> stocks are expected to recover.<br />
From an area point <strong>of</strong> view, none <strong>of</strong> <strong>the</strong> species groups dominating <strong>the</strong> kauni fishery at Msaka seem to be<br />
threatened, <strong>the</strong>refore restrictions at Msaka are not necessary. However for <strong>the</strong> chambo stocks at Kela, <strong>management</strong><br />
is necessary.<br />
The ban <strong>of</strong> ‘kauni for chambo’ in <strong>the</strong> Fisheries Conservation and Management Act (2000) has not been effective<br />
because <strong>the</strong> fishermen are still catching chambo. It appears unrealistic to inform <strong>the</strong> kauni fishermen to fish but not<br />
catch chambo and if chambo is caught in <strong>the</strong>ir gear, <strong>the</strong>y are unlikely to throw it back into <strong>the</strong> water. However it is<br />
not known whe<strong>the</strong>r <strong>the</strong>y specifically target chambo in <strong>the</strong>ir fishing procedure or not. A more realistic <strong>management</strong><br />
procedure would be to ban this fishery in a given area i.e. Area A as recommended by Bulirani et al. (1999) and<br />
Weyl (1999). Due to <strong>the</strong> use <strong>of</strong> lights in <strong>the</strong> fishery at night, it would be easy to monitor whe<strong>the</strong>r or not <strong>the</strong><br />
fishermen are following <strong>the</strong> regulations.<br />
From <strong>the</strong> length frequency analyses <strong>of</strong> <strong>the</strong> Oreochromis spp. group it was observed that <strong>the</strong> adult chambo are mainly<br />
being harvested in this fishery. The harvesting <strong>of</strong> immature chambo is not a concern in this fishery. However, since<br />
adult chambo are mainly caught, <strong>the</strong> stocks are still being depleted. Therefore, <strong>the</strong>re is a need to protect <strong>the</strong> adults<br />
until a recovery <strong>of</strong> <strong>the</strong> chambo stocks can be seen.<br />
With <strong>the</strong> aim <strong>of</strong> protecting <strong>the</strong> chambo stocks, <strong>the</strong> option <strong>of</strong> closing <strong>the</strong> kauni fishery and its consequences should be<br />
considered. With an annual estimated catch <strong>of</strong> 1500 tons (Catch statistics, 2000), <strong>the</strong> kauni fishery in Area A<br />
contributes approximately 40% to <strong>the</strong> total landings in <strong>the</strong> area. In addition, <strong>the</strong> closure <strong>of</strong> this fishery would result<br />
in a decreased yield <strong>of</strong> o<strong>the</strong>r major species groups such as Rhamphochromis spp. and Copadichromis spp. that are<br />
presently exploited in this fishery.<br />
110<br />
125<br />
140<br />
Mean selectivity 128 mm<br />
155<br />
170
132<br />
Lake Malawi Fisheries Management Symposium - Proceedings<br />
It has been reported that 40 to 60 boats land at Kela beach each day (Ganter et al.2001). Therefore over 400 people<br />
are directly involved in catching fish only at this beach. In Area A, <strong>the</strong>re are 119 chilimira gears which are all likely<br />
involved in kauni fishing and this means that in this fishery over 1 000 people in <strong>the</strong> area are directly involved in<br />
catching fish (Weyl et al. 2000). Closing down this fishery would lead to a high number <strong>of</strong> people losing<br />
employment. Options <strong>of</strong> limiting effort in this fishery to levels where enough adults are protected while some<br />
fishing continues, need to be explored.<br />
Acknowledgements<br />
Thanks to <strong>the</strong> technical assistants and o<strong>the</strong>r staff <strong>of</strong> <strong>the</strong> Fisheries research unit (FRU) who assisted in <strong>the</strong> collection<br />
<strong>of</strong> data. Thanks to Dr. Olaf Weyl who assisted in <strong>the</strong> data analysis. Special thanks to <strong>the</strong> National Aquatic<br />
Resource Management Programme (NARMAP) whom funded this study.<br />
References<br />
Allison, E.H., Patterson, G., Irvine, K., Thompson, A.B. and Menz, A. 1995. The pelagic ecosystem. In: The fishery potential<br />
and productivity <strong>of</strong> <strong>the</strong> pelagic zone <strong>of</strong> Lake Malawi/ Niassa. Menz, A. (ed). Chatham, UK: Natural Resources Institute<br />
Banda, M. 1996. (unpublished) A preliminary report on <strong>the</strong> kauni fishery. Unpublished report.<br />
Bulirani, A.E., Banda, M.C., Palsson, O.K., Weyl, O.L.F., Kanyerere, G.Z., Manase, M.M. & Sipawe, R.D. 1999. Fish stocks<br />
and <strong>fisheries</strong> <strong>of</strong> Malawian waters: Resource report. Government <strong>of</strong> Malawi, Fisheries Department, Fisheries Research<br />
Unit. 54pp.<br />
Catch statistics, 2000. Unpublished, Fisheries Research Unit, Monkey Bay.<br />
Fisheries Conservation and Management Regulations. 2000. The Malawi Gazette Supplement, 14 th July, 2000, containing<br />
Regulations, Rules, etc. Government Notice No. 32. Fisheries Conservation and Management Act, 1997 (No. 25 <strong>of</strong><br />
1997).<br />
Ganter, E. 2001. Socio economic survey No. 2. Kela village – summary <strong>of</strong> preliminary results. NARMAP &-Dept <strong>of</strong> Fisheries,<br />
Malawi. GTZ publication, March 2001.<br />
Marechal, C. 1991. Copadichromis. In: Check-list <strong>of</strong> <strong>the</strong> freshwater fishes <strong>of</strong> Africa (CLOFFA). J. Daget, J.P. Gosse, G.G.<br />
Teugels and D.F.E. Thys van den Audenaerde (Eds). ISNB, Brussels. Vol 4, p51-58.<br />
Palsson, O.K., Bulirani, A. and Banda, M. 1999. A review <strong>of</strong> <strong>the</strong> biology, <strong>fisheries</strong> and population dynamics <strong>of</strong> chambo<br />
(Oreochromis spp., CICHLIDAE) in Lakes Malawi and Malombe. Fisheries Bulletin No. 38.<br />
Turner, G.F., Carvalho, G.R., Robinson, R.L. and Shaw P.W. 2000. Biodiversity Conservation and sustainable utilisation <strong>of</strong><br />
pelagic cichlid fishes <strong>of</strong> Lake Malawi/Niassa/Nyasa. Ncheni Project Final report. University <strong>of</strong> Southampton & Hull,<br />
U.K.<br />
Weyl, O.L.F. 1999. Artisanal fishery catch-assessment for <strong>the</strong> south-east arm <strong>of</strong> <strong>lake</strong> Malawi; 1994-1998. NARMAP Technical<br />
Report No.2. 41pp.<br />
Weyl, O.L.F., Banda, M., Sodzapanja, G., Mwenekibombwe, L.H., namoto, W. and Mponda, O.C. 2000. Annual frame Survey,<br />
September 1999. Government <strong>of</strong> Malawi, Fisheries Bulletin No. 42.<br />
Weyl, O.L.F. and Banda, M.C. 2001. Notes on <strong>the</strong> chilimira net catch composition from catch and effort in Mangochi District.<br />
NARMAP Technical Report No. 5. 8 pp.
133<br />
Lake Malawi Fisheries Management Symposium - Proceedings<br />
Gear and species selectivity <strong>of</strong> <strong>the</strong> gill net fishery in Lake Malawi.<br />
Richard Dawson Sipawe<br />
Fisheries Research Unit, P.O. Box 27, Monkey Bay, Malawi.<br />
Abstract<br />
Size selectivity <strong>of</strong> some important fish species caught in gill nets was estimated indirectly. Species composition <strong>of</strong> <strong>the</strong> catches from<br />
gill nets with mesh sizes between 1 and 2 inches showed that <strong>the</strong> catch was dominated by C. virginalis (74%) and that chambo<br />
contributed less than 0.2% to <strong>the</strong> catch <strong>of</strong> <strong>the</strong>se small meshed gill nets. Chambo was not caught in <strong>the</strong>se meshes because <strong>the</strong> size<br />
range <strong>of</strong> chambo that could be susceptible to this gear inhabits shallow waters where small meshed nets are not set. The small<br />
meshed gill nets were considered ideal for catching <strong>of</strong>fshore cichlids. Gill nets with mesh sizes between 2 and 3 inches selected<br />
chambo at sizes corresponding with <strong>the</strong> size range at which this species migrates to deep water. Since this migration occurs before<br />
maturity <strong>the</strong> use <strong>of</strong> gill nets with mesh size 2-3 inches is not recommended. Gill nets with mesh sizes between 3 and 4 inches were<br />
considered ideal since <strong>the</strong>y select for mature chambo. However, <strong>the</strong> study showed that gill nets with <strong>the</strong> current mesh sizes in use<br />
do not catch mature catfish. For <strong>management</strong> purposes, development and adoption <strong>of</strong> distinct gill net <strong>fisheries</strong> for specific target<br />
species is suggested.<br />
Introduction<br />
The gill net is one <strong>of</strong> <strong>the</strong> most commonly used gears in Lake Malawi. Its use dates back to <strong>the</strong> early 1940s. Gill nets<br />
contribute between 15 and 20% to <strong>the</strong> total annual fish landings from Lake Malawi (Bulirani et al. 1999) and in<br />
terms <strong>of</strong> employment, this fishery engages about 13 600 fishers, representing 30-35% <strong>of</strong> people directly involved in<br />
<strong>the</strong> fishing industry both as gear owners as well as crew members (Weyl et al. 2000).<br />
The number <strong>of</strong> gill nets being operated on <strong>the</strong> <strong>lake</strong> has increased tremendously during <strong>the</strong> late 1990’s (Weyl et al.<br />
2000). In 1995 for example, <strong>the</strong>re were over 17 000 gill nets, <strong>the</strong> number grew to 24 000 in 1997 and in 1999 <strong>the</strong>re<br />
were approximately 30 000 gill nets (Weyl et al. 2000). In addition, recent frame survey showed that <strong>the</strong> majority<br />
<strong>of</strong> <strong>the</strong>se nets were under-meshed. For instance, 90% <strong>of</strong> gill nets recorded for Mangochi District were less than 3.0<br />
inches (Weyl et al. 2000) which was below <strong>the</strong> 3.75 inch legal mesh size for gill nets operated in <strong>the</strong> sou<strong>the</strong>ast and<br />
southwest arms <strong>of</strong> Lake Malawi.<br />
The increase in <strong>the</strong> number <strong>of</strong> gill nets in <strong>the</strong> late 1990s coupled with <strong>the</strong> use <strong>of</strong> under-meshed gill nets in Lake<br />
Malawi, initiated <strong>the</strong> execution <strong>of</strong> this project in-order to determine species composition and size selectivity <strong>of</strong> <strong>the</strong><br />
catches in gill nets <strong>of</strong> mesh sizes ranging from 1inch to 3.75 inches. This was done in order to assess potential<br />
impacts <strong>of</strong> small meshed nets on <strong>the</strong> fishery.<br />
Methods<br />
Sampling area<br />
Catches were sampled from local fishermen’s gill nets in <strong>the</strong> sou<strong>the</strong>ast arm <strong>of</strong> Lake Malawi. In particular, gill net<br />
samples were acquired from Makawa (Kela beach), Kadango, Nkope, Ng’ombe and Namiasi landing sites in <strong>the</strong><br />
sou<strong>the</strong>ast arm <strong>of</strong> Lake Malawi. Since gill net fishers are highly migratory, <strong>the</strong> sampling programme was designed in<br />
such a way as to target beaches where most gill-netters were landing at that time.<br />
Data collection and analysis<br />
Fish catches from <strong>the</strong> gill net fishery <strong>of</strong> <strong>the</strong> Sou<strong>the</strong>ast arm were sampled from 1inch to 3.75 inch mesh size gill nets<br />
on a monthly basis from October 1998 to December 2000. The fish were identified to species level, each species<br />
component in <strong>the</strong> catch was weighed and <strong>the</strong>n total length (TL) measurements were recorded to <strong>the</strong> nearest<br />
millimetre.<br />
Retention in gill nets occurs when a fish penetrates a mesh beyond its gill covers but does not completely penetrate<br />
through, this implies that a fish is caught if its head girth is smaller but its maximum girth is larger than <strong>the</strong> mesh<br />
perimeter (Hamley, 1975). Since <strong>the</strong>re is a relationship between girth and total length (Konda 1962, Burd 1963 and<br />
Kipling 1963), total length (TL) is used exclusively in this study.<br />
The selectivity curves were fitted using a re-parameterised gamma selectivity function as outlined in Punt et al.<br />
(1966). A typical gill net selectivity curve is bell-shaped falling to zero on both sides <strong>of</strong> a maximum (Hamley,<br />
1975). The gamma selection function was chosen because it easily describes all <strong>the</strong> members <strong>of</strong> <strong>the</strong> exponential<br />
family <strong>of</strong> distributions more precisely than <strong>the</strong> o<strong>the</strong>r functions (Manase, 2000).
Results and discussion<br />
134<br />
Lake Malawi Fisheries Management Symposium - Proceedings<br />
1-2 inch gill nets<br />
Figure 1 shows <strong>the</strong> percent catch composition <strong>of</strong> <strong>the</strong> 7 main fish species that contributed over 90 % <strong>of</strong> <strong>the</strong> catch in<br />
gill nets with mesh size between 1 to 2 inches. Table 1 shows <strong>the</strong> catch composition and total number <strong>of</strong> fish species<br />
caught in gill nets <strong>of</strong> various mesh sizes.<br />
In gill nets with mesh sizes between 1 and 2 inches, 120 different fish species were recorded. The majority <strong>of</strong> <strong>the</strong><br />
species caught in such nets were those that are naturally small in size. The only exception was that 6% and 0.2% <strong>of</strong><br />
Bagrus and chambo respectively (both comprising <strong>of</strong> juveniles only) were caught in <strong>the</strong>se nets.<br />
Percent catch contribution <strong>of</strong> main species in 1-2" nets<br />
Otopharynx<br />
2%<br />
Synodontis<br />
3%<br />
Letrinops<br />
4%<br />
Aulono<br />
2%<br />
Figure 1. Catch composition in 1-2inch gill nets.<br />
O<strong>the</strong>rs<br />
9%<br />
Bagrus<br />
6%<br />
Copadichromis<br />
74%<br />
Table 2 gives <strong>the</strong> mean lengths at capture, total length ranges as well as variances for fish caught in various mesh<br />
sizes and analysed using gamma distribution. The mean length at capture <strong>of</strong> chambo in 1.5inch nets was 11cm<br />
(figure 2) while <strong>the</strong> mean length at maturity for chambo is 20.3 cm (Bulirani et al. 1999). For <strong>the</strong> 1.5 inch gill nets<br />
chambo varied between 10 cm and 13 cm in total length.<br />
Table 3 gives <strong>the</strong> mean length-at-capture (lc) divided by length-at-maturity (lmat) (Lc/Lmat) values for species<br />
analysed with gamma function. When mean length-at-capture (Lc) was expressed as a proportion <strong>of</strong> <strong>the</strong> length-atmaturity<br />
(Lmat), it was found out that all chambo caught in gill nets <strong>of</strong> 1.5 inch mesh size were immature<br />
(Lc/Lmat≥1). However, chambo contributed only 0.2% <strong>of</strong> <strong>the</strong> total catch in gill nets <strong>of</strong> this particular mesh sizes.<br />
This is because small immature chambo inhabits very shallow waters (FAO, 1993) while <strong>the</strong>se nets are set in deep<br />
water where <strong>the</strong>y are set to target <strong>of</strong>fshore pelagic fish species especially as utaka.<br />
The length at first capture for C.virginalis in 1 and 1.75 inch gill nets was 13.3 and 12 cm respectively (Figure 3).<br />
These sizes are well above 10.6 cm, <strong>the</strong> length at maturity for C. virginalis (Marechal 1991). Though 74 % <strong>of</strong> <strong>the</strong><br />
catch consisted <strong>of</strong> C.virginalis, this stock seems not to be threatened because only mature individuals are being<br />
harvested. Since approximately 90% <strong>of</strong> <strong>the</strong> catch in gill nets with mesh sizes ranging between 1-2 inches comprise<br />
small fish species that mature before capture by this gear, such nets <strong>the</strong>refore may be used as harvesting strategy for<br />
utaka.
Figure 2. Chambo 1.5 inch mesh selection curve.<br />
% Proportion<br />
Oreochromis spp. 1.5" selectivity<br />
100<br />
80<br />
60<br />
40<br />
20<br />
% Proportion<br />
% Proportion<br />
0<br />
9 10 11 12 13 14<br />
Length (cm)<br />
Figure 3. C.virginalis selection curves for 1.0 inch and 1.75 inch gill nets.<br />
135<br />
Lake Malawi Fisheries Management Symposium - Proceedings<br />
Observed Predicted<br />
Copadichromis virginalis 1.0" selectivity<br />
100<br />
80<br />
60<br />
40<br />
20<br />
0<br />
100<br />
80<br />
11 12 13 14 15 16<br />
Length (cm)<br />
Observed Predicted<br />
Copadichromis virginalis 1.75"<br />
selectivity<br />
60<br />
40<br />
20<br />
0<br />
7 9 11 13 15<br />
Length (cm)<br />
Observed Predicted
136<br />
Lake Malawi Fisheries Management Symposium - Proceedings<br />
Table 1. Percent catch composition in gill nets <strong>of</strong> mesh size 1-2 inch (25-50mm), 2-3 inch (51-75 mm)<br />
and 3-4 inch (76-95mm) sampled between October 1998 and December 1999 in <strong>the</strong> sou<strong>the</strong>ast arm <strong>of</strong><br />
Lake Malawi. (n= 422 kg for 1-2 inch nets; n = 23kg for 2-3 inch nets and n = 1 107 kg for 3- 4 inch nets).<br />
* Species for which Gamma analysis was done.<br />
Species 1-2 in. 2-3 in. 3-4 Species 1-2 in. 2-3 in. 3-4 in. Species 1-2 in. 2-3 in. 3-4 in. Species 1-2<br />
in.<br />
in.<br />
Alticorpus Coreematodus Maravichromis Rhamphochromis*<br />
A. ge<strong>of</strong>freyi 0.07 C. shiranus 0.01 M. ericotaenia 0.03 0.01 R. spp_ 0.26<br />
A. macrocleithrum 0.05 C. taeniatus 0.04 M. anaphyrmus 0.43 1.08 0.27 Sciaenochromis<br />
A. mentale 0.13 Ctenopharynx M. formossus 0.06 S. benthicola 0.09 0.04<br />
Aulonocara C. intermedius 0.86 0.03 Mormyrus S. gracilis 0.19 0.03<br />
A. copper 0.14 Dimidiochromis M. deliciosis 0.87 S. spilostichus 0.13 0.18<br />
A. spp_ 0.01 D. compreceps 0.00 Mylochromis Stigmatochromis<br />
A. blue orange 0.08 D. dimidiatus 0.01 M. mola 0.00 0.11 S. pholidophorus 0.01<br />
A. brevirostris 0.01 D. kiwinge 0.03 0.43 0.07 M. spilotichus 0.01 S. woodi 0.11 0.00<br />
A. guen<strong>the</strong>ri 0.15 0.36 D.strigatus 0.05 Nimbochromis Synodontis<br />
A. macrochir* 0.81 0.09 Diplotaxodon N. livingstonii 0.50 S. njassae* 3.27 0.89<br />
A. rostratum 0.30 0.95 D. argenteus 0.23 0.02 N. polystigma 0.07 Taeniaochromis<br />
A.yellow 0.06 D. greenwoodi 0.07 N. venustus 0.06 0.35 T. spp_ 0.02<br />
Bargrus D.intermedius 0.01 Nyassachromis T. holotaenia 0.16<br />
B. meridionalis* 5.35 3.12 9.83 D.limnothrissa 0.08 N. leuciscus* 15.16 Taeniolethrinops<br />
Barbus Fossochromis Opsaridium T.furcicauda 0.59 1.25 0.02<br />
B. arcislongae 0.94 F. rostratus 0.13 0.02 O. microcephalus* 0.04 T. laticeps 0.01<br />
B. eurystomus* 1.80 Haplochromis O. microlepis 0.10 T.praeorbitalis* 0.03<br />
B. Johnstoni* 3.50 H. spilopterus 0.01 Oreochromis Tramitichromis<br />
B. litamba 0.32 0.15 Hemitaeniochromis O. shiranus 0.03 0.35 0.02 T.lituris* 0.43<br />
Bathyclarias H. discorhynchus 0.42 0.62 0.00 O. spp*_ 0.14 22.83 68.20 T. spp_ 0.06<br />
Bathyclarias spp* 7.40 H. insignis 0.01 0.12 Otopharynx Trematocranus<br />
Brycinus H. urotaenia 0.28 0.52 0.02 O. argyrosoma* 1.40 T. labifer 0.65<br />
B. imberi 0.04 Hemitilapia O. auromarginatus 0.06 0.48 T. labifer 0.65<br />
Buccuchromis H. oxyrhynchus 0.00 O. cf_ productus 0.06 T. labifer 0.65<br />
B. atritaeniatus 0.35 Labeo O. speciosus 0.25 T. placodon* 5.18 0.28<br />
B. lepturus* 0.55 L. cylindricus 0.01 3.12 O. spp_ 0.00 Tyrannochromis<br />
B. nototaenia 0.01 0.62 Lethrinops Placidochromis T. macrostoma* 0.08<br />
B. rhoadesi 0.06 0.03 L. alba 0.12 0.00 P. acuticeps 0.02<br />
B. spp. 0.49 L. alta* 0.18 P. long 0.00<br />
Champsochromis 0.03 L. christyi 0.50 0.36 P. longimanus 0.04<br />
C. spilorhynchus 0.03 L. gossei* 0.02 P. macrognathus 0.01<br />
Chilotilapia 0.05 0.15 L.lethrinus 0.14 2.31 0.02 P. subocularis 1.09 0.78 0.09<br />
C. rhoadesii 0.05 0.15 L.long 0.08 Platygnathochromis<br />
Clarias L.longimanus 0.64 P.kirkii 0.04 0.26<br />
C. gariepinus 0.51 16.45 1.23 L. longipinnis 0.16 0.14 Protomelas labridens 0.07<br />
Copadichromis L.macracanthus 0.01 P.similes 0.07 0.69 0.03<br />
C. chrysonotus 0.02 0.09 0.00 L. macrochir 0.22 0.01 P. spilopterus 0.01<br />
C. eucinostomus* 0.22 L. matumbai 0.05 P. triaenodon 0.00<br />
C. inornatus 0.00 L.mylodon 0.00 Pseudotropheus<br />
C. pleurostigma 0.03 L.parvidens* 0.42 0.00 P. elegans 0.11 0.13<br />
C. prostoma 0.00 L. pink head* 0.41 P. livingstonii 0.07<br />
C. quadrimaculatus* 2.03 L. polli 0.18 0.03 P.tropheops 0.04<br />
C. trimaculatus 0.00 L. stridei 0.28 P. williamsonii 0.19<br />
C. virginalis* 67.90 14.73 Lichnochromis<br />
L. acuticeps 0.11 0.26<br />
2-3<br />
in.<br />
3-4<br />
in.
137<br />
Lake Malawi Fisheries Management Symposium - Proceedings<br />
Table 2. Mean retention lengths (maximum selectivity), total length (TL) ranges and variances for fish<br />
caught in various mesh sizes and analysed using gamma distribution.<br />
Species/Species group (n) Mesh size Max. Sel. Range TL (cm) Variance<br />
Oreochromis spp. 48 1.5 11.00 8.5-13.5 0.79<br />
95 2.0 13.94 11.0-17.0 0.96<br />
398 3.0 24.05 17.0-35.0 3.17<br />
2101 3.5 24.24 17.0-35.0 2.51<br />
135 3.75 25.30 18.0-35.0 2.28<br />
Copadichromis virginalis 36 1.0 13.30 11.0-16.0 0.98<br />
393 1.25 12.07 10.0-16.0 0.73<br />
1814 1.5 12.48 10.2-15.0 0.96<br />
209 1.75 12.08 10.5-16.0 0.96<br />
113 2.5 12.38 10.0-15.0 0.85<br />
Bagrus meridionalis 71 1.5 22.74 18.0-32.0 2.54<br />
136 3.0 34.77 36.0-50.0 3.53<br />
114 3.5 37.54 28.0-50.0 3.10<br />
83 3.75 37.66 30.0-50.0 3.30<br />
Otopharynx argyrosoma 69 1.25 10.09 8.0-12.0 0.66<br />
135 1.5 10.63 7.0-17.0 1.74<br />
Rhamphochromis spp. 131 3.5 38.28 36.0-47.0 1.80<br />
102 3.75 38.76 37.0-47.0 1.64<br />
Synodontis njassae 239 1.5 13.39 11.0-20.0 1.45<br />
35 2.0 13.58 11.0-19.0 1.19<br />
C. quadrimaculatus 123 2.0 16.64 13.0-21.0 1.33<br />
47 3.0 16.95 13.0-21.0 1.30<br />
Bathyclarias spp. 69 3.5 49.98 41.0-62.0 3.02<br />
79 3.75 49.45 40.0-62.0 3.19<br />
Lethrinops pinkhead 43 1.25 9.62 7.50-12.0 0.78<br />
48 1.5 10.10 8.00-14.0 0.93<br />
Trematocranus placodon 81 3.0 19.57 16.0-24.0 1.18<br />
31 3.5 20.51 18.0-24.0 0.95<br />
Barbus johnstoni 62 3.5 34.00 10.0-38.0 2.23<br />
Barbus eurystomus 39 3.75 38.00 33.0-44.0 2.72<br />
Opsaridium microcephalus 36 3.5 47.00 44.0-50.0 0.91<br />
Tyrannochromis macrostoma 52 3.5 20.00 18.0-23.0 1.11<br />
Nyasachromis leuciscus 51 2.5 17.00 14.0-20.0 0.82<br />
Tramitichromis lituris 34 1.5 11.00 8.50-14.5 1.28<br />
Taeniolethrinops praeorbitalis 76 3.0 23.00 21.0-26.0 1.07<br />
Lethrinops parvidens 34 1.5 12.00 10.0-14.0 1.50<br />
Lethrinops longimanus 81 2.5 17.00 14.0-22.0 1.31<br />
Lehrinops gossae 43 2.5 16.50 14.0-20.0 0.93<br />
Lethrinops alta 33 1.5 10.80 9.0-14.0 0.80<br />
Copadichromis eucinostomus 38 2.0 11.30 9.0-13.0 0.74<br />
Buccochromis lepturus 52 3.5 26.04 23.0-30.0 1.35<br />
Aulonocar macrochir 33 2.0 11.70 10.0-14.0 0.70
138<br />
Lake Malawi Fisheries Management Symposium - Proceedings<br />
2-3 inch mesh gill nets<br />
Figure 2 shows <strong>the</strong> percentage catch composition <strong>of</strong> <strong>the</strong> 7 main species that contributed almost 90% <strong>of</strong> <strong>the</strong> total<br />
catch in gill nets with mesh sizes between 2 to 3 inches.<br />
In gill nets with mesh sizes ranging between 2-3 inches, 99 fish species were recorded. Chambo dominated <strong>the</strong><br />
catch; it comprised 25% <strong>of</strong> <strong>the</strong> catch by weight. The importance <strong>of</strong> small fish species in <strong>the</strong> catch started to decrease<br />
because <strong>the</strong>se meshes selected for slightly larger fish species.<br />
% catch ontribution <strong>of</strong> main species in 2-3"<br />
gill nets<br />
Trematocranus<br />
6%<br />
Oreochromis<br />
25%<br />
Figure 4. Catch composition <strong>of</strong> main species in 2-3 inch gill nets<br />
The mean length at capture for chambo in <strong>the</strong>se nets was 14 cm and <strong>the</strong> largest chambo caught was around 17 cm<br />
(figure 5). Therefore, chambo caught in <strong>the</strong>se gill nets, were immature. The vulnerability <strong>of</strong> <strong>the</strong> chambo caught in<br />
gill nets <strong>of</strong> 2-3 inch mesh sizes increases due to its migratory behaviour, since at this size <strong>the</strong> chambo moves from<br />
shallow to <strong>the</strong> deep water where it meets <strong>the</strong> nets.<br />
Oreochromis spp. 2.0" selectivity<br />
100<br />
Figure 5. Chambo 2.0 inch gill net selectivity curve.<br />
% Proportion<br />
50<br />
0<br />
O<strong>the</strong>rs<br />
14%<br />
Bagrus<br />
3%<br />
Nyassachromis<br />
16%<br />
11 12 13 14 15 16 17 18 19 20 21<br />
Length (cm)<br />
Observed Predicted<br />
Clarias<br />
17%<br />
Labeo<br />
3%<br />
Copadichromis<br />
16%
139<br />
Lake Malawi Fisheries Management Symposium - Proceedings<br />
Table 3. Mean length-at-capture (lc) expressed as a proportion <strong>of</strong> <strong>the</strong> length-at maturity (Lmat) for <strong>the</strong> main<br />
target species analysed with gamma function. Adapted from Weyl et al. 2000.<br />
Species Lmat Mesh size in inches for sampled species<br />
1.0 1.25 1.5 1.75 2 2.5 3 3.5 3.75<br />
Aulonocar macrochir 13.5 cm* 0.9<br />
Buccochromis lepturus 31.5 cm 2 0.83<br />
Copadichromis eucinostomus 10 cm* 1.1<br />
Copadichromis quadrimaculatus 17.7 cm 2 0.9 0.96<br />
Copadichromis virginalis 10.6 cm 2 1.25 1.14 1.18 1.14 1.2<br />
Lethrinops alta 11.25 cm* 1.23<br />
Lethrinops gossie 14.7 cm* 1.12<br />
Lethrinops longimanus 15.9 cm* 1.14<br />
Lethrinops parvidens 15.3 cm* 0.71<br />
Lethrinops pinkhead 9.0 cm* 1.07 1.12<br />
Nyasachromis leuciscus 12.0 cm 2 1.9<br />
Oreochromis spp. 20.3 cm 1 0.5 0.7 1.18 1.19 1.25<br />
Otopharynx argyrosoma 11.4 cm 2 0.89 0.93<br />
Rhamphochromis spp. 28.71 cm* 1.33 1.35<br />
Taeniolethrinops praeorbitalis 22.5 cm* 1.05<br />
Tramitichromis lituris 13.5 cm* 0.87<br />
Trematocranus placodon 18.8 cm 2 1.04 1.09<br />
Tyrannochromis macrostoma 18.1 cm* 1.11<br />
Barbus eurystomus 30.0 cm 2 1.18 1.19<br />
Barbus johnstoni 30.4 cm 2 1.15 1.15<br />
Opsaridium microcephalus 35.6 cm* 0.94<br />
Lc/Lmat<br />
Bagrus meridionalis 52.2 cm 1 0.43 0.66 0.72 0.72<br />
Bathyclarias spp. 60.0 cm 1 0.83 0.82<br />
Synodontis njassae 10.0 cm 1 1.34 1.4<br />
Lmat was derived from * estimated at 75% <strong>of</strong> <strong>the</strong> maximum length for species given in Turner 1996,<br />
1- Bulirani et al. 1999, 2- Weyl 2000.<br />
3-4 inch mesh gill nets<br />
Figure 6 shows <strong>the</strong> percent catch composition <strong>of</strong> <strong>the</strong> 5 main species that contributed 95% <strong>of</strong> <strong>the</strong> total catch by<br />
weight in gill nets with mesh sizes between 3 to 4 inches. In all, 70 fish species were recorded from this category <strong>of</strong><br />
nets (Table 3). Chambo comprised 70% <strong>of</strong> <strong>the</strong> total catch in <strong>the</strong>se gill nets and for <strong>the</strong> 3.5 inch gill nets, <strong>the</strong> mean<br />
length at capture for chambo was 24.5 cm, 2.2 cm longer than <strong>the</strong> length at maturity. Therefore, gill nets with mesh<br />
sizes between 3-4 inches catch mature chambo.<br />
The mean length at capture for B. meridionalis in 3.5 inch gill nets was 37.5 cm while <strong>the</strong> length at maturity is 52.2<br />
cm (Bulirani et al. 1999). This showed that <strong>the</strong> length at first capture was less than <strong>the</strong> length at maturity.<br />
The mean length at capture for Bathyclarias spp. in 3.5 inches was 49.5 cm while <strong>the</strong> length at maturity is 60.0 cm.<br />
This means that individuals caught in this mesh size were immature. The range <strong>of</strong> capture for both Bagrus<br />
meridionalis and Bathyclarias spp. was very wide and individuals were caught outside <strong>the</strong> selection curve in both<br />
cases reflecting <strong>the</strong> fact that two methods <strong>of</strong> capture were involved (Hamley, 1975). These were entanglement and<br />
wedging. Catfish are vulnerable to entanglement because <strong>the</strong>y have dorsal and pectoral spines.
% catch Contribution <strong>of</strong> main species in 3-4" nets<br />
O<strong>the</strong>rs<br />
4%<br />
Oreochromis<br />
70%<br />
Figure 6. Catch composition <strong>of</strong> main species in 3-4 inch gill net.<br />
Figure 7. Selection curve for chambo in 3.5 inch gill nets<br />
Figure 8. Bagrus meridionalis 3.5 inch gill net selection curve.<br />
% Proportion<br />
% Proportion<br />
140<br />
Lake Malawi Fisheries Management Symposium - Proceedings<br />
Bagrus<br />
10%<br />
O r eochr om i s spp. 3.5" selectivity<br />
100<br />
80<br />
60<br />
40<br />
20<br />
Barbus<br />
6%<br />
0<br />
14 18 22 26 30 34 38<br />
Length (cm)<br />
100<br />
80<br />
60<br />
40<br />
20<br />
Observed Predicted<br />
Bathyclarius.<br />
8%<br />
Buccochromis.<br />
2%<br />
Bagrus meridionalis 3.5" selectivity<br />
0<br />
23 27 31 35 39 43 47 51 55<br />
Length (cm)<br />
Observed Predicted
% Proportion<br />
100<br />
Figure 9. Bathyclarias spp. 3.5 inch selection curve.<br />
80<br />
60<br />
40<br />
20<br />
Bathyclarias spp. 3.5" selectivity<br />
0<br />
34 38 42 46 50 54 58 62 66<br />
Length (cm)<br />
Observed Predicted<br />
141<br />
Lake Malawi Fisheries Management Symposium - Proceedings<br />
Conclusion.<br />
Gill nets with mesh sizes between 1-2 inches have <strong>the</strong> potential to catch immature chambo. However, <strong>the</strong>y do not as<br />
small chambo inhabit very shallow waters <strong>of</strong> less than 5 metres (FAO, 1993) while <strong>the</strong> nets are set in water deeper<br />
than 40 metres where <strong>the</strong>y are set to target small <strong>of</strong>fshore cichlids especially utaka.<br />
Gill nets with mesh sizes between 2-3 inches catch immature chambo normally <strong>of</strong> less than 17 cm TL that migrate<br />
from <strong>the</strong> shallow into <strong>the</strong> deep waters. Gill nets with mesh sizes between 3-3.75 inches catch mature chambo. Gill<br />
nets with mesh size <strong>of</strong> 3.75 inches and less, that are currently in use, catch immature catfish. Any mature catfish<br />
caught in <strong>the</strong>se nets do so by being entangled.<br />
Therefore, we recommend <strong>the</strong> development <strong>of</strong> distinct gill net <strong>fisheries</strong> for specific target species. This may be<br />
achieved by identifying <strong>the</strong> most important fishing grounds or areas in <strong>the</strong> <strong>lake</strong> and <strong>the</strong>n by adopting and promoting<br />
<strong>the</strong> best harvesting strategy for each target species. We also discourage <strong>the</strong> use <strong>of</strong> 2-3 inch gill nets as <strong>the</strong>se catch<br />
immature chambo in deep waters.<br />
Acknowledgements<br />
Funding for this study mostly came from <strong>the</strong> European Union (EU) and <strong>the</strong> Department <strong>of</strong> Fisheries’ Fisheries<br />
Research Fund (FRF). Some additional data came from <strong>the</strong> gear selectivity surveys sponsored by <strong>the</strong> GTZ supported<br />
National Resource Management Programme (Narmap). Special thanks are due to Dr. Olaf Weyl, <strong>the</strong> Narmap<br />
Research Advisor and Dr. M. Banda <strong>the</strong> <strong>of</strong>ficer-in-charge for Fisheries Research station.<br />
References.<br />
Bulirani, A.E., Banda. M.C., Palsson, O.K., Weyl, O.L.F., Kanyerere, G.Z., Manase. M.M., Sipawe, R.D., 1999. Fish and<br />
Fisheries <strong>of</strong> Malawian waters: Resource report. Government <strong>of</strong> Malawi, Fisheries Research Unit.<br />
Burd, A. C., 1963. On selection by <strong>the</strong> drifter fleets in East Anglia herring fishery. J. Cons. Int. Explor. Mer 28: 91-120.<br />
Hamley, J. M., 1975. Review <strong>of</strong> gillnet selectivity. J. Fish. Res. Board can. 32: 1943-1969.<br />
FAO, Fisheries <strong>management</strong> in <strong>the</strong> South-east arm <strong>of</strong> Lake Malawi, upper Shire River and Lake Malombe, with particular<br />
reference to <strong>the</strong> <strong>fisheries</strong> on chambo (Oreochromis spp). CIFA Technical Paper. No. 21. Rome, FAO 1993. 113p.<br />
Konda, M., 1962. The relation between <strong>the</strong> size <strong>of</strong> <strong>the</strong> mesh <strong>of</strong> salmon gill net and <strong>the</strong> length <strong>of</strong> salmons in <strong>the</strong> catches. (in<br />
Japanese with English summary) Bull. Hokkaido Reg. Res. Lab. 24: 138-147.<br />
Kipling, C., 1957. The effects <strong>of</strong> gillnet selection on <strong>the</strong> estimation <strong>of</strong> weight-length relationship. J. Cons. Int. Expor. Mer. 23:<br />
51-63.<br />
Manase, M. M., 2000. Traditional Gear Selectivity in Sou<strong>the</strong>ast arm <strong>of</strong> Lake Malawi. GTZ-NARMAP Tech. Rep. No. 4.<br />
Marechal, C. 1991. Copadichromis. In <strong>the</strong> check-list <strong>of</strong> <strong>the</strong> freshwater fishes <strong>of</strong> Africa (CLOFFA). I Daget, J. –P. Gosse, G. G.<br />
Teugels and D> F. E. Thys van den Audenaerde (eds.). ISNB, Brussels, MRAC, Tervuren; and ORSTUM, Paris. Vol.<br />
4: 51-58.<br />
Weyl, O.F.L., Banda, M.C., Sodzapanja, G. Mwenekiombwe, L.H., Namoto, W. and Mponda, O.C., 1999. Annual Frame survey.<br />
Malawi Government. Fisheries Bulletin No. 42.
142<br />
Lake Malawi Fisheries Management Symposium - Proceedings<br />
Fisheries activities in nor<strong>the</strong>rn Lake Nyasa (Kyela District)<br />
John A. Mwambungu<br />
Tanzania Fisheries Research Institute, Kyela Centre, P.O. Box 98, Kyela-Tanzania<br />
Abstract<br />
When compared with <strong>the</strong> o<strong>the</strong>r East African Great <strong>lake</strong>s, <strong>the</strong> <strong>fisheries</strong> activities <strong>of</strong> Lake Nyasa are very low. This might be due to<br />
poor fishing vessels and gears used by <strong>the</strong> artisanal fishermen and <strong>the</strong> ultra-Oligotrophic nature <strong>of</strong> <strong>the</strong> <strong>lake</strong>. The present paper<br />
looks at <strong>the</strong> <strong>fisheries</strong> potential <strong>of</strong> Lake Nyasa in Kyela district and suggests strategies for development.<br />
Introduction<br />
Lake Nyasa lies at <strong>the</strong> Sou<strong>the</strong>rn end <strong>of</strong> <strong>the</strong> East African rift valley. The <strong>lake</strong> is long and narrow. It is 560 km long<br />
and has a surface area <strong>of</strong> 30 800 km² ranking ninth in order <strong>of</strong> size among <strong>the</strong> <strong>lake</strong>s <strong>of</strong> <strong>the</strong> world. On a south, north<br />
transect, <strong>the</strong> <strong>lake</strong> shows a remarkable increase in depth, with <strong>the</strong> north being deeper and <strong>the</strong> south shallower. It is<br />
one <strong>of</strong> <strong>the</strong> deepest <strong>lake</strong>s in <strong>the</strong> World with an average depth <strong>of</strong> 275 m ranging from 200 m to 700 m (Ngatunga et al.<br />
1997). The <strong>lake</strong> is shared by three riparian states Malawi, Mozambique and Tanzania (Figure 1).<br />
Malawi<br />
Kyela<br />
Itungi port Matema<br />
Nkanda<br />
Figure 1. Lake Nyasa (Tanzania side).<br />
Ludewa<br />
Lupingu<br />
Manda<br />
TANZANIA<br />
Mbinga<br />
Mbamba-bay<br />
MOZAMBIQUE<br />
An area <strong>of</strong> 5 569 km², which is about 18% <strong>of</strong> <strong>the</strong> <strong>lake</strong> in <strong>the</strong> north, is within Tanzania jurisdiction. Three<br />
administrative regions namely Ruvuma, Iringa and Mbeya share <strong>the</strong> <strong>lake</strong>. Kyela district, which is a focus <strong>of</strong> <strong>the</strong><br />
present paper, falls within Mbeya Region<br />
In Tanzania <strong>the</strong> shoreline <strong>of</strong> <strong>the</strong> <strong>lake</strong> is 258 km long, and has three main ecological zones: First is <strong>the</strong> rocky shore <strong>of</strong><br />
<strong>the</strong> north east shoreline which is characterised by deep slopes from <strong>the</strong> Livingstone mountains. The mountains<br />
which reads high as 3 000 m in <strong>the</strong> north extend along <strong>the</strong> <strong>lake</strong> shore from Matema to Manda, curve in land<br />
eastwards and reappear after Ndumbi, where <strong>the</strong>y become lower and less steep. In <strong>the</strong> sou<strong>the</strong>rn part <strong>of</strong> <strong>the</strong> range <strong>the</strong><br />
shore is characterised by reefs, inshore rocks and small uninhabited islands; second is <strong>the</strong> wide sandy beaches which<br />
occur in few areas such as Matema, Lupingu, Manda, Njambe, Liuli and Mbamba-bay. Third are <strong>the</strong> river estuaries<br />
associated with swampy areas covered with reeds. They are found in two areas: Wissman Bay from Songwe river on<br />
<strong>the</strong> Malawi border to Matema were four rivers flow into <strong>the</strong> <strong>lake</strong> (Songwe, Kiwira, Mbaka and Lufilyo) and in<br />
Amelia Bay, around <strong>the</strong> Ruhuhu delta which covers an area <strong>of</strong> 400 km² (Ng’ang’a 1993) from Manda to Ndumbi<br />
Reef. The shoreline in <strong>the</strong>se areas is characterised by sand and mud <strong>the</strong> water is predominantly muddy.<br />
The <strong>lake</strong> is <strong>of</strong> enormous importance to Tanzania as a means <strong>of</strong> transport, reservoir <strong>of</strong> fresh water and a source <strong>of</strong><br />
food (i.e. fish). Characteristics <strong>of</strong> <strong>the</strong> shoreline are very important in understanding <strong>the</strong> distribution <strong>of</strong> <strong>the</strong> fishes and
143<br />
Lake Malawi Fisheries Management Symposium - Proceedings<br />
hence <strong>the</strong> <strong>fisheries</strong> <strong>of</strong> Lake Nyasa in <strong>the</strong> Tanzania waters. Fishing activity is mainly artisanal, using traditional crafts<br />
and gear. However, <strong>the</strong> <strong>lake</strong> is characterised by very rough wea<strong>the</strong>r conditions, which make <strong>the</strong> traditional fishing<br />
with canoes a very dangerous venture. Moreover, because <strong>of</strong> <strong>the</strong> depth, nutrient levels available to phytoplankton are<br />
generally very low and based on nutrient; <strong>the</strong> <strong>lake</strong> is considered Oligotrophic (nutrient poor). An exception to <strong>the</strong><br />
above is <strong>the</strong> shallow south and around river mouths, areas which are considered to be highly productive. The present<br />
work tries to evaluate <strong>the</strong> fish resource potential <strong>of</strong> Lake Nyasa in Kyela district and suggests strategies for<br />
development.<br />
Fish Exploitation<br />
The capture <strong>fisheries</strong> <strong>of</strong> Kyela are divided into two main sectors namely food and Ornamental <strong>fisheries</strong>. The latter is<br />
useful to <strong>the</strong> nation as a source <strong>of</strong> foreign money, however <strong>the</strong> food capture is <strong>the</strong> most important sector constituting<br />
a major source <strong>of</strong> income and protein for coastal population.<br />
Fishing on <strong>the</strong> Tanzania side is under developed and has received very little attention. The common fishing vessel is<br />
<strong>the</strong> dugout canoes (3-4 m length). The canoes are small, unstable and propelled by paddles; one or two fishermen<br />
normally operate <strong>the</strong>m. The fishery is mainly restricted to inshore waters within 2 km <strong>of</strong> <strong>the</strong> shoreline.<br />
The principal fishing gears are gillnets, seines, hook and lines scoopnets and traps. In Kyela, <strong>the</strong> anadromous<br />
piscivorous cyprinids Opsaridium microlepis and O.microcephalus are <strong>of</strong> great importance. Several major affluent<br />
rivers (Songwe, Kiwira, Mbaka and Lufilyo) provide suitable habitats for spawning. Fisheries around and in <strong>the</strong><br />
river mouths have long been intensive whereby gillnets and sometimes seines are used to exploit <strong>the</strong>se cyprinids and<br />
o<strong>the</strong>r species during spawning period. This type <strong>of</strong> fishery makes <strong>the</strong> anadromous species more vulnerable to over<br />
fishing leading to destruction <strong>of</strong> stocks.<br />
Gillnets <strong>of</strong> stretched mesh size <strong>of</strong> 2 inch are used for catching cichlids (haplochromine and tilapine sp.), 2½ inch-<br />
3½ inch for bigger tilapine sp. and Opsaridium microcephalus, 3½-6 inch used for catching bigger fish species<br />
(Opsaridum microlepis, clarias sp. and Bathyclarias sp.).<br />
With <strong>the</strong> introduction <strong>of</strong> open water seine nets from Malawi, artisanal fishing units have been concentrated at Itungi,<br />
Mwaya, and Matema, (Wissman Bay). The open water seine known as ndaturu which is similar to <strong>the</strong> chilimira nets<br />
<strong>of</strong> Malawi, use light to attract Engraulicypris sardella (usipa) and small Rhamphochromis sp(Ngelwa) during<br />
moonless nights. During <strong>the</strong> day <strong>the</strong> gears are used to catch Diplotaxodon sp. (mantura) and Copadichromis sp.<br />
(vituwi) from deep inshore waters, and Tilapiine cichlids (magege) in <strong>the</strong> shallow waters <strong>of</strong> <strong>the</strong> Bay.<br />
Handline is commonly operated by most <strong>of</strong> <strong>the</strong> fishermen for catching tilapine species while bottom-set longlines<br />
are used for catching bigger demersal species (Clarias and Bagrus sp.).<br />
Recently fishermen in Kyela district have adopted drifting pelagic longlines after successful demonstrations to<br />
fishing communities <strong>of</strong> Itungi, Mwaya and Matema by TAFIRI. The gear target for large predatory fish such as<br />
large Rhamphochromis sp. (lumbulu/hangu) and Bathyclarias sp. (Ngoshora). The relationship between fish<br />
production and different components <strong>of</strong> artisanal fishery in Kyela district between 1990 and 1996 is shown in Figure<br />
2. The yield has fluctuated between 1 664.7 tons and 2 142.7 tons. Production is observed to drop from 1 428.5 tons<br />
in 1991 to 264.2 tons in 1992 and increased abruptly in 1992 to 1 423.1 tons. Canoes decreased from 295 in 1990 to<br />
205 in 1992 and increased from 312 in 1993 to 374 canoes in 1996 while fishermen decrease from 682 in 1990 to<br />
412 in 1992 and initially increased from 542 in 1993 to 709 in 1996.<br />
Catch composition <strong>of</strong> fish landed at beaches <strong>of</strong> Kyela district in 1996 is summarised in Figure 3. Catch was<br />
dominated by Engraulicypris sadella registering 28% followed by Rhamphochromis sp. (18%), Tilapines (17%),<br />
O<strong>the</strong>rs (15%) and Haplochromines (11). Bagrus meridionalis and Clarias sp. each contributed 4% while<br />
Opsaridium sp. and Labeo sp. contributed 2% and 1% respectively. Barbus species contribution was less than I% to<br />
<strong>the</strong> total catch.
Catch (tonnes)& Fishing effort<br />
2500<br />
2000<br />
1500<br />
1000<br />
500<br />
0<br />
1990 1991 1992 1993 1994 1995 1996<br />
144<br />
Lake Malawi Fisheries Management Symposium - Proceedings<br />
Figure 2. Fishing effort (fishers and canoes) and annual catch for Kyela district (Fisheries data 1990-<br />
1996).<br />
O<strong>the</strong>rs<br />
Barbus15%<br />
0%<br />
Usipa<br />
29%<br />
Opsaridium<br />
2%<br />
Figure 3. Catch composition by weight <strong>of</strong> fish landed at Kyela beaches (Fisheries data).<br />
Years<br />
Tilapiines<br />
18%<br />
Fish processing<br />
The production <strong>of</strong> fish from Lake Nyasa does not meet <strong>the</strong> demand and thus most <strong>of</strong> <strong>the</strong> fish from <strong>the</strong> <strong>lake</strong> is<br />
consumed fresh. Processing activities are in most cases done for immediate consumption. Frying is <strong>the</strong> most<br />
common method. A big fish like Opsaridium microlepis is first cut into small pieces. The pieces are fried in oil and<br />
sold on <strong>the</strong> rural market,"pombe" (local brew beer) shop and bars, occasionally, when <strong>the</strong>re is a bumper catch or<br />
when fish cannot fetch immediate market fish is hot smoked in <strong>the</strong> evenings.<br />
Fish Marketing<br />
As mentioned earlier most <strong>of</strong> <strong>the</strong> fish is consumed fresh. At <strong>the</strong> landing sites <strong>the</strong> fresh fish is displayed in canoes or<br />
on sand. The fish is sold to different buyers who include consumers and fish mongers. A fishermen who owns <strong>the</strong><br />
gears may sell his catch to his relatives or traders and o<strong>the</strong>r people. Some fishermen obliged to sell <strong>the</strong> catch to<br />
boat/gear owner who will <strong>the</strong>n retail <strong>the</strong> catch. The price is normally reached by negotiations and experience,<br />
sometimes butter trade operates.<br />
The fish traders comprise adult men and women. The fresh fish buyers carry <strong>the</strong>ir fish to ei<strong>the</strong>r rural markets or<br />
Kyela Central market on <strong>the</strong> head or on bicycles. The fish are put in bamboo baskets and gunny bags.<br />
At <strong>the</strong> rural markets fish are displayed on raised racks with or without ro<strong>of</strong>. At Kyela Central market <strong>the</strong>re is a wellestablished<br />
fish-receiving block erected since 1987. Inside <strong>the</strong> fresh fish is displayed on raised concrete tables<br />
Fishers<br />
Canoes<br />
Catch<br />
Labeo<br />
1%<br />
Rhamphochromis<br />
19%<br />
Haplochromines<br />
12%<br />
Bagrus<br />
4%
145<br />
Lake Malawi Fisheries Management Symposium - Proceedings<br />
supplied with tap water. There is also a room installed with measuring balance for recording weights <strong>of</strong> fish received<br />
every day.<br />
In rare cases smoked fish (Opsaridium sp.) and sun-dried dagaa (Engraulicypris sardella) from Ludewa (Iringa<br />
Region) and Mbinga (Ruvuma Region) reach Itungi Port by ship. Most <strong>of</strong> <strong>the</strong> processed fish find market in <strong>the</strong><br />
villages and Kyela Central market.<br />
Future Strategies<br />
The future strategies for <strong>fisheries</strong> development in Kyela district should focus on <strong>the</strong> following areas.<br />
Boat construction<br />
The dugout canoes used in <strong>the</strong> <strong>lake</strong> are quite inefficient as fishing crafts and are risky because <strong>the</strong> <strong>lake</strong> becomes<br />
rough quite <strong>of</strong>ten. The poor development in <strong>the</strong> fishery <strong>of</strong> <strong>the</strong> Tanzania side <strong>of</strong> <strong>the</strong> <strong>lake</strong> is partly due to poor fishing<br />
crafts. Offshore pelagic fishing require better fishing crafts. Investors should look into <strong>the</strong> possibility <strong>of</strong> constructing<br />
appropriate boats in Kyela area for <strong>the</strong> nor<strong>the</strong>rn <strong>lake</strong> zone (Tanzania side). Hard wood-“Mninga” (Pterocarpus<br />
angolensis) used for constructing boats is available and <strong>the</strong> demand for such boats is high which justifies investment<br />
in boat building. So far <strong>the</strong>re is only one centre (at Liuli in Ruvuma Region) which trains few people how to build<br />
modern boats. That <strong>of</strong> Itungi Port should be rehabilitated.<br />
Exploitation <strong>of</strong> pelagic resources by use <strong>of</strong> open water seine nets -chilimira nets (ndaturu)<br />
Suitable gears for Kyela area are known to be chilimira nets, gillnets and longline. Chirimila nets however are<br />
gaining popularity especially in capturing Copadichromis sp., Diplotaxodon sp., Oreochromis sp., Rhamphochromis<br />
sp. and Engraulicypris sardella as mentioned earlier.<br />
With this gear <strong>the</strong>re has been a marked shift <strong>of</strong> fishing effort from shallow inshore waters, which serve as nursery<br />
areas for many cichlid species towards deeper waters. Therefore investment in chilimira nets is viable, as <strong>the</strong> target<br />
fish species is plentiful. A proper write up on <strong>the</strong> investment however should be made before investment is<br />
undertaken. TAFIRI is proposing to do a study on <strong>the</strong> open seine fishery within <strong>the</strong> Tanzanian water with <strong>the</strong><br />
objective <strong>of</strong> alleviating poverty through increased income and protein consumption.<br />
Exploitation <strong>of</strong> pelagic resources by use <strong>of</strong> drifting longline<br />
After recommendation <strong>of</strong> long lining in <strong>the</strong> pelagic zone by UK/SADC Lake Malawi Fisheries Project, TAFIRI<br />
carried out a project on <strong>the</strong> long lining in Kyela area and <strong>the</strong> results are encouraging (Mlay et al. 1994). Investment<br />
in longlining is ra<strong>the</strong>r low as <strong>the</strong> prices <strong>of</strong> hooks and twines are relatively cheap. Ordinary artisanal fishermen can<br />
afford <strong>the</strong>m. The only expensive part <strong>of</strong> <strong>the</strong> project is <strong>the</strong> purchase <strong>of</strong> boat and engine. Investors would need to make<br />
feasibility studies before investing but on <strong>the</strong> whole it will need small investment.<br />
Fish marketing<br />
Most fish consumers prefer eating fresh fish. With <strong>the</strong> good tarmac road connecting Dar es Salaam and Kyela and<br />
<strong>the</strong> major towns in <strong>the</strong> country fresh fish from Lake Nyasa could be transported from <strong>the</strong> <strong>lake</strong> area to <strong>the</strong> towns if<br />
<strong>the</strong> traders invest in insulated containers. These containers are now being made locally in Dar es Salaam. The use <strong>of</strong><br />
iced insulated containers will reduce post harvests loses <strong>of</strong> <strong>the</strong> fish and improve <strong>the</strong> quality <strong>of</strong> fish that reach <strong>the</strong><br />
consumer.<br />
Ornamental fish trade<br />
Lake Nyasa is known for its unique fish species. The <strong>lake</strong> ranks very high in ornamental fish trade. In Kyela two<br />
companies are engaged in ornamental fish trade. TAFIRI is considering collaborating with any institution into <strong>the</strong><br />
identification <strong>of</strong> <strong>the</strong> ornamental fishes toge<strong>the</strong>r with <strong>the</strong> fishing grounds. Investors are invited to take up <strong>the</strong><br />
ornamental fish trade, which could be done, on joint venture basis. The potential is high. For proper <strong>management</strong><br />
suitable areas for ornamental fish should be mapped out and Lake Shore communities should benefit from <strong>the</strong> trade.<br />
References<br />
Mlay, M.K.L., Mwambungu, J.A. and Kihedu, K.J.1994. Longline Fishery Prospects in Lake Nyasa. TAFIRI Annual Research<br />
Report. Tanzania.<br />
Nga’ng’a, P.1993.Deltaic sedimentation in a lacustrine environment <strong>of</strong> Lake Malawi, Africa.J. Afr. Earth Sci. 16,253-264.<br />
Ngatunga, B.P., Mwambungu, J.A., Kihedu, K.J., Mlay, M.K.L.and Waya, R.1997.Biodiversity Conservation and Fisheries<br />
Management on Lake Nyasa, Tanzania. Proceedings <strong>of</strong> <strong>the</strong> Workshop <strong>of</strong> <strong>the</strong> Senga Bay,Malawi, February 1997.
146<br />
Lake Malawi Fisheries Management Symposium - Proceedings<br />
Hard choices for chambo <strong>management</strong> in Area A <strong>of</strong> <strong>the</strong> sou<strong>the</strong>ast arm <strong>of</strong> Lake<br />
Malawi<br />
Olaf L.F. Weyl<br />
National Aquatic Resource Management Programme (NARMAP), P.O.Box 27, Monkey Bay, Malawi.<br />
E-mail: narmapbay@<strong>malawi</strong>.net<br />
Abstract<br />
Management <strong>of</strong> <strong>the</strong> fishery in Area A <strong>of</strong> <strong>the</strong> sou<strong>the</strong>ast arm <strong>of</strong> Lake Malawi (SEA) is complicated by multi-gear utilisation and by <strong>the</strong><br />
multi-species nature <strong>of</strong> <strong>the</strong> catch. One option for <strong>management</strong> is to prioritise key species for <strong>management</strong>. The suitability <strong>of</strong><br />
chambo (Oreochromis) species as a key <strong>management</strong> species group for Area A is discussed. The stocks were modelled using<br />
multi-gear yield- and spawner biomass-per-recruit models to investigate four <strong>management</strong> target reference points (TRP’s). These<br />
TRP’s were Fmax, F0.1 and FSB40 and FSB50 . Fmax corresponds with <strong>the</strong> asymptote <strong>of</strong> <strong>the</strong> yield-per-recruit curve and approximates<br />
Maximum Sustainable Yield, F0.1 is <strong>the</strong> rate <strong>of</strong> fishing mortality at which <strong>the</strong> slope <strong>of</strong> <strong>the</strong> yield-per-recruit curve falls to 10% <strong>of</strong> its<br />
value at <strong>the</strong> origin, FSB40 and FSB50 are <strong>the</strong> points on <strong>the</strong> spawner-biomass-per-recruit curve corresponding to a reduction <strong>of</strong> 40% and<br />
50% <strong>of</strong> <strong>the</strong> pristine spawner-biomass. It was estimated that <strong>the</strong> current fishing mortality rate (F) for Area A chambo approximated<br />
0.34 yr -1 . This exploitation level was below <strong>the</strong> Fmax TRP but exceeded <strong>the</strong> more conservative F0.1 TRP. In addition, current<br />
exploitation rates exceeded both spawner biomass based TRP’s. To attain <strong>the</strong> FSB40 TRP a 10% reduction in fishing effort was<br />
necessary and a 23% reduction in effort was necessary to attain <strong>the</strong> FSB50 TRP. Different <strong>management</strong> options taking into account<br />
<strong>the</strong> effect in total landings and employment are discussed.<br />
Introduction<br />
Through <strong>the</strong> participatory <strong>fisheries</strong> <strong>management</strong> (PFM) framework <strong>of</strong> <strong>the</strong> Department <strong>of</strong> Fisheries (DoF), fishing<br />
communities have <strong>the</strong> right to obtain <strong>fisheries</strong> <strong>management</strong> recommendations for <strong>the</strong>ir specific fishing grounds<br />
(GOM 2000). The provision <strong>of</strong> such <strong>management</strong> recomendations is <strong>the</strong> responsibility <strong>of</strong> <strong>the</strong> Fisheries Research<br />
Unit (FRU) <strong>of</strong> <strong>the</strong> DoF. Since <strong>the</strong>se recommendations are to cover finite areas for PFM, <strong>the</strong>y have to refer to<br />
localised areas that are small enough to allow for community based <strong>management</strong> but large enough so that<br />
<strong>management</strong> interventions will have an effect on <strong>the</strong> fish stock. Fur<strong>the</strong>rmore, <strong>management</strong> recommendations should<br />
be based on <strong>the</strong> best scientific knowlege available and take into consideration <strong>the</strong> multi-gear and multi-specie nature<br />
<strong>of</strong> <strong>the</strong> <strong>fisheries</strong> in Malawi.<br />
The fishery in Area A <strong>of</strong> <strong>the</strong> sou<strong>the</strong>ast arm <strong>of</strong> Lake Malawi (SEA; Figure 1) has both small scale and large scale<br />
commercial components. The small scale fishery comprises some 420 gill nets, 119 chilimira nets, 27 kambuzi<br />
seines, 18 chambo seines and at least 12 nkacha nets (Weyl et al. 2000). This small scale fishery currently employs<br />
in excess <strong>of</strong> 1900 fishers (Weyl et al. 2000). The commercial fishery currently comprises 2 pair trawl units and one<br />
ring net unit. However, 4 pair trawl licences and two ring net licences are issued (Banda & Chirwa 2000).<br />
However, <strong>the</strong> consolidation <strong>of</strong> area A under one PFM <strong>management</strong> unit is considered feasible (Weyl 2001).<br />
Fisheries <strong>management</strong> in Area A is complicated by <strong>the</strong> multi species nature <strong>of</strong> <strong>the</strong> catch, and over 100 species<br />
contribute to <strong>the</strong> catches in Area A (Chisambo 2001, Manase 2001, Sipawe 2001, Nyasulu 2001). It has long been<br />
recognised, that when a fishery harvests a number <strong>of</strong> species it is impossible to manage each species at its optimum<br />
level (Murawski 1984). In such cases, one possible option is to base <strong>management</strong> on <strong>the</strong> least resilient species in a<br />
multi-species fishery (Weyl 1998). However, this requires prior knowledge <strong>of</strong> <strong>the</strong> biological and life history<br />
information on all target species. Such information is not available for most <strong>of</strong> <strong>the</strong> species targeted by Malawi’s<br />
small-scale <strong>fisheries</strong>. Until such data is available, it is recommendable to prioritise key species for <strong>management</strong> in<br />
specific areas. Such key species should contribute significantly towards <strong>the</strong> fishery and show declining catch trends<br />
that indicate that <strong>management</strong> intervention is necessary and <strong>the</strong> species should have life history traits such as limited<br />
distribution ranges, limited migration patterns, localised spawning and localised nursery areas, which would make<br />
locality specific <strong>management</strong> feasible.
Figure 1. The south east arm <strong>of</strong> Lake <strong>malawi</strong> showing Area A.<br />
147<br />
Lake Malawi Fisheries Management Symposium - Proceedings<br />
The chambo (Oreochromis ‘Nyasalapia’ spp.) stock in Area A fulfills <strong>the</strong>se criteria. It has been shown that chambo<br />
contributes more than 30% to <strong>the</strong> total catch in Area A and <strong>the</strong>refore contributes significantly to <strong>the</strong> fishery (Figure<br />
2). The decline in <strong>the</strong> chambo stocks (Figure 2) in <strong>the</strong> SEA is well documented and <strong>management</strong> for this species is<br />
considered necessary (FAO 1993, Tweddle et al. 1994, Palsson et al. 1999, Bulirani et al. 1999). Kanyerere (2001)<br />
showed that <strong>the</strong> chambo stock <strong>of</strong> <strong>the</strong> SEA was concentrated in Area A and over 70% <strong>of</strong> <strong>the</strong> SEA chambo catch<br />
originates from this area (FRU unpublished catch data). While migration <strong>of</strong> chambo from <strong>the</strong> SEA into Lake<br />
Malombe have been considered, <strong>the</strong>re is currently little substantiating evidence (FAO 1993) it is likely that Lowe’s<br />
(1952) observation that <strong>the</strong> chambo stock is localised and prone to local overfishing remains valid. Hence <strong>the</strong><br />
<strong>management</strong> <strong>of</strong> <strong>the</strong> chambo population in Area A is feasible.<br />
Catch (tons)<br />
4500<br />
4000<br />
3500<br />
3000<br />
2500<br />
2000<br />
1500<br />
1000<br />
500<br />
0<br />
1984<br />
1985<br />
1986<br />
1987<br />
1988<br />
1989<br />
1990<br />
Figure 2. Chambo catch in <strong>the</strong> sou<strong>the</strong>ast arm <strong>of</strong> Lake Malawi. The contribution <strong>of</strong> Area A to <strong>the</strong> total<br />
chambo catch is represented by <strong>the</strong> shaded portion.<br />
1991<br />
1992<br />
Year<br />
1993<br />
1994<br />
1995<br />
1996<br />
1997<br />
1998<br />
1999
148<br />
Lake Malawi Fisheries Management Symposium - Proceedings<br />
In an attempt to define optimum fishing mortality from a per-recruit perspective <strong>the</strong> use <strong>of</strong> target reference points<br />
(TRPs) has become common practice in <strong>fisheries</strong> <strong>management</strong> (Clarke 1991, Punt 1993, Caddy & Mahon 1995,<br />
Booth & Buxton 1997, Griffiths 1997, Bulirani et al. 1999). The TRP approach is already advocated by <strong>the</strong> DoF<br />
and <strong>the</strong> 1999 Resource Report makes <strong>management</strong> recommendations for <strong>the</strong> <strong>fisheries</strong> based on TRP’s based on<br />
catch per unit effort in <strong>the</strong> small scale fishery (Bulirani et al. 1999).<br />
The yield-per-recruit (YPR) approach allows for <strong>the</strong> determination <strong>of</strong> at least two commonly used TRPs: firstly, <strong>the</strong><br />
fishing mortality which corresponds to <strong>the</strong> maximum <strong>of</strong> <strong>the</strong> yield-per-recruit curve (Fmax) and secondly, <strong>the</strong> marginal<br />
yield or F0.1 strategy (Gulland & Boerema 1973, Deriso 1987), which is <strong>the</strong> rate <strong>of</strong> fishing mortality at which <strong>the</strong><br />
slope <strong>of</strong> <strong>the</strong> yield-per-recruit curve falls to 10% <strong>of</strong> its value at <strong>the</strong> origin. However, <strong>the</strong> yield-per-recruit approach<br />
assumes that recruitment is constant and independent <strong>of</strong> spawner biomass. Since, <strong>the</strong>re is little doubt that in most<br />
fish species <strong>the</strong> stock-recruitment relationship is density dependent (Shepherd 1982, Sissenwine & Shepherd 1987).<br />
Since, Oreochromis species are mouthbrooders with extended parental care (Trewavas 1983), a density dependent<br />
spawner biomass-recruitment relationship is implied. For similar reasons, scientists concerned with <strong>the</strong> <strong>management</strong><br />
<strong>of</strong> marine species have tended to base <strong>the</strong>ir TRP recommendations on <strong>the</strong> results <strong>of</strong> spawner biomass-per-recruit<br />
(SBR) models (Butterworth et al. 1989, Smale & Punt 1991, Booth & Buxton 1997, Griffiths 1997). The definition<br />
<strong>of</strong> a spawner-biomass TRP (FSB(x)) involves setting <strong>the</strong> fishing mortality to a level at which spawner biomass-perrecruit<br />
is reduced to x% <strong>of</strong> its pristine level. Although <strong>the</strong>re is no conventional FSB(x) TRP, spawner biomass-perrecruit<br />
recommendations lie between 25% and 50% <strong>of</strong> unexploited levels (Deriso 1987, Sissenwine & Shepherd<br />
1987, Butterworth et al. 1989, Smale & Punt 1991, Clark 1991, Punt 1993, Booth & Buxton 1997). In <strong>the</strong> absence<br />
<strong>of</strong> information on <strong>the</strong> spawner biomass-recruitment relationship, <strong>the</strong> FSB(x) TRPs are currently considered <strong>the</strong> most<br />
robust, allowing for <strong>the</strong> determination <strong>of</strong> a fishing mortality rate that will provide relatively high yields at lower<br />
risks (Clarke 1991, Punt 1993).<br />
Three Oreochromis species O. squamipinnis, O. lidole and O. karongae, comprise <strong>the</strong> chambo stock, identification<br />
<strong>of</strong> juveniles to species level is problematic (FAO 1993). However, <strong>the</strong> similarity in age-at-maturity and growth rate<br />
in <strong>the</strong> three species allows for <strong>the</strong>ir treatment <strong>of</strong> all three as a single <strong>management</strong> unit. This allows for <strong>the</strong><br />
application <strong>of</strong> <strong>fisheries</strong> models such as <strong>the</strong> multi gear yield per recruit MGYPR (Djama & Pitcher 1997) and multi<br />
gear spawner-biomass per recruit MGSBR (Weyl 1998) to determine <strong>the</strong> effect <strong>of</strong> yield and spawnner biomass to<br />
varying levels for fishing mortality.<br />
The aim <strong>of</strong> this study was to investigate <strong>the</strong> effect <strong>of</strong> <strong>the</strong> <strong>management</strong> interventions suggested by <strong>the</strong> Fisheries<br />
Management and Conservation Act (GOM 2000) on <strong>the</strong> chambo fishery in Area A. These <strong>management</strong> interventions<br />
include: a closed season for seines during November and December, total bans on nkacha and kambuzi seines, a<br />
total ban on <strong>the</strong> light attraction chilimira/kauni fishery for chambo and minimum mesh size restrictions for gill nets<br />
from a per-recruit perspective. In addition, MGYPR and MGSBR approaches were applied to investigate four Target<br />
Reference Points (TRP’s). These were <strong>the</strong> YPR based Fmax and F0.1 TPRs and <strong>the</strong> SBR-based FSB40 and FSB50 TRP’s.<br />
as well as two spawner biomass dependent TRPs.<br />
Methods<br />
Per Recruit Models<br />
The multi-fishery per-recruit models used in this paper are based on an extension <strong>of</strong> <strong>the</strong> traditional per-recruit<br />
models (Djama& Pitcher 1997, Weyl 1998). Input parameters for <strong>the</strong> per-recruit simulations were derived from <strong>the</strong><br />
literature available on <strong>the</strong> chambo stocks (Table 1). Yield- per recruit was calculated by <strong>the</strong> equation:<br />
YPR<br />
⎡<br />
max<br />
= ∑<br />
a=<br />
0<br />
⎢ ~<br />
⎢(<br />
wa<br />
N a ( 1−<br />
exp( −(<br />
M<br />
⎢<br />
⎣<br />
+ ∑ S<br />
j<br />
aj<br />
F j ))))<br />
M<br />
∑<br />
j<br />
+<br />
S<br />
j<br />
aj<br />
∑<br />
F<br />
S<br />
j<br />
aj<br />
⎤<br />
⎥<br />
∆a<br />
F ⎥<br />
j ⎥<br />
⎦
149<br />
Lake Malawi Fisheries Management Symposium - Proceedings<br />
and spawner-biomass-per-recruit for each species i (SBRi) in a multi-gear fishery was determined by:<br />
max<br />
SBR = ∑<br />
a=<br />
0<br />
where wa is <strong>the</strong> weight-at-age a, described by:<br />
Wa= α( la ) β<br />
where la is <strong>the</strong> length-at-age determined by <strong>the</strong> von Bertalanffy growth equation; α and β are parameters describing<br />
<strong>the</strong> length-weight relationship; Saj is <strong>the</strong> selectivity for age class a by fishery j, Fj is <strong>the</strong> instantaneous rate <strong>of</strong> fishing<br />
mortality (yr -1 ) for all <strong>fisheries</strong> j under consideration, M is <strong>the</strong> rate <strong>of</strong> natural mortality, and max is <strong>the</strong> maximum<br />
recorded age. N ia<br />
~ is <strong>the</strong> relative number-at-age <strong>of</strong> species i and was described as:<br />
~<br />
N<br />
ia<br />
where Sax is <strong>the</strong> selectivity <strong>of</strong> gear x for age class a and Fax is <strong>the</strong> proportional fishing mortality rate (yr -1 ) for that<br />
fishery. Fax was determined by <strong>the</strong> proportional contribution <strong>of</strong> each gear to <strong>the</strong> total chambo catch in all gears<br />
under consideration. Catch estimates for <strong>the</strong> year 2000 in <strong>the</strong> SEA were used (Table 2). All summations were<br />
∆ a <strong>of</strong> 0.10 <strong>of</strong> a year.<br />
conducted with a step size ( )<br />
Input parameters<br />
~<br />
ψ w N ∆a<br />
a<br />
a<br />
a<br />
⎧ 1<br />
if a = 0<br />
⎪<br />
= ⎨<br />
⎪ ~<br />
⎩N<br />
i,<br />
a−1<br />
exp( −(<br />
M + ( S a1Fa1<br />
+ S a2<br />
Fa<br />
2 + ... S a5<br />
Fa5<br />
))) o<strong>the</strong>rwise<br />
Growth parameters<br />
The average value for K (0.23) and L∞ (40.7cm) presented by Seisay et al. (1992) for Oreochromis spp. was used<br />
in all computations, while a to value <strong>of</strong> 0.26 was used as this gave realistic lengths at low ages (Palsson et al. 1999).<br />
The input parameters for <strong>the</strong> length weight equation (Equation 3) were derived Seisay et al. (1992).<br />
Mortality rates<br />
To obtain estimates for <strong>the</strong> instantaneous rate <strong>of</strong> total annual mortality (Z), length frequency data collected from<br />
trawl surveys undertaken by <strong>the</strong> R.V. Ndunduma in Area A in December 1995, January 1997, January 1998, June<br />
1999 and January 2000 were analysed by means <strong>of</strong> a linearised length-converted catch curve (Pauly 1983, 1984a,<br />
1984b). This method uses von Bertalanffy growth parameters 1 to plot <strong>of</strong> ln (F/dt) against t, where F is <strong>the</strong><br />
frequency <strong>of</strong> individuals in each length class, t is <strong>the</strong> relative age <strong>of</strong> <strong>the</strong> fish. The value dt is <strong>the</strong> time taken for <strong>the</strong><br />
fish to grow through a particular length class and allows for decreased growth with increased age. The negative <strong>of</strong><br />
<strong>the</strong> slope <strong>of</strong> <strong>the</strong> resultant linear regression line through <strong>the</strong> descending data points gives a first approximation <strong>of</strong> Z.<br />
For natural mortality, <strong>the</strong> FAO (1993) estimates M = 0.4 yr -1 for fish younger than 2 years, M =0.3 yr -1 for fish<br />
between 2 and 4 years old and M = 0.2 yr -1 for fish older than 4 years were used. Having obtained Z and M, fishing<br />
mortality was derived by subtraction (F = Z – M).<br />
Age specific selectivity<br />
Age-specific selectivity was estimated by age-converting length-based selectivity functions for chambo. Length<br />
based selectivity was obtained from available literature (Sipawe 2001, Chisambo 2001, FAO 1993). Both <strong>the</strong> reparameterised<br />
Gamma (Punt et al., 1996) and Logistic distributions were investigated to approximate gear<br />
selectivity patterns. The Gamma distribution was considered most suitable for gill nets as selectivity increases to a<br />
maximum and <strong>the</strong>n decreases. The selectivity pattern <strong>of</strong> chambo seines, kambuzi seines, chilimira/kauni and <strong>the</strong><br />
commercial <strong>fisheries</strong> was described by logistic distribution as selectivity was assumed to increases to, and remain at,<br />
a maximum.<br />
1 The average value for K (0.23) and L∞ (40.7cm) presented by Seisay et al. (1992) for Oreochromis spp. was<br />
used in all computations, while a to value <strong>of</strong> 0.26 was used as this gave realistic lengths at low ages (Palsson et al.<br />
1999).
Both distributions are described as<br />
S<br />
a<br />
a<br />
= ( )<br />
φ<br />
φ<br />
p<br />
e<br />
( φ −a)<br />
/ p<br />
( ) 1<br />
−(<br />
a−φ<br />
) / σ −<br />
1+<br />
e<br />
( 4 ) / 2<br />
2 2<br />
φ + σ −φ<br />
150<br />
Lake Malawi Fisheries Management Symposium - Proceedings<br />
p =<br />
(Gamma distribution)<br />
S =<br />
(Logistic distribution)<br />
a<br />
where Sa is <strong>the</strong> selection <strong>of</strong> <strong>the</strong> gear on fish <strong>of</strong> age a, φ is <strong>the</strong> age at maximum selectivity (in <strong>the</strong> Gamma<br />
distribution) or age-at-50% selection (in <strong>the</strong> Logistic distribution) and σ <strong>the</strong> width <strong>of</strong> <strong>the</strong> selectivity function.<br />
Table 1. Input parameters used for <strong>the</strong> application <strong>of</strong> yield and spawner-biomass-per-recruit models for<br />
<strong>the</strong> chambo (Oreochromis spp.) stock in Area A <strong>of</strong> <strong>the</strong> sou<strong>the</strong>ast arm <strong>of</strong> Lake Malawi.<br />
Results<br />
Parameter Value Function<br />
Growth Parameters<br />
K= 0.23; L∞ = 40.5cm; to = -0.23 Von Bertalanffy<br />
Maximum age<br />
Maturity<br />
Length Weight<br />
Natural mortality<br />
10 yrs<br />
φ =2.93 yrs; σ = 0.64 yrs Logistic<br />
α = 0.017; β = 2.99 Equation 3<br />
Age 0-2 = 0.4 yr -1 ; Age 2-4 = 0.3 yr -1 ;<br />
Age 4+ = 0.2 yr -1<br />
Exponential decay<br />
Fishing Mortality<br />
F (all <strong>fisheries</strong>) 0.34 yr -1 Exponential decay<br />
2” gill net 0.0003 yr -1 Exponential decay<br />
3” gill net 0.046 yr -1 Exponential decay<br />
Chilimira/Kauni 0.25 yr -1 Exponential decay<br />
Nkacha/Kambuzi seine 0.001 yr -1 Exponential decay<br />
Chambo seine 0.03 yr -1 Exponential decay<br />
Commercial <strong>fisheries</strong> 0.01 yr -1 Exponential decay<br />
Selectivity<br />
2” gill net φ = 1.6; σ = 0.16 Gamma<br />
3” gill net φ = 3.68; σ =0.67 Gamma<br />
Chilimira/Kauni φ = 3.17; σ = 0.43 Logistic<br />
Nkacha/Kambuzi seine φ = 0.878; σ = 0.156 Logistic<br />
Chambo seine φ = 3.5; σ =0.4 Logistic<br />
Commercial <strong>fisheries</strong> φ = 3.19; σ = 0.48 Logistic<br />
Per-recruit analysis<br />
Input parameters used in <strong>the</strong> per-recruit analysis are summarised in Table 2. Length-converted catch curves for<br />
Oreochromis spp. are shown in Figure 2. Estimates <strong>of</strong> Z varied between surveys ranging from 0.50 yr -1 to 0.69 yr -1 .<br />
The mortality rate estimated from <strong>the</strong> January 1998 survey (0.69 yr -1 ) was considered exceptionally high and was<br />
<strong>the</strong>refore not used in fur<strong>the</strong>r analysis. An average <strong>of</strong> <strong>the</strong> remaining Z estimates was used as a first approximation <strong>of</strong><br />
Z in Area A. Z was estimated to be 0.54yr-1. The resultant Fishing mortality rate was <strong>the</strong>refore 0.34 on fish older<br />
than 4 years. Estimates for gear specific fishing mortality and selectivity are shown in Table 1.
Ln (n/dt)<br />
151<br />
Lake Malawi Fisheries Management Symposium - Proceedings<br />
(a) Dec 95<br />
Z = 0.51<br />
R2 (b) Jan 97<br />
y = 0.58<br />
R<br />
7<br />
= 0.80<br />
6<br />
5<br />
4<br />
3<br />
2<br />
1<br />
0<br />
0 2 4 6 8 10<br />
Age (yrs)<br />
2 (c) Jan 98<br />
= 0.91<br />
6<br />
Z = 0.69<br />
5<br />
R<br />
4<br />
3<br />
2<br />
1<br />
0<br />
0 2 4 6 8 10<br />
Age (yrs)<br />
2 6<br />
5<br />
= 0.92<br />
4<br />
3<br />
2<br />
1<br />
0<br />
0 2 4 6 8 10<br />
Age (yrs)<br />
(d) Jun 99<br />
Z = -0.52<br />
R2 (e) Jan 00<br />
Z = 0.55<br />
6<br />
= 0.78<br />
R<br />
5<br />
4<br />
3<br />
2<br />
1<br />
0<br />
0 2 4 6 8 10<br />
Age (yrs)<br />
2 7<br />
= 0.82<br />
6<br />
5<br />
4<br />
3<br />
2<br />
1<br />
0<br />
0 2 4 6 8 10<br />
Age (yrs)<br />
Ln (n/dt)<br />
Figure 3. Length converted catch curves for Oreochromis spp. derived from trawl net length frequency<br />
distributions in Area A <strong>of</strong> <strong>the</strong> sou<strong>the</strong>ast Arm <strong>of</strong> Lake Malawi from December 1995 to January 2000.<br />
Yield- and spawner biomass-per-recruit as a function <strong>of</strong> fishing mortality are presented in Figure 3. Current fishing<br />
mortality (Fcur) was below <strong>the</strong> Fmax TRP (0.54yr -1 ) but it was higher than <strong>the</strong> more conservative F0.1 TRP (F0.1 = 0.32<br />
yr -1 ). At Fcur, <strong>the</strong> chambo spawner biomass was reduced to 37% <strong>of</strong> pristene levels (Figure 1). At Fmax SBR would<br />
be reduced to 25% <strong>of</strong> pristene levels. The FSB40 strategy approximated <strong>the</strong> F0.1 TRP.<br />
YPR<br />
80<br />
70<br />
60<br />
50<br />
40<br />
30<br />
20<br />
10<br />
Ln (n/dt)<br />
Ln (n/dt)<br />
F SB50<br />
F 0.1<br />
F SB40<br />
F cur<br />
F max<br />
0<br />
0<br />
0.0 0.1 0.2 0.3 0.4 0.5 0.6 0.7<br />
F<br />
Figure 4. Yield-per-recruit (YPR, closed circles) and spawner biomass-per-recruit (SBR; open circles) as<br />
a response to fishing mortality (F) for Oreochromis ‘Nyasalapia’ spp. In Area A <strong>of</strong> <strong>the</strong> SEA <strong>of</strong> Lake<br />
Malawi. Common target reference points are shown.<br />
Ln (n/dt)<br />
600<br />
500<br />
400<br />
300<br />
200<br />
100<br />
SBR
152<br />
Lake Malawi Fisheries Management Symposium - Proceedings<br />
Using <strong>the</strong> multi-fishery per-recruit models it was possible to assess <strong>the</strong> response <strong>of</strong> chambo SBR to different<br />
combinations <strong>of</strong> F in <strong>the</strong> <strong>fisheries</strong>. Various <strong>management</strong> options were explored and resultant effort at <strong>the</strong> FSB40 and<br />
FSB50 TRP are shown in Table 2. Effort limitations to below current levels were necessary to attain <strong>the</strong> FSB40 and<br />
FSB50 TRP in all scenarios investigated. With all <strong>fisheries</strong> active, 10% reduction in F was necessary to obtain and<br />
FSB40 TRP and a 23% reduction was neccesary to obtain an FSB50 TRP. The closure <strong>of</strong> <strong>the</strong> 2 inch gill net fishery or<br />
<strong>the</strong> nkacha net and kambuzi seine fishery only resulted in marginal increases in <strong>the</strong> allowable effort at FSB40 and<br />
FSB40 TRP. In all scenarios that maintained <strong>the</strong> chilimira/kauni fishery at current effort levels an FSB50 TRP was not<br />
attainable and <strong>the</strong> FSB40 TRP was only attainable with large effort reductions in all o<strong>the</strong>r <strong>fisheries</strong>.<br />
Table 2. Allowable effort levels at different <strong>management</strong> scenarios maintaining FSB40 and FSB50 TRPs with<br />
proportional increase in effort in all <strong>fisheries</strong>.(GN2 = 2inch gill net, GN3 = 3inch + gill net, NK = Nkacha<br />
net, KS = Kambuzi seine, CH = Chilimira/Kauni, CS = Chambo seines, PT = Pair trawl fishery.<br />
Management strategy<br />
Current Fishery<br />
All <strong>fisheries</strong> active<br />
Ban <strong>of</strong> NK + KS<br />
Number <strong>of</strong> gears<br />
F GN2 GN3 CH PT KS+NK CS<br />
0.34 75 343 119 2 39 18<br />
FSB50 0.22 49 222 77 1 25 12<br />
FSB40 0.31 68 313 109 2 36 16<br />
FSB50 0.23 50 229 79 1 - 12<br />
FSB40 0.32 70 319 111 2 - 17<br />
Ban <strong>of</strong> GN2<br />
FSB50 0.22 - 225 78 1 25 12<br />
FSB40 0.32 - 313 109 2 36 16<br />
Ban on Pair Trawl FSB50 0.23 56 232 80 - 26 12<br />
FSB40 0.32 78 323 112 - 37 17<br />
Ban on all seines<br />
FSB50 0.24 54 245 85 1 - -<br />
FSB40 0.34 76 346 120 2 - -<br />
CH maintained at current levels<br />
CH + CS maintained at current levels + ban on NK +<br />
KS<br />
KS + NK banned and all o<strong>the</strong>r <strong>fisheries</strong> except CH<br />
maintained at current levels<br />
FSB50<br />
Not attainable<br />
FSB40 0.16 35 162 119 1 18 8<br />
FSB50<br />
Not attainable<br />
FSB40 0.01 1 6 119 2 - 18<br />
FSB50 0.20 75 343 69 2 - 18<br />
FSB40 0.31 75 343 108 2 - 18<br />
Discussion<br />
Current exploitation rates for chambo in Area A lie between <strong>the</strong> F0.1 and Fmax TRP levels and corresponds to an SBR<br />
reduction to 37% <strong>of</strong> pristene levels (Figure 2). The declining chambo catch in <strong>the</strong> SEA <strong>of</strong> Lake Malawi over <strong>the</strong><br />
past 10 years (FRU unpublished catch statistics, Weyl 1999, Bulirani et al. 1999) imply that this level <strong>of</strong> SBR is too<br />
low to sustain <strong>the</strong> chambo stock. This may, in part, be a consequence <strong>of</strong> <strong>the</strong> reproductive behaviour <strong>of</strong> chambo.<br />
Oreochromis spp. are mouthbrooders which brood <strong>the</strong>ir eggs and young for extended periods (Trewawas 1983). For<br />
this reason <strong>the</strong> recruitment <strong>of</strong> chambo is likely to be highly dependent on <strong>the</strong> density <strong>of</strong> adult fish and chambo<br />
directed <strong>management</strong> should focuss on <strong>the</strong> maintenance <strong>of</strong> <strong>the</strong> SBR at FSB40 or even FSB50 levels. Management at<br />
<strong>the</strong>se TRPs would require a decrease in 10% in F to attain <strong>the</strong> FSB40 and a 23% reduction in F to attain <strong>the</strong> FSB50.<br />
The declinning catch rates for chambo indicate that current <strong>management</strong> strategies (GOM 2000) have not adequately<br />
protected chambo and have failed at <strong>the</strong> maintenance <strong>of</strong> sustainable yields. For this reson it is believed that <strong>the</strong><br />
closed season is an inadequate measure to sustain catches in this fishery. While <strong>the</strong> use <strong>of</strong> small meshed seines and<br />
nkacha nets is already banned in <strong>the</strong> SEA, it is evident that <strong>the</strong>ir use is continued in <strong>the</strong> SEA Arm (pers obs).<br />
However, due to <strong>the</strong> low contribution <strong>of</strong> <strong>the</strong>se gears to <strong>the</strong> total chambo catch, <strong>the</strong> removal <strong>of</strong> <strong>the</strong>se gears from <strong>the</strong><br />
fishery only had a marginal effect on chambo YPR and SBR. However, it has been noted that in addition to<br />
catching predominantly juvenile chambo (Manase 2001, FAO 1993), nkacha nets and beach seines cause
153<br />
Lake Malawi Fisheries Management Symposium - Proceedings<br />
considerable habitat damage by scouring <strong>the</strong> <strong>lake</strong> bottom and <strong>the</strong> destroying weedbeds (Tweddle et al. 1994) and is<br />
recommended that <strong>the</strong>se gears remain prohibited in <strong>the</strong> SEA. The removal <strong>of</strong> gill nets with mesh sizes <strong>of</strong> less than 2<br />
inches from <strong>the</strong> fishery would also only have a marginal effect on YPR and SBR <strong>of</strong> chambo. This is a result <strong>of</strong> this<br />
gear not actively targeting chambo (Sipawe 2001). Management <strong>the</strong>refore needs to foccuss on effort reductions in<br />
all chambo harvesting <strong>fisheries</strong> ra<strong>the</strong>r than on <strong>the</strong> removal <strong>of</strong> a few highly destructive fishing gears.<br />
An isopleth diagram showing <strong>the</strong> response <strong>of</strong> SBR to increasing effort in <strong>the</strong> number <strong>of</strong> chilimira/kauni nets and gill<br />
nets (with nkacha and kambuzi seines removed from <strong>the</strong> fishery and chambo seine and commercial effort set at<br />
current levels) in Area A are presented in Figure 3. Essentially this isopleth shows that <strong>the</strong> number <strong>of</strong> allowable gill<br />
nets is dependent on <strong>the</strong> number <strong>of</strong> chilimira nets and vice versa. If FSB50 TRP was to be maintained, <strong>the</strong>n any<br />
combination <strong>of</strong> <strong>the</strong> two gears following <strong>the</strong> FSB50 contour would be appropriate. At FSB40, slightly higher effort<br />
levels would be feasible. While <strong>the</strong> removal <strong>of</strong> <strong>the</strong> <strong>the</strong> kauni fishery would allow for well over 3000 gill nets in<br />
Area A, a total ban <strong>of</strong> kauni may not be feasible. The chilimira net is an important gear for <strong>the</strong> harvest <strong>of</strong> species<br />
o<strong>the</strong>r than chambo and a closure <strong>of</strong> this fishery would reduce landings <strong>of</strong> non-chambo species by an estimated 1500<br />
tons (FRU catch statistics). In addition, consideration must be given to <strong>the</strong> current employment <strong>of</strong> over 1000 fishers<br />
in this fishery in Area A. It is <strong>the</strong>refore recommended that an acceptable effort balance between <strong>the</strong> chilimira/kauni<br />
and o<strong>the</strong>r <strong>fisheries</strong> be considered ra<strong>the</strong>r than a a total closure.<br />
Number <strong>of</strong> Gill nets<br />
5000<br />
4000<br />
3000<br />
2000<br />
1000<br />
50<br />
40<br />
60<br />
30<br />
40<br />
30<br />
20<br />
70<br />
80<br />
50<br />
30<br />
20<br />
0<br />
0 60 120 180 240 300<br />
Number <strong>of</strong> Chilimira nets<br />
Figure 5. Isopleth diagram showing chambo spawner-biomass-per-recruit as a proportion <strong>of</strong> pristine<br />
levels for different combinations <strong>of</strong> effort in <strong>the</strong> gill net and chilimira/kauni <strong>fisheries</strong> in Area A <strong>of</strong> <strong>the</strong> SEA <strong>of</strong><br />
Lake Malawi.<br />
An example <strong>of</strong> different <strong>management</strong> options maintaining an FSB40 TRP, with a limit <strong>of</strong> 90 chilimira/kauni units is<br />
shown in Table 3. With <strong>the</strong> ban <strong>of</strong> nkacha and kambuzi seines and all o<strong>the</strong>r current <strong>fisheries</strong> active at 1999 levels,<br />
<strong>the</strong> reduction <strong>of</strong> <strong>the</strong> chilimira/kauni fishery to 90 gears would allow for 1100 gill net licences in “Area A’. At this<br />
level a total <strong>of</strong> 1400 people could be employed and a total yield <strong>of</strong> 2800 tons could be attained (assuming no change<br />
in catch rate for species o<strong>the</strong>r than chambo). If all commercial licences were activated, (a total <strong>of</strong> 4 pair trawlers),<br />
only 900 gill net licences could be sold, employment would decrease to about 1300 fishers, but production would<br />
increase to 3600 tons. The closure <strong>of</strong> chambo seines would allow for an increase in <strong>the</strong> number <strong>of</strong> gill nets, but only<br />
1200 fishers would be employed in <strong>the</strong> small scale sector and <strong>the</strong> yield would be arround 3300 tons. The closure <strong>of</strong><br />
<strong>the</strong> commercial sector in area A would increase allowable gill nets to 1600, allow for 1600 fishers to be employed<br />
and a yield <strong>of</strong> 2600 tons.<br />
It is evident that <strong>the</strong> <strong>management</strong> <strong>of</strong> <strong>the</strong> chambo stocks in Area A will have costs. None <strong>of</strong> <strong>the</strong> suggested strategies<br />
would be able to employ all 1900 fishers currently employed in <strong>the</strong> fishery. A maximisation <strong>of</strong> employment in <strong>the</strong><br />
small scale sector would decrease potential landings <strong>of</strong> species o<strong>the</strong>r than chambo. Alternatively, maximisation <strong>of</strong><br />
20
154<br />
Lake Malawi Fisheries Management Symposium - Proceedings<br />
landings through commercialisation would decrease potential employment. A <strong>management</strong> strategy for chambo in<br />
Area A <strong>the</strong>refore needs to take into account both socio-economic as well as biological constraints.<br />
Table 3. Estimated number <strong>of</strong> gill net units, employment and total annual yield for all species in Area A <strong>of</strong><br />
<strong>the</strong> SEA <strong>of</strong> Lake Malawi at different <strong>management</strong> scenarios maintaining an FSB40 TRP for Chambo,<br />
when Chilimira/Kauni effort is limited to 90 gears.<br />
All possible<br />
Closure <strong>of</strong> <strong>the</strong><br />
All <strong>fisheries</strong> Active commercial licences Closure <strong>of</strong> all seines commercial fishery<br />
Number <strong>of</strong> gill nets < 1100 gill nets
155<br />
Lake Malawi Fisheries Management Symposium - Proceedings<br />
Pauly, D. 1980. On <strong>the</strong> interrelationship between natural mortality, growth parameters and mean environmental temperature in<br />
175 stocks <strong>of</strong> fish. J. Cons. Int. Explor. Mer, 39: 175-192.<br />
Pauly, D. 1983. Length-converted catch curves: a powerful tool for <strong>fisheries</strong> research in <strong>the</strong> tropics. ICLARM, Fishbyte 1(2): 9-<br />
13.<br />
Pauly, D. 1984a. Length-converted catch curves. A powerful tool for <strong>fisheries</strong> research in <strong>the</strong> tropics. ICLARM. Fishbyte 2(1):<br />
17-19.<br />
Pauly, D. 1984b. Length-converted catch curves. A powerful tool for <strong>fisheries</strong> research in <strong>the</strong> tropics (conclusion). ICLARM,<br />
Fishbyte 2(3): 9-10.<br />
Pikitch, E.K. 1987. Use <strong>of</strong> a mixed-species yield-per-recruit model to explore <strong>the</strong> consequences <strong>of</strong> various <strong>management</strong> policies<br />
for <strong>the</strong> Oregon flatfish fishery. Can. J. Fish. Aquat. Sci. 44: 349-359.<br />
Punt, A.E. 1993. The use <strong>of</strong> spawner-biomass-per-recruit in <strong>the</strong> <strong>management</strong> <strong>of</strong> line<strong>fisheries</strong>. Special Publication <strong>of</strong> <strong>the</strong><br />
Oceanographic Research Institute, Durban, 2: 80-89.<br />
Seisay M.D.B., van Zalinge N.P & Turner G.F., 1992. Population Dynamics and stock estimates <strong>of</strong> Chambo (Oreochromis spp.)<br />
in <strong>the</strong> south east arm <strong>of</strong> Lake Malawi and <strong>lake</strong> Malombe-Length based approach. FI:DP/MLW/86/013. Field Document<br />
19. 34p.<br />
Shepherd, J.G. 1982. A versatile new stock-recruitment relationship for <strong>fisheries</strong>, and <strong>the</strong> construction <strong>of</strong> sustainable yield curves.<br />
J. Cons. Int. Explor. Mer, 40: 67-75.<br />
Sipawe, R.D. 2001. Gear and species selectivity <strong>of</strong> <strong>the</strong> gill net fishery in Lake Malawi. pp 133 –141, In: Weyl, O.L.F. & Weyl,<br />
M.V. (eds) Lake Malawi Fisheries Management Symposium – Proceedings. 4 th – 9 th June 2001. NARMAP, Department<br />
<strong>of</strong> Fisheries, Malawi. 248 pp.<br />
Sissenwine, M.P. & Shepherd, J.G. 1987. An alternative perspective on recruitment overfishing and biological reference points.<br />
Can. J. Fish. Aquat. Sci. 44: 913-918.<br />
Smale, M.J., & Punt, A.E. 1991. Age and growth <strong>of</strong> <strong>the</strong> red steenbras Petrus rupestris (Pisces Sparidae) on <strong>the</strong> sou<strong>the</strong>ast coast <strong>of</strong><br />
South Africa. S. Afr. J. Mar. Sci. 9: 249-259.<br />
Trewawas, E. 1983. Tilapiine Fishes <strong>of</strong> <strong>the</strong> genera Saro<strong>the</strong>rodon, Oreochromis and Danakila. British Museum (Natural History)<br />
Publication No. 878. 583pp.<br />
Tweddle, D., Alimoso, S.B. & Sodzapanja, G. 1994a. Analysis <strong>of</strong> catch and effort data for <strong>the</strong> <strong>fisheries</strong> <strong>of</strong> <strong>the</strong> South East Arm <strong>of</strong><br />
Lake Malawi 1976-1989. Government <strong>of</strong> Malawi, Fisheries Department Bulletin No. 13.<br />
Weyl, O.L.F. 1998, The dynamics <strong>of</strong> a sub-tropical <strong>lake</strong> fishery in central Mozambique. PhD Thesis, Rhodes University, 202p.<br />
Weyl, O.L.F. 2001. Area <strong>management</strong> (area <strong>management</strong> committees) as a concept for PFM implementation – Discussion Paper.<br />
Appendix I(g), In: National Aquatic Resource Management Programme (NARMAP), Report on <strong>the</strong> participatory<br />
Fisheries Management programme (PFMP) strategy review workshiop. Sun ‘n’ Sand Holiday Resort, Mangochi, 30<br />
January – 1 February, 2001.<br />
Weyl, O.L.F., Banda, M., Sodzqabanja, G., Mwenekibombwe, L.H., Namoto, W. & Mponda, O.C. 2000. Annual Frame Survey,<br />
September 1999. Government <strong>of</strong> Malawi, Fisheries Bulletin No. 42.
156<br />
Lake Malawi Fisheries Management Symposium - Proceedings<br />
The nkacha fishery in Lake Malombe and <strong>the</strong> sou<strong>the</strong>ast arm <strong>of</strong> Lake Malawi<br />
M<strong>of</strong>fat M. Manase<br />
Malawi Fisheries Research Unit, PO Box 27, Monkey-Bay, MALAWI.Tel. +265 587 440/ 432. Email: fru@<strong>malawi</strong>.net.<br />
Abstract<br />
The nkacha net is an open water seine with a uniform mesh size ranging from 6 to 25 mm and is rectangular in shape. It is a main<br />
fishing gear <strong>of</strong> <strong>the</strong> small-scale fishery in Lake Malombe but is prohibited in Lake Malawi. However, this gear is used illegally in <strong>the</strong><br />
sou<strong>the</strong>ast arm <strong>of</strong> <strong>the</strong> <strong>lake</strong> since <strong>the</strong> mid 1990s. This study compares catch and effort data as well as <strong>the</strong> catch composition <strong>of</strong> <strong>the</strong> <strong>of</strong><br />
<strong>the</strong> nkacha net fishery for Lake Malombe and <strong>the</strong> sou<strong>the</strong>ast arm <strong>of</strong> Lake Malawi. Higher catch per unit effort (CPUE) in <strong>the</strong><br />
sou<strong>the</strong>ast arm as opposed to Lake Malombe might be <strong>the</strong> primary drive for this gear’s usage in Lake Malawi. Species size-classes<br />
caught in <strong>the</strong> sou<strong>the</strong>ast arm were considerably larger than <strong>of</strong> those species constituting catches from Lake Malombe. This suggests<br />
that catches from <strong>the</strong> sou<strong>the</strong>ast arm fetched higher market prices than Lake Malombe catches. Considering <strong>the</strong> impact <strong>of</strong> <strong>the</strong><br />
nkacha net with regard to growth over-fishing and habitat degradation, <strong>management</strong> recommendations are <strong>the</strong>refore made for this<br />
fishery.<br />
Introduction<br />
Lake Malombe has a maximum length <strong>of</strong> 29 km and a maximum width <strong>of</strong> 17 km with a maximum depth <strong>of</strong> 17 m<br />
and a surface area <strong>of</strong> about 390 km 2 (FAO, 1993). The <strong>lake</strong> is about 16 km from Lake Malawi through <strong>the</strong> Upper<br />
Shire River, and this makes it easier for fishers to migrate between Lake Malombe and <strong>the</strong> sou<strong>the</strong>ast arm <strong>of</strong> Lake<br />
Malawi (Figure 1).<br />
In <strong>the</strong> 1980s, <strong>the</strong> more valued chambo fishery (Oreochromis spp.) in Lake Malombe was reported to be in a state <strong>of</strong><br />
collapse and that <strong>the</strong> fishery was eventually replaced by a fishery for <strong>the</strong> less valued haplichromine cichlid species<br />
called kambuzi using open water seines called nkacha nets. Mesh size for this gear is uniform ranging from 6 mm to<br />
25 mm across <strong>the</strong> net panel. The nkacha net is operated by small-scale <strong>fisheries</strong> in Lake Malombe using small plank<br />
boats and dug out canoes. The operation <strong>of</strong> this gear does not involve use <strong>of</strong> light during night fishing. Recent<br />
studies on Lake Malombe indicate that this kambuzi fishery is also in a declining state (Banda & Hara 1994, Weyl<br />
1999, Weyl et al. 2001).<br />
Though nkacha gear is legal only in Lake Malombe, <strong>the</strong>re has been unprecedented increase in <strong>the</strong> use <strong>of</strong> this gear in<br />
Lake Malawi since <strong>the</strong> mid 1990s, particularly in <strong>the</strong> sou<strong>the</strong>ast arm <strong>of</strong> <strong>the</strong> <strong>lake</strong>. Operation <strong>of</strong> this gear in Lake<br />
Malawi is prohibited on account that <strong>the</strong> gear destroys nursery grounds for some important fish stocks, including <strong>the</strong><br />
chambo (Banda & Hara 1994). As such, this gear is likely to compromise <strong>the</strong> economic value <strong>of</strong> <strong>the</strong> <strong>fisheries</strong> <strong>of</strong><br />
Lake Malawi. The purpose <strong>of</strong> this study was to describe and compare <strong>the</strong> nkacha net fishery in Lake Malombe with<br />
that <strong>of</strong> <strong>the</strong> sou<strong>the</strong>ast arm <strong>of</strong> Lake Malawi in reference to catch rates, catch value, species and size composition. This<br />
study will aid in <strong>the</strong> development <strong>of</strong> appropriate <strong>management</strong> interventions that will go a long way towards<br />
safeguarding <strong>the</strong> existing high valued fish stocks <strong>of</strong> Lake Malawi.<br />
Materials and methods<br />
Data from research surveys undertaken by <strong>the</strong> Fisheries Research Unit <strong>of</strong> <strong>the</strong> Fisheries Department on Lake<br />
Malombe and <strong>the</strong> sou<strong>the</strong>ast arm <strong>of</strong> Lake Malawi were used. On each sampling day, gears were described by type,<br />
mesh size, gear length and mode <strong>of</strong> operation. Catch samples were selected at random and every fish in each sample<br />
was sorted to species level. Each species group was weighed and each fish in <strong>the</strong> sample was measured for total<br />
length (TL) to <strong>the</strong> nearest millimetre. Catch and effort data collected during routine monitoring surveys by <strong>the</strong><br />
Department <strong>of</strong> Fisheries for Lake Malombe and sou<strong>the</strong>ast arm <strong>of</strong> Lake Malawi for <strong>the</strong> period 1994-1999 were also<br />
used in this study to compare catch rates and catch value for <strong>the</strong>se water bodies. Methods used in <strong>the</strong> collection <strong>of</strong><br />
catch and fishing effort data from <strong>the</strong> traditional <strong>fisheries</strong> <strong>of</strong> Malawi followed <strong>the</strong> Malawi Traditional Fisheries<br />
(MTF) system described by FAO (1993).<br />
Results and discussion<br />
Ownership <strong>of</strong> nkacha gear is shown in Figure 2. The nkacha net fishery started booming up around 1993 in <strong>the</strong><br />
sou<strong>the</strong>ast arm <strong>of</strong> Lake Malawi and registered a high level <strong>of</strong> some 70 gears in 1999. This showed a sharp contrast<br />
with <strong>the</strong> situation <strong>of</strong> Lake Malombe where ownership <strong>of</strong> nkacha nets started decreasing from a high level <strong>of</strong> over<br />
300 gears in 1995 to a level <strong>of</strong> 164 in 1999. This suggests some driving force that has been attracting nkacha gear<br />
owners to operate in Lake Malawi apart from Lake Malombe where <strong>the</strong> gear is recommended.
157<br />
Lake Malawi Fisheries Management Symposium - Proceedings<br />
The species composition for <strong>the</strong> nkacha fishery in Lake Malombe is not distinct from <strong>the</strong> species composition <strong>of</strong> <strong>the</strong><br />
nkacha fishery <strong>of</strong> <strong>the</strong> sou<strong>the</strong>ast arm <strong>of</strong> Lake Malawi. Catch composition <strong>of</strong> <strong>the</strong> nkacha fishery in Lake Malombe as<br />
well as <strong>the</strong> sou<strong>the</strong>ast arm <strong>of</strong> Lake Malawi has been predominantly kambuzi species. The main species for nkacha<br />
fishery in Lake Malombe and <strong>the</strong> sou<strong>the</strong>ast arm <strong>of</strong> Lake Malawi include species belonging mainly to <strong>the</strong> genera<br />
Copadichromis, Lethrinops and Otopharynx (Figure 2).<br />
Figure 1. Map <strong>of</strong> <strong>the</strong> study area.<br />
No. <strong>of</strong> gears<br />
No. <strong>of</strong> gears<br />
80<br />
70<br />
60<br />
50<br />
40<br />
30<br />
20<br />
10<br />
0<br />
400<br />
300<br />
200<br />
100<br />
0<br />
93 94 95 96 97 98 99<br />
malombe<br />
93 94 95 96 97 98 99<br />
Figure 2. Ownership <strong>of</strong> nkacha nets in Lakes Malawi (sou<strong>the</strong>ast arm) and Malombe, 1993-1999.<br />
Year<br />
sou<strong>the</strong>ast arm<br />
Catch per unit <strong>of</strong> effort (CPUE) for nkacha net fishery in <strong>the</strong> sou<strong>the</strong>ast arm was significantly higher than that <strong>of</strong><br />
Lake Malombe between 1995 and 1997 (Figure 3). The highest CPUE <strong>of</strong> 140 kg per trip was attained in sou<strong>the</strong>ast<br />
arm nkacha net fishery in 1996. Relating <strong>the</strong> CPUE levels with catch value, catches from <strong>the</strong> sou<strong>the</strong>ast arm have<br />
been registering consistently high value. In 1999, <strong>the</strong> value <strong>of</strong> <strong>the</strong> catch reached a level <strong>of</strong> MK 1,400.00 per fishing<br />
trip whereas catch value from Lake Malombe was MK 1,175.00 per trip in <strong>the</strong> same year. This indicates that <strong>the</strong><br />
high catch rates in <strong>the</strong> sou<strong>the</strong>ast arm <strong>of</strong> Lake Malawi from 1995 might have attracted nkacha gear owners from Lake
158<br />
Lake Malawi Fisheries Management Symposium - Proceedings<br />
Malombe. These nkacha net operators have not withdrawn from sou<strong>the</strong>ast arm, despite high CPUE levels from 1997<br />
in Lake Malombe, due to low economic value <strong>of</strong> <strong>the</strong> harvested species in Lake Malombe (Table 1).<br />
a b<br />
Otopharynx<br />
agyrosoma<br />
7%<br />
O<strong>the</strong>rs<br />
26%<br />
Copadichromis<br />
virginalis<br />
11%<br />
Otopharynx<br />
tetrastigma<br />
16%<br />
Lethrinops<br />
'pinkhead'<br />
23%<br />
Copadichromis<br />
chrysonotus<br />
17%<br />
Bagrus meridionalis<br />
6%<br />
Ramphocromis spp<br />
6%<br />
Pseudotropheus<br />
20%<br />
Otopharynx<br />
argyrosoma<br />
10%<br />
Oreochromis spp<br />
9%<br />
Lethrinops<br />
'pinkhead'<br />
6%<br />
Figure 3. species catch composition for nkacha nets in a) Lake Malombe and b) <strong>the</strong> sou<strong>the</strong>ast arm <strong>of</strong><br />
Lake Malawi.<br />
Table 1. Mean beach price ± 95% confidence interval for kambuzi at landing sites at Lake Malombe and<br />
<strong>the</strong> sou<strong>the</strong>ast arm <strong>of</strong> Lake Malawi<br />
Lake Malombe Lake Malawi<br />
Year Mean<br />
(MK/kg)<br />
std n<br />
Mean<br />
(MK/kg)<br />
std n<br />
1994 1.16 1.04 1466 1.98 0.97 958<br />
1995 4.45 2.48 1590 4.62 2.60 782<br />
1996 4.23 1.43 928 4.92 1.88 309<br />
1997 4.87 1.70 652 5.42 2.02 442<br />
1998 5.86 2.99 877 11.49 3.96 379<br />
1999 9.00 4.11 1537 16.33 8.78 583<br />
Copadichromis<br />
virginalis<br />
43%<br />
O<strong>the</strong>r than catch rates, it appears that length frequency distributions <strong>of</strong> species could also be playing an attractive<br />
role for nkacha netters in Lake Malawi since <strong>the</strong> value <strong>of</strong> <strong>the</strong> harvested species is related to size <strong>of</strong> fish <strong>of</strong>fered for<br />
sale at <strong>the</strong> markets.<br />
For Copadichromis virginalis (utaka), most <strong>of</strong> <strong>the</strong> fish harvested from Lake Malombe were <strong>of</strong> 65 mm TL whereas<br />
those from <strong>the</strong> sou<strong>the</strong>ast arm registered 110 mm TL (Figure 5). On <strong>the</strong> o<strong>the</strong>r hand, Otopharynx argyrosoma, ano<strong>the</strong>r<br />
Kambuzi species, registered 60 mm TL in <strong>the</strong> sou<strong>the</strong>ast arm <strong>of</strong> Lake Malawi compared to 65 mm TL from Lake<br />
Malombe and a good number <strong>of</strong> fish sampled in sou<strong>the</strong>ast arm registered over 80 mm TL (Figure 6). In overall<br />
terms, mean lengths for Otopharynx argyrosoma were 69 mm TL and 64 mm TL in sou<strong>the</strong>ast arm <strong>of</strong> Lake Malawi<br />
and Lake Malombe respectively (Table 2). As for Lethrinops ‘pinkhead’ (Figure 7), <strong>the</strong> catches from sou<strong>the</strong>ast arm<br />
registered 90 mm TL whereas those from Lake Malombe registered 60 mm TL. Interestingly, a relatively high<br />
proportion <strong>of</strong> <strong>the</strong> catch from nkacha net fishery operating in <strong>the</strong> sou<strong>the</strong>ast arm <strong>of</strong> Lake Malawi constituted chambo<br />
(Table 1). Although chambo registered only 9% <strong>of</strong> this gear’s total catch, <strong>the</strong> situation is more threatening<br />
considering <strong>the</strong> fact that small sized individuals <strong>of</strong> chambo, locally known as kasawala, were targeted (Figure 8).
159<br />
Lake Malawi Fisheries Management Symposium - Proceedings<br />
Figure 4. Nkacha net (A) catch per unit effort ± 95 % confidence intervals and (B) Mean catch value in<br />
Malawi Kwacha in Lake Malombe and <strong>the</strong> sou<strong>the</strong>ast arm <strong>of</strong> Lake Malawi from 1994 to 1999.<br />
Frequency<br />
CPUE (Kg per trip)<br />
Catch Value (MK/trip)<br />
Frequency<br />
140<br />
120<br />
100<br />
300<br />
250<br />
200<br />
150<br />
100<br />
50<br />
200<br />
150<br />
100<br />
80<br />
60<br />
40<br />
20<br />
0<br />
50<br />
0<br />
0<br />
1500<br />
1250<br />
1000<br />
750<br />
500<br />
250<br />
0<br />
20<br />
20<br />
(A)<br />
(B)<br />
40<br />
40<br />
Figure 5. Length frequency distribution <strong>of</strong> Copadichromis virginalis (Utaka)<br />
60<br />
60<br />
80<br />
80<br />
100<br />
100<br />
Year<br />
120<br />
120<br />
Length mm TL<br />
Lake Malombe<br />
Sou<strong>the</strong>ast arm<br />
94 95 96 97 98 99<br />
sou<strong>the</strong>ast arm<br />
140<br />
malombe<br />
140<br />
160<br />
160<br />
180<br />
180<br />
200<br />
200
Frequency<br />
Frequency<br />
Figure 6. Length frequency distributions <strong>of</strong> Otopharynx argyrosoma (Kambuzi)<br />
35<br />
30<br />
25<br />
20<br />
15<br />
10<br />
5<br />
0<br />
sou<strong>the</strong>ast arm<br />
30 50 70 90 110 130 150 170<br />
1000<br />
Frequency<br />
Frequency<br />
120<br />
100<br />
80<br />
60<br />
40<br />
20<br />
0<br />
600<br />
500<br />
400<br />
300<br />
200<br />
100<br />
0<br />
800<br />
600<br />
400<br />
200<br />
0<br />
20<br />
20<br />
40<br />
40<br />
malombe<br />
30 50 70 90 110 130 150 170 190<br />
Length mm TL<br />
Figure 7. Length frequency distributions <strong>of</strong> Lethrinops ‘pinkhead’ (Kambuzi).<br />
60<br />
60<br />
80<br />
80<br />
100<br />
100<br />
120<br />
160<br />
Lake Malawi Fisheries Management Symposium - Proceedings<br />
sou<strong>the</strong>ast arm<br />
140<br />
malombe<br />
120<br />
Length mm TL<br />
140<br />
160<br />
160<br />
180<br />
180<br />
200<br />
200
Frequency<br />
20<br />
15<br />
10<br />
5<br />
0<br />
20<br />
40<br />
60<br />
80<br />
161<br />
Lake Malawi Fisheries Management Symposium - Proceedings<br />
Figure 8: size distribution for juvenile Oreochromis sp. caught in <strong>the</strong> sou<strong>the</strong>ast arm<br />
100<br />
120<br />
Length mm TL<br />
sou<strong>the</strong>ast arm<br />
According to breeding studies done on chambo in <strong>the</strong> sou<strong>the</strong>ast arm <strong>of</strong> Lake Malawi, length at maturity for this<br />
species is 200 mm TL (Palsson et al. 1999), and this was not reflected in <strong>the</strong> individuals <strong>of</strong> chambo caught by <strong>the</strong><br />
nkacha net fishery. Most <strong>of</strong> <strong>the</strong> species registered 110 mm TL at capture, with a length range <strong>of</strong> 40 to 145 mm TL<br />
(Figure 8). This indicates that <strong>the</strong> nkacha net fishery was targeting immature fish in this area. Chambo, being one <strong>of</strong><br />
<strong>the</strong> threatened fish species in Malawi, <strong>the</strong>refore deserves appropriate exploitation regimes that would seek<br />
sustainable harvesting <strong>of</strong> this important fishery (Alimoso, 1987).<br />
Table 2. Mean length TL mm, 95% confidence interval for <strong>the</strong> species caught in sou<strong>the</strong>ast arm <strong>of</strong> Lake<br />
Malawi and from Lake Malombe.<br />
Species Lake Malawi Lake Malombe<br />
mean 95%CI n mean 95%CI n<br />
Copadichromis virginalis 96.18 1.27 1012 70.82 0.83 1260<br />
Otopharynx argyrosoma 69.42 1.31 782 64.70 0.52 2971<br />
Lethrinops 'pinkhead' 89.84 3.53 125 67.76 0.82 2761<br />
Oreochromis spp. 96.06 4.66 107 NA NA NA<br />
Size distributions for target species <strong>of</strong> nkacha in <strong>the</strong> sou<strong>the</strong>ast arm <strong>of</strong> Lake Malawi were generally larger that those<br />
<strong>of</strong> Lake Malombe (Table 2). This implies that <strong>the</strong> market value <strong>of</strong> fish from Lake Malawi was superior to those <strong>of</strong><br />
Lake Malombe. Based on this scenario, it appears market forces are among <strong>the</strong> main factors that relate to <strong>the</strong><br />
continued existence <strong>of</strong> nkacha net fishery in <strong>the</strong> sou<strong>the</strong>ast arm <strong>of</strong> Lake Malawi although this gear is illegal in this<br />
area. This could be supported by <strong>the</strong> fact that small-scale fishers are increasingly becoming business-orientated in<br />
nature o<strong>the</strong>r than subsisting on <strong>the</strong>ir fishing operations (Turner and Mdaihli, 1992).<br />
It is also vital to consider that managing <strong>the</strong> nkacha fishery in Malawi has a considerable level <strong>of</strong> difficulty in <strong>the</strong><br />
sense that it is legal to operate nkacha gear in Lake Malombe but illegal to operate in Lake Malawi, a nearby water<br />
body. Such types <strong>of</strong> regulations are complex bearing in mind <strong>the</strong> many attributes that one would expect to be<br />
accomplished by <strong>the</strong> <strong>fisheries</strong> enforcement section <strong>of</strong> <strong>the</strong> Department <strong>of</strong> Fisheries.<br />
Fur<strong>the</strong>rmore, <strong>the</strong> nkacha net fishery promotes loss <strong>of</strong> nesting habitat for sand nesting cichlids due to scouring effect<br />
<strong>of</strong> <strong>the</strong> gear (Banda and Hara, 1994). The problems <strong>of</strong> <strong>the</strong> nkacha net fishery will eventually lead to loss <strong>of</strong><br />
biodiversity <strong>of</strong> Lake Malawi’s fish fauna and flora if proper <strong>management</strong> interventions are not put in place and<br />
followed. Against this background, <strong>management</strong> options for nkacha net fishery would include complete withdrawal<br />
<strong>of</strong> all nkacha netters and all small-meshed seine nets from Lake Malawi. Fur<strong>the</strong>rmore, a review <strong>of</strong> all existing<br />
<strong>fisheries</strong> regulations seems pertinent with regard to conflicting interests among stakeholders <strong>of</strong> <strong>the</strong> <strong>fisheries</strong><br />
resources <strong>of</strong> Malawi.<br />
There is adequate evidence that migration <strong>of</strong> nkacha netters does occur between Lake Malombe and <strong>the</strong> sou<strong>the</strong>ast<br />
arm <strong>of</strong> Lake Malawi due to <strong>the</strong>ir close proximity to each o<strong>the</strong>r. This scenario can also be attributed to a lack <strong>of</strong><br />
effective enforcement <strong>of</strong> <strong>fisheries</strong> regulations and <strong>the</strong>refore calls for multi-sectoral collaboration in <strong>the</strong> <strong>management</strong><br />
<strong>of</strong> <strong>fisheries</strong> resources <strong>of</strong> Malawi.<br />
140<br />
160<br />
180<br />
200
162<br />
Lake Malawi Fisheries Management Symposium - Proceedings<br />
Acknowledgements<br />
The author extends gratitude to <strong>the</strong> following sponsors- GTZ assisted National Aquatic Resource Management<br />
Programme (NARMAP), Icelandic International Development Agency (ICEIDA) and Fisheries Research Fund<br />
(FRF) for financing target oriented research surveys that yielded <strong>the</strong> data used in this report. Special regards also<br />
extend to fellow researchers at Monkey-Bay Fisheries Research Station for <strong>the</strong>ir valuable criticisms as well as pro<strong>of</strong><br />
reading <strong>of</strong> <strong>the</strong> manuscript. Special thank you goes to Dr Olaf Weyl, NARMAP Research Adviser, for fruitful<br />
contributions.<br />
References<br />
Alimoso SB, 1987 An Assessment <strong>of</strong> <strong>the</strong> effects <strong>of</strong> traditional fishing on Chambo (Oreochromis spp.) in Lake<br />
Malombe. LUSO: J.Sci. Techn. (Malawi) (1987) 8 (1&2) :1-10.<br />
Alimoso SB and Tweddle D, 1994 Seine net <strong>fisheries</strong> <strong>of</strong> Lake Malombe. Traditional Fisheries Assessment Project<br />
Working Paper TFAP/1.<br />
Banda MC and Hara MM, 1994 Seine nets and habitat degradation: How <strong>the</strong>y have caused collapse <strong>of</strong> <strong>the</strong> Chambo<br />
(Oreochromis spp.) fishery <strong>of</strong> Lake Malombe and <strong>the</strong> Upper Shire.<br />
Bazigos GP, 1972 The Improvement <strong>of</strong> <strong>the</strong> Malawian <strong>fisheries</strong> Statistical system. A report to <strong>the</strong> integrated project.<br />
FAO/MLW/16. Zomba, Malawi.<br />
FAO, 1993. Fisheries <strong>management</strong> in <strong>the</strong> sou<strong>the</strong>ast arm <strong>of</strong> Lake Malawi, <strong>the</strong> Upper Shire<br />
River and Lake Malombe, with particular reference to <strong>the</strong> <strong>fisheries</strong> <strong>of</strong> chambo (Oreochromis spp.) CIFA<br />
Tech. Pap. 21, Rome FAO. 113p.<br />
Palsson OK, Bulirani A and Banda M 1999 A review <strong>of</strong> biology, <strong>fisheries</strong> and population dynamics <strong>of</strong> chambo<br />
(Oreochromis spp., CICHLIDAE) in Lakes Malawi and Malombe. Fisheries Bulletin No.38. Fisheries<br />
Department. Malawi<br />
Turner G.F. and Mdaihli M. 1992 A Bioeconomic Analysis <strong>of</strong> <strong>the</strong> Industrial and Semi-Industrial Fisheries <strong>of</strong><br />
Sou<strong>the</strong>rn Lake Malawi. FI:DP/MLW/86/013 Field Document 22, July 1992.<br />
Weyl, O.L.F. 1999. Lake Malombe artisanal fishery catch assessment 1994-1998. NARMAP Technical Report No.<br />
1. 23p.<br />
Weyl, O.L.F., Banda, M.C., Manase, M.M., Namoto, W. & Mwenekibombwe, L.H. 2001. Analysis <strong>of</strong> catch and<br />
effort data for <strong>the</strong> <strong>fisheries</strong> <strong>of</strong> Lake Malombe, 1976-1999. Fisheries Bulletin No. 45.
163<br />
Lake Malawi Fisheries Management Symposium - Proceedings<br />
The state <strong>of</strong> <strong>the</strong> large scale commercial <strong>fisheries</strong> on Lake Malawi<br />
Moses Banda<br />
Fisheries Research Unit, P.O. Box 27, Monkey Bay, MALAWI-AFRICA. Tel. 265-587-432, E-mail: fru@<strong>malawi</strong>.net.<br />
Abstract<br />
The large-scale commercial <strong>fisheries</strong> are mechanised and based in <strong>the</strong> sou<strong>the</strong>rn part <strong>of</strong> <strong>the</strong> <strong>lake</strong>. This report is based on <strong>the</strong> data<br />
collected from monitoring surveys as well as an analysis <strong>of</strong> <strong>fisheries</strong> statistics in <strong>the</strong> past decade. The data were analysed by area<br />
and depth ranges: shallow < 50 m, 51-100 m and very deep >100 m. The catch was dominated by cichlids and <strong>the</strong> cpue decreased<br />
with increasing in depth in both areas. Biomass estimates based swept area methods and <strong>the</strong> principal precautionary approach<br />
indicate that <strong>the</strong> fishery is not overexploited.<br />
Key words: Large-scale fishery, biomass, swept area method, principal precautionary approach.<br />
Introduction<br />
The large-scale commercial <strong>fisheries</strong> in Lake Malawi are mechanised and capital intensive and use mainly trawling<br />
and purse seining (‘ring net’). The fishery consists <strong>of</strong> pair trawlers, (wooden boats about 8 m long with a 20-40 hp<br />
inboard engine), stern trawler (90-385 hp) units and ring nets (90 hp), which are confined to <strong>the</strong> sou<strong>the</strong>rn part <strong>of</strong> <strong>the</strong><br />
<strong>lake</strong>. The origins <strong>of</strong> <strong>the</strong> large-scale commercial fishery can be traced back as early as 1943 when purse seining<br />
started for chambo in <strong>the</strong> south east arm by <strong>the</strong> Europeans (FAO, 1976). In <strong>the</strong> mid 1960s experimental trawling led<br />
to <strong>the</strong> establishment <strong>of</strong> a pair trawl fishery to harvest <strong>the</strong> demersal <strong>fisheries</strong> in <strong>the</strong> shallow parts <strong>of</strong> <strong>the</strong> south east arm<br />
in 1968 (Tarbit, 1972). This fishery developed rapidly in <strong>the</strong> shallow waters <strong>of</strong> <strong>the</strong> sou<strong>the</strong>rn part <strong>of</strong> <strong>the</strong> <strong>lake</strong> and in<br />
1976 it was established on <strong>the</strong> western side <strong>of</strong> <strong>the</strong> <strong>lake</strong>. The more powerful stern trawlers were introduced in 1972<br />
for bottom trawling (85 hp) and in 1976 for mid water trawling (180 hp) in <strong>the</strong> south east arm (FAO, 1976; Turner,<br />
1977). Four bottom trawlers have joined <strong>the</strong> fishery since <strong>the</strong>n; one started fishing in <strong>the</strong> same area in 1983; <strong>the</strong><br />
o<strong>the</strong>r two in 1997 and <strong>the</strong> fourth one in 1998 (Banda, 2000). There are five stern trawlers now operating, although a<br />
new 380 hp boat replaced one bottom trawler. Bottom trawling was restricted to depths ranging between 50 and<br />
70 m, but it has been expanded to deeper water (up to 100 m) by <strong>the</strong> two new powerful boats (380 hp). The reported<br />
average large-scale commercial catch is currently around 5,600 tons per annum, approximately 21% <strong>of</strong> <strong>the</strong> total<br />
annual fishing landings from Lake Malawi.<br />
The <strong>management</strong> framework <strong>of</strong> <strong>the</strong> commercial fishery is based on <strong>the</strong> recommendations from monitoring<br />
programmes carried out by <strong>the</strong> Fisheries Department, which include <strong>the</strong> assessment <strong>of</strong> sustainable yields and<br />
allowable effort through biomass surveys, and <strong>the</strong> investigation <strong>of</strong> changes in <strong>the</strong> species composition <strong>of</strong> <strong>the</strong> catches<br />
and size distribution. Sustainable yields were estimated from <strong>the</strong> data for <strong>the</strong> fishing areas using <strong>the</strong> Schaefer (1954)<br />
surplus production model with <strong>the</strong> assumption <strong>of</strong> equilibrium conditions (Pitcher and Hart, 1982). However,<br />
continuous changes in species composition and population structure render this assumption invalid (Turner, 1995).<br />
Consequently, <strong>the</strong> precautionary principle was used as stock status indicator to generate interim <strong>management</strong><br />
measures in <strong>the</strong> absence <strong>of</strong> stock assessment. The monitoring surveys were started in <strong>the</strong> early 1970s and have<br />
continued to date with some discontinuation (FAO, 1976; Turner, 1977; FAO, 1993; Turner, 1995; Banda et al.,<br />
1996; Banda and Tómasson, 1997; Pálsson et al. 1999).<br />
The fishing regulations include restriction on <strong>the</strong> number <strong>of</strong> licences to be issued in each demarcated area and <strong>the</strong><br />
minimum mesh size <strong>of</strong> <strong>the</strong> trawl cod-end to be used. At present <strong>the</strong> number <strong>of</strong> <strong>the</strong> fishing fleet is 100% i.e. all<br />
licences have been issued, although not all are operational, especially <strong>the</strong> pair trawl units. The stern trawlers are<br />
licensed to fish waters greater than 50 m and <strong>the</strong> pair trawlers between 18 and 50 m water depth, or not less than one<br />
nautical mile from <strong>the</strong> shoreline. The recommended mesh sizes for <strong>the</strong> gears are 102 mm for <strong>the</strong> ring nets and<br />
38 mm for o<strong>the</strong>r vessels.<br />
In this study, data from monitoring surveys and historical trends <strong>of</strong> catch and effort from <strong>the</strong> commercial fishery<br />
have been analysed to assess <strong>the</strong> state <strong>of</strong> <strong>the</strong> commercial <strong>fisheries</strong> with particular reference to changes in species<br />
composition, mean size and catch rates. The results could be used to improve current and future <strong>management</strong> <strong>of</strong> <strong>the</strong><br />
commercial fishery.
Materials and methods<br />
164<br />
Lake Malawi Fisheries Management Symposium - Proceedings<br />
Monitoring trawl survey<br />
The data in this study were collected during <strong>the</strong> ongoing regular stock assessment surveys carried out by <strong>the</strong><br />
Fisheries Department in <strong>the</strong> south east arm (SEA) and south west arm (SWA) <strong>of</strong> <strong>the</strong> <strong>lake</strong> (Figure 1). These surveys<br />
were designed to monitor changes taking place in <strong>the</strong> sou<strong>the</strong>rn part <strong>of</strong> <strong>the</strong> <strong>lake</strong>, which is heavily exploited. The 17 m<br />
long Fisheries Department research vessel, Ndunduma powered with a 380 hp engine which pulls a Gulloppur<br />
bottom trawl net with a 23 m headrope and a 38 mm mesh cod end was used. The effective mesh size in <strong>the</strong> cod end<br />
was 4 mm due to <strong>the</strong> net liner used to ensure that escape through <strong>the</strong> meshes was minimal.<br />
A total <strong>of</strong> 97 fixed trawl stations (54 in <strong>the</strong> SEA and 43 in SWA) were sampled during each survey. The stations<br />
were stratified into shallow 0-50 m, deep 50-100 m and very deep 100-150 m (Figure 1). Each trawl lasted for 30<br />
minutes. All trawling was done during <strong>the</strong> day at depths between 10– 150 m; it was not possible to sample in water<br />
less than 10 m deep because <strong>of</strong> restrictions imposed by <strong>the</strong> draught <strong>of</strong> <strong>the</strong> vessel.<br />
Latitude<br />
-14.4 -14.2 -14.0 -13.8<br />
34.60 34.75 34.90<br />
Longitude<br />
35.05 35.20<br />
Figure 1. Map <strong>of</strong> sou<strong>the</strong>rn <strong>of</strong> Lake Malawi showing <strong>the</strong> sampling stations used in <strong>the</strong> monitoring<br />
surveys.<br />
The catch was sorted into four categories: Clariid catfish, Bagrus meridionalis, small cichlids and o<strong>the</strong>rs (including<br />
cyprinids, mormyrids and large cichlids such as Buccochromis spp. and Oreochromis spp.). Each <strong>of</strong> <strong>the</strong>m was<br />
measured on board <strong>the</strong> vessel to <strong>the</strong> nearest 0.5 cm (total length) and most fish were weighed to <strong>the</strong> nearest 0.01 kg<br />
and those that were not weighed individually were collectively weighed as a species group to <strong>the</strong> nearest 0.1 kg.<br />
The catch per unit effort (C/f) assumed as index <strong>of</strong> abundance was expressed as:<br />
C/f = catch (kg) /swept area (ha),<br />
SEA<br />
and sustainable yields were estimated to be 40% <strong>of</strong> <strong>the</strong> stock biomass (Banda et al. 1996).
165<br />
Lake Malawi Fisheries Management Symposium - Proceedings<br />
Commercial trawl data<br />
The catch and effort data from monthly-submitted returns <strong>of</strong> <strong>the</strong> commercial fishing companies from 1980 to 2000<br />
were used in this analysis. Four datasets were summarised according to <strong>the</strong> operational fishing method: inshore<br />
demersal (pair trawlers), <strong>of</strong>fshore demersal (stern bottom trawlers), midwater (midwater trawlers) and ringnet<br />
(chambo) <strong>fisheries</strong>. Trends in effort were described using boat-days and trends in cpue using catch/day except for<br />
<strong>the</strong> purse seines. The effort for <strong>the</strong> purse seine were expressed as pulls and cpue and catch/pull. Effort for all <strong>the</strong><br />
<strong>fisheries</strong> has been standardised according to Sparre and Venema (1992) because fishing power has changed with<br />
time.<br />
The precautionary reference points for <strong>the</strong> exploitation <strong>of</strong> <strong>the</strong> <strong>fisheries</strong> resources using standardised cpue as an<br />
estimator <strong>of</strong> stock biomass or size was adopted as described in Bulirani (et al. 1999). Four reference points were<br />
calculated: maximum biomass (Bmax ), biomass at precautionary approach (Bpa), biomass limit (Blim) and current<br />
biomass point estimate (Bcur). The mean cpue over a period <strong>of</strong> relatively high cpue represented maximum biomass<br />
(Bmax) and 45% <strong>of</strong> <strong>the</strong> Bmax was considered as Bpa, a precautionary point where <strong>management</strong> must be undertaken.<br />
Blim was calculated as 20% <strong>of</strong> <strong>the</strong> Bmax and was considered as a point where <strong>management</strong> must be undertaken and<br />
Bcur was defined as <strong>the</strong> current level <strong>of</strong> biomass (cpue) relative to Bmax.<br />
Results<br />
Monitoring surveys<br />
The catch composition<br />
The dominant species (by weight) throughout <strong>the</strong> surveys are shown in Figure 2. Copadichromis virginalis,<br />
Otopharynx argyrosoma, Oreochromis spp, Bagrus meridionalis and Bathyclarias species were <strong>the</strong> dominant<br />
species groups in <strong>the</strong> shallow waters <strong>of</strong> both arms <strong>of</strong> <strong>the</strong> <strong>lake</strong> (Figure 3). Lethrinops longipinnis and C. eucinostomus<br />
were also important in <strong>the</strong> south west arm <strong>of</strong> <strong>the</strong> <strong>lake</strong>. Years <strong>of</strong> high catches <strong>of</strong> C. virginalis coincided with low<br />
catches <strong>of</strong> C. eucinostomus and visa versa. Capadichromis virginalis, Bagrus meridionalis, Bathyclarias spp.<br />
Diplotaxodon limnothrisa, Lenthrinops gossei, L. oliveri, L. alba and Synodontis njassae remained generally an<br />
important component <strong>of</strong> <strong>the</strong> catch throughout <strong>the</strong> surveys in <strong>the</strong> deep waters <strong>of</strong> <strong>the</strong> sou<strong>the</strong>rn part <strong>of</strong> <strong>the</strong> <strong>lake</strong> (Fig.4).<br />
Catch per unit <strong>of</strong> effort (cpue)<br />
The cpue for each year is shown in Figures 5 & 6 and where <strong>the</strong>re was more than one survey conducted an average<br />
cpue was calculated. The mean cpue in shallow water from <strong>the</strong> SEA and SWA were 931.5 and 714.7 kg hr -1 ,<br />
respectively, and were significantly different (t-test, p < 0.05) while that from <strong>the</strong> water depth > 50 m was 849.5 and<br />
532.1 kg hr -1 , respectively, which was also significantly different (t-test, p < 0.05). The cpue in <strong>the</strong> shallow water <<br />
50 m show a general decline since 1995 in <strong>the</strong> SEA and 1994 in <strong>the</strong> SWA (Figure 5). In contrast, <strong>the</strong> cpue in waters<br />
> 100 m seemed to have no proper trend in both arms (Figure 6).<br />
Biomass<br />
The biomass estimates and calculated MSY are shown in table 1. The biomass and MSY estimates <strong>of</strong> <strong>the</strong> SEA were<br />
generally greater than those from <strong>the</strong> SWA. Similarly, <strong>the</strong> biomass and MSY estimates are greater in waters < 50 m<br />
than in waters > 50 m in both arms.<br />
Table 1. Biomass and Maximum Sustainable Yield (MSY) estimates from RV. Ndunduma surveys in <strong>the</strong><br />
sou<strong>the</strong>rn part <strong>of</strong> Lake Malawi from 1994 to 2000.<br />
SEA SWA<br />
0-50 m > 50 m 0-50 m > 50 m<br />
Biomass 7230 8410 3130 6190<br />
MSY 2890 3360 1250 2480
o<strong>the</strong>rs Diplotaxodon<br />
limnothrisa<br />
Otopharynx<br />
argyrosoma<br />
166<br />
Lake Malawi Fisheries Management Symposium - Proceedings<br />
Figure 2. Species composition <strong>of</strong> <strong>the</strong> bottom trawl catch in <strong>the</strong> sou<strong>the</strong>rn part <strong>of</strong> Lake Malawi from<br />
surveys from 1994 to 2000.<br />
o<strong>the</strong>rs<br />
Bagrus<br />
meridionalis<br />
Bathyclarias<br />
spp.<br />
Lethrinops<br />
gossei<br />
Oreochromis<br />
species<br />
Copadichromis<br />
virginalis<br />
Figure 3. Species composition <strong>of</strong> <strong>the</strong> bottom trawl catch in <strong>the</strong> shallow waters (0-50 m) <strong>of</strong> <strong>the</strong> sou<strong>the</strong>rn<br />
part <strong>of</strong> Lake Malawi from surveys from 1994 to 2000.<br />
O<strong>the</strong>rs<br />
Letnrinopd alba<br />
Lethrinops<br />
oliveri<br />
Bagrus<br />
meridionalis<br />
Bathyclarias<br />
spp.<br />
Oreochromis<br />
species<br />
Copadichromis<br />
virginalis<br />
Otopharynx<br />
argyrosoma<br />
Copadichromis<br />
eucinostomus<br />
Bagrus<br />
meridionalis<br />
Bathyclarias<br />
spp.<br />
Lethrinops<br />
gossei<br />
Synodontis<br />
njassae<br />
Diplotaxodon<br />
limnothrissa<br />
Copadichromis<br />
virginalis<br />
Figure 4. Species composition <strong>of</strong> <strong>the</strong> bottom trawl catch in <strong>the</strong> shallow waters (0-50 m) <strong>of</strong> <strong>the</strong> sou<strong>the</strong>rn<br />
part <strong>of</strong> Lake Malawi morning surveys from 1994 to 2000.
Catch rate (kg/hr)<br />
1400<br />
1200<br />
1000<br />
800<br />
600<br />
400<br />
200<br />
167<br />
Lake Malawi Fisheries Management Symposium - Proceedings<br />
Figure 5. The mean catch rate (kg/hr) made from RV. Ndunduma surveys from 1994 to 2000 in waters<br />
(0-50m) <strong>of</strong> <strong>the</strong> sou<strong>the</strong>rn part <strong>of</strong> Lake Malawi.<br />
Catch rate (kg/hr)<br />
Figure 6. The mean catch rate (kg/hr) made from RV. Ndunduma surveys from 1994 to 2000 in waters (><br />
50 m) <strong>of</strong> <strong>the</strong> sou<strong>the</strong>rn part <strong>of</strong> Lake Malawi.<br />
Commercial <strong>fisheries</strong> catch and effort data<br />
0<br />
1200<br />
1000<br />
800<br />
600<br />
400<br />
200<br />
1994 1995 1996<br />
Year<br />
1997 1998 1999 2000<br />
Sea Sw a<br />
0<br />
1994 1995 1996 1997 1998 1999 2000<br />
Year<br />
Sea Sw a<br />
Pair trawl fishery<br />
The catches <strong>of</strong> <strong>the</strong> pair trawl fishery have been relatively stable between 1980 and 1988, and peaked up in 1990 to<br />
about 1 700 tons in <strong>the</strong> south east arm and since <strong>the</strong>n <strong>the</strong>re has been a general decline. The sudden drop in catch in<br />
1993 was due to <strong>the</strong> closure <strong>of</strong> <strong>the</strong> fishery in Area A, south <strong>of</strong> Boadzulu Island (Figure 1). The cpue and effort<br />
showed a similar pattern to that <strong>of</strong> <strong>the</strong> catch. In contrast, <strong>the</strong> catches in SWA increased from lowest levels <strong>of</strong> about<br />
150 tons in 1980 to highest levels <strong>of</strong> about 2 200 tons in 1988 and <strong>the</strong>n stabilised around 1 500 tons between 1989<br />
and 1994. After 1994, <strong>the</strong> catches have dropped down to levels <strong>of</strong> about 600 tons and have remained relatively<br />
stable since <strong>the</strong>n. The effort has followed <strong>the</strong> same pattern as <strong>the</strong> catch while <strong>the</strong> catch rates have remained relative<br />
constant around 1.2 tons a day from 1980 to 2000. The Surplus Production Models did not fit <strong>the</strong> data as a result <strong>the</strong>
168<br />
Lake Malawi Fisheries Management Symposium - Proceedings<br />
precautionary approach principle was applied (Table 2). The pair trawl fishery in <strong>the</strong> SEA operates close to Bpa<br />
while that in <strong>the</strong> SWA above Bpa and hence no need for immediate action.<br />
Table 2. Precautionary approach reference points for various large scale commercial <strong>fisheries</strong> in <strong>the</strong><br />
sou<strong>the</strong>rn part <strong>of</strong> Lake Malawi. PTF = pair trawl fishery, SBTF = stern bottom trawl fishery, MWTF =<br />
midwater trawl fishery and Ring net fishery.<br />
PTF PTF SBTF MWTF RNF<br />
Reference points SEA SWA SEA SEA SEA<br />
Bmax 1.5 1.5 1.5 1.3 1.5<br />
Bpa 0.7 0.7 0.7 0.6 0.7<br />
Blim 0.4 0.4 0.4 0.3 0.4<br />
Bcur 0.8 1.1 0.7 0.8 0.4<br />
(a)<br />
Effort and CPUE<br />
Effort and CPUE<br />
(b)<br />
2.0<br />
1.5<br />
1.0<br />
0.5<br />
0.0<br />
2.0<br />
1.8<br />
1.6<br />
1.4<br />
1.2<br />
1.0<br />
0.8<br />
0.6<br />
0.4<br />
0.2<br />
0.0<br />
80 81 82 83 84 85 86 87 88 89 90 91 92 93 94 95 96 97 98 99 00<br />
Year<br />
Yie ld Relative cpue No rmo lis ed effo rt<br />
80 81 82 83 84 85 86 87 88 89 90 91 92 93 94 95 96 97 98 99 00<br />
Year<br />
Figure 7. Catch, effort and CPUE in Pair trawl fishery in (a) south east arm and (b) south west arm <strong>of</strong><br />
Lake Malawi from 1980 to 2000.<br />
1600<br />
1400<br />
1200<br />
1000<br />
800<br />
600<br />
400<br />
200<br />
0<br />
Yield Relative cpue Normalised effort<br />
2500<br />
2000<br />
1500<br />
1000<br />
500<br />
0<br />
Catch (tonnes)<br />
Catch (tonnes)
169<br />
Lake Malawi Fisheries Management Symposium - Proceedings<br />
Stern bottom trawl fishery<br />
The catches <strong>of</strong> <strong>the</strong> demersal <strong>fisheries</strong> based in <strong>the</strong> SEA reached <strong>the</strong> highest levels <strong>of</strong> around 2 400 tons in 1984 and<br />
<strong>the</strong>n since it started declining reaching levels below 400 tons in 1993 (Figure 8). After 1993 <strong>the</strong> catch rose to<br />
2 100 tons in 1995 and since <strong>the</strong>n it has stabilised to around 1 500 tons/year. The trend <strong>of</strong> effort follows that <strong>of</strong> <strong>the</strong><br />
catch while <strong>the</strong> catch rates indicate a down trend since <strong>the</strong> early 1980s. The Surplus Production Models did not fit<br />
<strong>the</strong> data as a result <strong>the</strong> precautionary approach principle was applied (Table 2). The stern bottom trawl fishery in <strong>the</strong><br />
SEA currently operates at Bpa which calls for immediate action.<br />
Midwater trawl fishery<br />
The midwater fishery catches, which is also confined in <strong>the</strong> SEA were relatively stable between 1980 and 1992 and<br />
ranged between 1 500 and 2 200 (Figure 9). The total catch dropped to half in 1993 and has steadily increased since<br />
<strong>the</strong>n. The catch rates trend was similar to that <strong>of</strong> <strong>the</strong> total catches. The total effort has been stable throughout except<br />
in 1997 (Figure 9). The Surplus Production Models did not fit <strong>the</strong> data as a result <strong>the</strong> precautionary approach<br />
principle was applied (Table 2). The stern bottom trawl fishery in <strong>the</strong> SEA currently operates above Bpa and hence<br />
no need for immediate action.<br />
Effort and CPUE<br />
2.0<br />
1.8<br />
1.6<br />
1.4<br />
1.2<br />
1.0<br />
0.8<br />
0.6<br />
0.4<br />
0.2<br />
0.0<br />
80 81 82 83 84 85 86 87 88 89 90 91 92 93 94 95 96 97 98 99 00<br />
Year<br />
Figure 8. Catch, effort and CPUE in stern bottom trawl fishery in <strong>the</strong> south east arm <strong>of</strong> Lake Malawi from<br />
1980 to 2000.<br />
Effort and CPUE<br />
1.8<br />
1.6<br />
1.4<br />
1.2<br />
1.0<br />
0.8<br />
0.6<br />
0.4<br />
0.2<br />
0.0<br />
Total Yield Relative cpue Normalised effort<br />
80 81 82 83 84 85 86 87 88 89 90 91 92 93 94 95 96 97 98 99 100<br />
Year<br />
Total yield Rel. cpue Norm. effort<br />
Figure 9. Catch, effort and CPUE in midwater trawl fishery in <strong>the</strong> south east arm <strong>of</strong> Lake Malawi from<br />
1980 to 2000.<br />
2500<br />
2000<br />
1500<br />
1000<br />
500<br />
0<br />
3000<br />
2500<br />
2000<br />
1500<br />
1000<br />
500<br />
0<br />
Catch (tonnes)<br />
Catch (tonnes)
170<br />
Lake Malawi Fisheries Management Symposium - Proceedings<br />
Ringet fishery<br />
Unlike <strong>the</strong> o<strong>the</strong>r <strong>fisheries</strong>, <strong>the</strong> ringnet fishery targets chambo (Oreochromis spp.) south <strong>of</strong> Boadzulu Island in <strong>the</strong><br />
SEA (Figure 10). The highest catches <strong>of</strong> chambo were manifested in 1983 and have declined steadily since <strong>the</strong>n,<br />
reaching <strong>the</strong>ir lowest levels in 1997. From 1998 to 2000 <strong>the</strong>re has been a slight increase in <strong>the</strong> catches. The total<br />
effort and catch rates have followed <strong>the</strong> pattern <strong>of</strong> <strong>the</strong> catch. Similarly, <strong>the</strong> Surplus Production Models did not fit <strong>the</strong><br />
data as a result <strong>the</strong> precautionary approach principle was applied (Table 2). The ringnet fishery in <strong>the</strong> SEA currently<br />
operates at Bpa which calls for immediate <strong>management</strong> action.<br />
Effort and CPUE<br />
3.00<br />
2.50<br />
2.00<br />
1.50<br />
1.00<br />
0.50<br />
0.00<br />
80 81 82 83 84 85 86 87 88 89 90 91 92 93 94 95 96 97 98 99 00<br />
Year<br />
2000.0<br />
1800.0<br />
1600.0<br />
1400.0<br />
1200.0<br />
1000.0<br />
800.0<br />
600.0<br />
400.0<br />
200.0<br />
To tal yie ld Rel. cpue No rm. effo rt<br />
Figure 10. Catch, effort and CPUE in ringnet fishery in <strong>the</strong> south east arm <strong>of</strong> Lake Malawi from 1980 to<br />
2000.<br />
Discussion<br />
Changes in species composition, cpue and catch contribution have been used as indicators <strong>of</strong> stock status for <strong>the</strong><br />
commercial <strong>fisheries</strong> in Malawi (Turner, 1977; Banda, et al. 1996). In this case, declines <strong>of</strong> 75% <strong>of</strong> <strong>the</strong> cpue or more<br />
indicate overexploitation (Bulirani et al. 1999). The 75% reference point was however, determined arbitrarily.<br />
Species composition, cpue and catch<br />
No changes in species composition was noted during <strong>the</strong> survey period. The catch was dominated by small cichlid<br />
species such as C. virginalis, C. eucinostomus, O. argyosoma and a few large species such as B. meridionalis,<br />
Bathyclarias spp. and Oreochromis spp. which is consistent with <strong>the</strong> earlier studies (Banda et al. 1996;Turner et al.<br />
1997). All <strong>the</strong> dominant species in this survey were dominant in both small- and large-scale <strong>fisheries</strong> (Manase 2000;<br />
Nyasulu, 2001). This is indicative <strong>of</strong> resource use overlap between <strong>the</strong> small- and large-scale <strong>fisheries</strong>. The Fisheries<br />
Conservation and Management Act 1997 regulations specify that different <strong>fisheries</strong> should operate in specific areas,<br />
time and depth to reduce conflicts. Therefore, this overlap can mainly be attributed to non-compliance <strong>of</strong> <strong>the</strong><br />
regulations by fishers resulting in all different fishers operating in <strong>the</strong> same fishing grounds. Indeed large scale<br />
<strong>fisheries</strong> such as pair trawlers have been observed to fish in waters < 20 m in both arms. It has also been noted<br />
recently that RV. Ndunduma has damaged many gillnets during its fishing experimental surveys in waters depth <strong>of</strong><br />
50-60 m. The small-scale fishers set <strong>the</strong>ir 2 inch size gillnets during daytime to catch (Utaka) Copadichromis<br />
virginalis which is contrary to <strong>the</strong> law. The gillnets are supposed to be set between 6.00 p.m. and 6.00 a.m. The<br />
small scale fishers have also thrown stumps or nkokwe as fish aggregates in some trawlable grounds. The presence<br />
<strong>of</strong> <strong>the</strong> fishers waiting for <strong>the</strong>ir nets during daytime and stumps <strong>of</strong> trees makes trawling in <strong>the</strong>se grounds difficult.<br />
The standardised index <strong>of</strong> abundance which is assumed to be linearly proportional to exploitable biomass, indicate<br />
that <strong>the</strong> relative abundance has decreased between 23% and >80% since <strong>the</strong> early 1980s in various large-scale<br />
<strong>fisheries</strong>. The highest decrease was evident in <strong>the</strong> cambo fishery (> 80%) and <strong>the</strong> lowest in <strong>the</strong> pair trawl fishery<br />
(23%) in <strong>the</strong> SWA. Since <strong>the</strong> pattern <strong>of</strong> effort corresponds with <strong>the</strong> catch, <strong>the</strong> changes in catch rates can be<br />
attributed to changes in fishing effort especially for <strong>the</strong> pair trawl fishery in <strong>the</strong> SWA, demersal, chambo and<br />
0.0<br />
Catch (tonnes)
171<br />
Lake Malawi Fisheries Management Symposium - Proceedings<br />
midwater <strong>fisheries</strong>. The same argument applies to <strong>the</strong> pair trawl fishery in 1980’s in <strong>the</strong> SEA but not between 1999<br />
and 2000. The catches for <strong>the</strong> last two years were around 185 tons annually as opposed to <strong>the</strong> expected catch <strong>of</strong> 448<br />
tonnes based on <strong>the</strong> Bcur. Therefore, <strong>the</strong> low catches were perhaps a result <strong>of</strong> o<strong>the</strong>r factors such as poor maintenance<br />
<strong>of</strong> <strong>the</strong> boats and inefficient fishing power <strong>of</strong> <strong>the</strong> engines. Currently, <strong>of</strong> <strong>the</strong> sixteen licensed pair trawl units only six<br />
are operational and <strong>the</strong>ir operational schedule is sporadic.<br />
Biomass<br />
The Surplus Production Models are fitted to catch and effort data with <strong>the</strong> assumption that <strong>the</strong> fishery is in<br />
equilibrium and catch rates decrease with increasing effort. There was no significant relation between cpue and<br />
effort in all large-scale commercial <strong>fisheries</strong> indicating that <strong>the</strong> models did not fit <strong>the</strong> data. The misfit was indicative<br />
that <strong>the</strong> <strong>fisheries</strong> are not in equilibrium perhaps because <strong>of</strong> frequent break down <strong>of</strong> fishing vessels and changes in<br />
fishing power, inaccuracy <strong>of</strong> catch and effort data submissions, fluctuations in stocks <strong>of</strong> dominant species such as C.<br />
virginalis and changes in species composition, mesh size, areas fished and depth.<br />
A comparison <strong>of</strong> <strong>the</strong> estimated MSY (Table 1) and <strong>the</strong> present catch landings (~ 180 and 440 t in <strong>the</strong> SEA and<br />
SWA, respectively for pair trawl fishery, 1570 t for stern trawl) show that <strong>the</strong> pair trawl and stern bottom trawl<br />
<strong>fisheries</strong> are operating below <strong>the</strong> MSY which means that <strong>the</strong>re is no need for <strong>management</strong> recommendation. The<br />
<strong>fisheries</strong> resources <strong>of</strong> <strong>the</strong> SWA deep water (> 50 m) remain untapped because <strong>of</strong> <strong>the</strong> non-existence <strong>of</strong> <strong>the</strong> fishing<br />
activities in <strong>the</strong> area. A comparison <strong>of</strong> <strong>the</strong> estimated MSY and <strong>the</strong> actual landings by <strong>the</strong> pair trawlers however, need<br />
to be taken with caution because <strong>of</strong> differences in fishing powers. The RV. Ndunduma fishing power needs to be<br />
calibrated in relation to <strong>the</strong> pair trawlers.<br />
Unlike <strong>the</strong> swept area method, which can be applied only to <strong>the</strong> bottom trawl <strong>fisheries</strong>, <strong>the</strong> precautionary approach<br />
application is cross-cutting. The adoption <strong>of</strong> <strong>the</strong> precautionary approach indicates that <strong>the</strong>re is currently no need for<br />
<strong>management</strong> recommendations for <strong>the</strong> pair trawl and mid water fishery but <strong>the</strong>re is a need to consider reduction in<br />
effort <strong>of</strong> <strong>the</strong> stern bottom trawl and ring net. The recommendation <strong>of</strong> reduction in effort for <strong>the</strong> stern bottom trawl<br />
using <strong>the</strong> precautionary approach contradicts with that by <strong>the</strong> swept area method. This may be attributed to <strong>the</strong> fact<br />
that <strong>the</strong> cpue for <strong>the</strong> stern bottom trawl fishery does not represent mean Figure for <strong>the</strong> entire area because <strong>the</strong> fishery<br />
tends to be localised i.e. effort is not wide spread covering <strong>the</strong> entire area (Banda et al. 1996).<br />
In view <strong>of</strong> <strong>the</strong> above it is clear that <strong>the</strong>re is competition among small and large scale fishers over various stocks such<br />
as Copadichromis virginalis, Oreochromis spp. Bagrus meridionalis etc. The pair trawl and midwater trawl fishery<br />
are not fully exploited. The pair trawl fishery needs rehabilitation for it to reach its maximum potential production<br />
while <strong>the</strong>re is room for expansion for <strong>the</strong> midwater trawl fishery. The stern trawl fishery is currently fully exploited<br />
whereas <strong>the</strong> Chambo fishery is overexploited.<br />
Management<br />
The conventional <strong>management</strong> techniques for <strong>the</strong> sustainable utilisation for <strong>the</strong> commercial <strong>fisheries</strong> resources have<br />
been included in <strong>the</strong> Fisheries Conversation and Management Act 1997 and regulations include a limited number <strong>of</strong><br />
licenses in demarcated areas, trawling in specific areas, time and depth and a minimum codend mesh size <strong>of</strong> 38 mm.<br />
The <strong>management</strong> <strong>of</strong> this fishery has been emphasized mainly by effort control and fishing area. However, <strong>the</strong> fishers<br />
have followed none <strong>of</strong> <strong>the</strong>se regulations and this has been exacerbated by ineffective enforcement. All<br />
recommended licenses have been issued but very few are operational especially <strong>the</strong> pair trawl fishers. This is<br />
attributed to lack <strong>of</strong> capital for new licences and poor business <strong>management</strong>. Some people have had licenses for a<br />
very long time and have never fished. Equally, some fishers in <strong>the</strong> industry have failed to maintain <strong>the</strong>ir fishing<br />
fleet, which has led <strong>the</strong>m to stop fishing. The factors have led to <strong>the</strong> reduction in fishing effort and decreased<br />
catching efficiencies <strong>of</strong> <strong>the</strong> fishing vessels. Of <strong>the</strong> eight and twelve licences allocated to <strong>the</strong> shallow waters <strong>of</strong> <strong>the</strong><br />
SEA and SWA, respectively, only two are operational in each area. In contrast, <strong>the</strong> stern trawlers performance is<br />
better than that <strong>of</strong> <strong>the</strong> pair trawlers. All <strong>the</strong> existing stern trawlers are operational although <strong>the</strong>y are fishing in <strong>the</strong><br />
same areas <strong>of</strong> <strong>the</strong> SEA. Four licenses are recommended for this area but six are fishing <strong>the</strong>re.).<br />
Despite <strong>the</strong> fact that each fishing vessel is licensed to fish in a specific area and depth range, pair trawlers usually<br />
fish in shallow <strong>of</strong> less than 6 and 20 m while stern trawlers start fishing in depth > 30 m. Some fishers have never<br />
fished in areas according to <strong>the</strong>ir licences and yet, <strong>the</strong> returns still indicate operation in <strong>the</strong> licenced area. One stern<br />
trawl is licensed for <strong>the</strong> deep waters <strong>of</strong> <strong>the</strong> SWA but fishes in <strong>the</strong> SEA. Experiments on gear selectivity indicate that<br />
clogging <strong>of</strong> <strong>the</strong> 38 mm mesh size happens within <strong>the</strong> first 10 minutes <strong>of</strong> trawling while that <strong>of</strong> <strong>the</strong> 50 mm mesh size
172<br />
Lake Malawi Fisheries Management Symposium - Proceedings<br />
in 15 minutes (Kanyerere, 2000). Consequently, <strong>the</strong> present recommended mesh size at <strong>the</strong> codend has been<br />
ineffective.<br />
In view <strong>of</strong> <strong>the</strong> above, <strong>the</strong>re is a need for effective enforcement <strong>of</strong> <strong>fisheries</strong> regulations to reduce <strong>the</strong> conflict amongst<br />
different fishers and if effort is to be reduced. The control <strong>of</strong> <strong>the</strong> large-scale <strong>fisheries</strong> should be feasible because <strong>the</strong>y<br />
are small and confined to a relatively small area. However, <strong>the</strong>re is also an urgent need for detailed studies on stock<br />
identification and identification <strong>of</strong> resources overlaps between <strong>the</strong> small-scale and large- scale <strong>fisheries</strong>.<br />
Acknowledgements<br />
Thanks to <strong>the</strong> staff <strong>of</strong> Malawi Fisheries Research Institute especially to Technical Assistants for commercial data<br />
compilation.<br />
References<br />
Banda, M.C. 2000. The biology and ecology <strong>of</strong> <strong>the</strong> catfishes <strong>of</strong> <strong>the</strong> Genera Bathyclarias and Bagrus in Lake Malawi. PhD.<br />
Thesis. University <strong>of</strong> Zimbabwe. 188pp.<br />
Banda, M.C. and T. Tomasson. 1997. Demersal fish stocks in sou<strong>the</strong>rn Lake Malawi: Stock assessment and exploitation.<br />
Government <strong>of</strong> Malawi, Department <strong>of</strong> Fisheries. Fisheries Bulletin No.35.<br />
Banda, M.C., Tomasson, T. and Tweddle, D. 1996. Assessment <strong>of</strong> <strong>the</strong> deep water trawl <strong>fisheries</strong> <strong>of</strong> <strong>the</strong> south east arm <strong>of</strong> Lake<br />
Malawi using exploratory surveys and commercial data. In: Stock Assessment in Inland Fisheries. Cowx, I.G. (Ed.).<br />
Oxford: Fishing News Books, pp. 53-75.<br />
Bulirani, A., M.C. Banda, O.K. Palsson, O.L.F. Weyl, G.Z. Kanyerere, M.M. Manase and R.D. Sipawe 1999. Fish stocks and<br />
<strong>fisheries</strong> <strong>of</strong> Malawian waters: Resource report. Government <strong>of</strong> Malawi, Department <strong>of</strong> Fisheries, Fisheries Research<br />
Unit. 54 pp.<br />
FAO, 1993. Fisheries <strong>management</strong> in <strong>the</strong> south east arm <strong>of</strong> Lake Malawi, <strong>the</strong> Upper Shire River and Lake Malombe, with<br />
particular reference to <strong>the</strong> <strong>fisheries</strong> on chambo (Oreochromis spp.). FAO, Rome, CIFA Technical Paper, 21, 1-113.<br />
FAO, 1976. Promotion <strong>of</strong> intergrated fishery development, Malawi. Analysis <strong>of</strong> <strong>the</strong> various <strong>fisheries</strong> <strong>of</strong> Lake Malawi. FAO,<br />
FI:DP/MLW/77/516. Technical report 1.<br />
Kanyerere, G.Z. 1999. Trawl selectivity and <strong>the</strong> effect <strong>of</strong> clogging on selectivity in standard trawl surveys in Lake Malawi. .<br />
Government <strong>of</strong> Malawi, Department <strong>of</strong> Fisheries. Fisheries Bulletin No. 39.<br />
Manase, M. 2000. Traditional gear selectivity. (in press).<br />
Nyasulu, T.E. 2001. Resource use overlaps between pair-trawl and small-scale <strong>fisheries</strong> in <strong>the</strong> south east arm <strong>of</strong> Lake Malawi:<br />
preliminary results (Proceedings <strong>of</strong> this <strong>symposium</strong>).<br />
Palsson, O.K., M.C. Banda and A. Bulirani. 1999. Review <strong>of</strong> demersal monitoring surveys in sou<strong>the</strong>rn Lake Malawi.<br />
Government <strong>of</strong> Malawi, Department <strong>of</strong> Fisheries. Fisheries Bulletin No.40.<br />
Pitcher, T.J. and Hart, P.J.B. 1982. Fisheries ecology. Croom Helm, Beckenham, 414 pp.<br />
Schaefer, M.B. 1954. Some aspects <strong>of</strong> <strong>the</strong> dynamic <strong>of</strong> populations important to <strong>the</strong> <strong>management</strong> <strong>of</strong> commercial marine <strong>fisheries</strong>.<br />
Bulletin <strong>of</strong> <strong>the</strong> Inter-American Tropical Tuna Commission.,1,27-56.<br />
Sipawe, R. 2001. Gear and species selectivity <strong>of</strong> <strong>the</strong> gillnet fishery in Lake Malawi. (Proceedings <strong>of</strong> this <strong>symposium</strong>).<br />
Tarbit, J. 1972. Lake Malawi trawling survey – Interim report 1969-1971. Malawi Fisheries Bulletin , (2), 16 pp.<br />
Turner, J. L. 1977. Some effects <strong>of</strong> demersal trawling in Lake Malawi (<strong>lake</strong> Nyasa ) from `968 to 1974. Journal <strong>of</strong> Fish Biology,<br />
10, 261-71.<br />
Turner, G.F. 1995. Management conservation and species changes <strong>of</strong> exploited fish stocks in Lake Malawi. In: The Impact <strong>of</strong><br />
<strong>the</strong> Species in African Lakes. Eds. Pitcher, T.J. and Hart, P.J.B. Chapman & Hall, London.<br />
Turner, G.F., Tweddle , D. and Makwinja, R.D. 1995. Changes in demersal cichlid communities as a result <strong>of</strong> trawling in<br />
sou<strong>the</strong>rn Lake Malawi. In: The Impact <strong>of</strong> <strong>the</strong> Species in African Lakes. Eds. Pitcher, T.J. and Hart, P.J.B. Chapman &<br />
Hall, London.
173<br />
Lake Malawi Fisheries Management Symposium - Proceedings<br />
Spatial and temporal distribution <strong>of</strong> some commercially important fish species in<br />
<strong>the</strong> sou<strong>the</strong>ast arm <strong>of</strong> Lake Malawi: A Geostatistical Analysis.<br />
Ge<strong>of</strong>frey Z. Kanyerere 1 & Anthony J. Booth 2<br />
1 Fisheries Research Unit, P.O. Box 27, Monkey Bay, Malawi.<br />
2 Dept. <strong>of</strong> Ichthyology & Fisheries Science, Rhodes University, Grahamstown 6140, South Africa. E.mail- t.booth@ru.ac.za<br />
Abstract<br />
The spatial and temporal distribution <strong>of</strong> <strong>the</strong> following fish species; Alticorpus mentale, Buccochromis lepturus, Copadichromis<br />
virginalis, Diplotaxodon elongate, and Oreochromis spp. in <strong>the</strong> sou<strong>the</strong>ast arm <strong>of</strong> Lake Malawi were analysed using bottom trawl<br />
catch per unit effort (CPUE) data collected during <strong>the</strong> annual demersal monitoring surveys <strong>of</strong> 1995 and 1999. Geostatistical<br />
techniques were used to model and estimate <strong>the</strong> spatial structure <strong>of</strong> abundance and ordinary kriging was used to predict local<br />
abundance. Small-scale intra-area variation that was detected was used to model <strong>the</strong> spatial structure. Experimental variograms<br />
were calculated and fitted using <strong>the</strong> spherical variogram model. Generally <strong>the</strong> structure <strong>of</strong> <strong>the</strong> variograms varied with population<br />
density. The results indicate that A. mentale occurs mainly in deep waters <strong>of</strong> Area C with density increasing slightly over <strong>the</strong> past<br />
four years from 13 kg nm -2 in 1995 to 15 kg nm -2 in 1999. However its distribution has shrunk especially in Area B over <strong>the</strong> same<br />
period. C. virginalis principally occurs along <strong>the</strong> inshore waters <strong>of</strong> sou<strong>the</strong>ast arm especially in Area C <strong>of</strong>f Makanjila and in Area B <strong>of</strong>f<br />
Masasa and Nkhudzi Bay on <strong>the</strong> western shore and <strong>of</strong>f Kadango on <strong>the</strong> eastern shore. The species has declined in abundance in<br />
Area C. Density has decreased from 1,100 kg nm -2 in 1995 to 680 kg nm -2 in 1999. D. elongate is distributed widely occurring in<br />
<strong>of</strong>fshore waters <strong>of</strong> sou<strong>the</strong>ast arm from Area A to Area C in relatively high densities. The species occurs in highest densities in Area<br />
B, <strong>the</strong> distribution in Area C is not as wide as it used to be. The density has declined from 20,000 kg nm -2 in 1995 to 14,000 kg nm -2<br />
in 1999. Oreochromis spp. occur mainly in Area A and to a smaller extent in shallow inshore waters <strong>of</strong> Area B. Over <strong>the</strong> past four<br />
years <strong>the</strong>re has been a marked decrease in <strong>the</strong> distribution range with a corresponding decline in density from 319 kg nm -2 to 26 kg<br />
nm -2 in 1999. B. lepturus is evenly distributed in shallow waters <strong>of</strong> <strong>the</strong> sou<strong>the</strong>ast arm. The 1999 distribution pattern indicates that <strong>the</strong><br />
species has slightly declined in abundance in <strong>the</strong> nor<strong>the</strong>astern part <strong>of</strong> Area C and Area A. However density has increased from 37<br />
kg nm -2 in 1995 to 222 kg nm -2 in 1999. Although sampling was not originally designed specifically for geostatistics, <strong>the</strong>se results<br />
indicate that geostatistics can be successfully used to detect changes in <strong>the</strong> spatial and temporal distribution <strong>of</strong> fish stocks or<br />
species in <strong>lake</strong> Malawi using <strong>the</strong> existing data.<br />
Introduction<br />
Lake Malawi, situated in <strong>the</strong> African rift valley between 9 o 30"S and 14 o 30"S and bordered by Malawi, Mozambique<br />
and Tanzania, is <strong>the</strong> third largest <strong>lake</strong> in Africa with an average depth <strong>of</strong> 292 m. The shallow Areas are <strong>the</strong> most<br />
productive and are found in <strong>the</strong> sou<strong>the</strong>ast and southwest arms <strong>of</strong> <strong>the</strong> <strong>lake</strong> (Patterson & Kachinjika, 1995).<br />
The <strong>fisheries</strong> on Lake Malawi are mainly distinguished by <strong>the</strong>ir degree <strong>of</strong> mechanisation and are classified into<br />
traditional and commercial components. The commercial <strong>fisheries</strong> which are relatively mechanised and capital<br />
intensive are dominated by stern and pair trawlers (Banda & Tomasson, 1996). Of all <strong>the</strong> fishing gears, bottom trawl<br />
nets are <strong>the</strong> most important. Pelagic trawl nets and pulse seine nets are seldom used.<br />
The commercial fishery was established in 1968 after successful experimental trials revealed <strong>the</strong> existence <strong>of</strong> large<br />
demersal stocks in <strong>the</strong> sou<strong>the</strong>rn portion <strong>of</strong> <strong>the</strong> <strong>lake</strong> (Turner, 1976). All commercial fishing now occurs in <strong>the</strong><br />
sou<strong>the</strong>rn part <strong>of</strong> <strong>the</strong> <strong>lake</strong>.<br />
As <strong>the</strong> trawl fishery intensified, large changes in species composition were observed. Large cichlid species mostly<br />
belonging to <strong>the</strong> genus Lethrinops, clariid catfishes and Bagrus meridionalis have declined in abundance. This<br />
decline was followed by a corresponding increase in small cichlids most <strong>of</strong> which were Otopharynx spp. and<br />
Pseudotropheus spp. (Turner, 1976). Several follow-up projects like <strong>the</strong> “Demersal Fisheries Re-assessment Project<br />
(1989-1994)” were initiated in 1991 and one <strong>of</strong> <strong>the</strong> main findings <strong>of</strong> this project was that <strong>the</strong>re was a 50-70%<br />
decline in biomass estimates in Areas A, B and C (Figure 1). Some changes in species composition were also noted,<br />
particularly in Area B where <strong>the</strong> relative contribution <strong>of</strong> some <strong>of</strong> <strong>the</strong> larger cichlid species to <strong>the</strong> catch had decreased<br />
(Turner et al, 1995).<br />
In view <strong>of</strong> <strong>the</strong>se developments, <strong>the</strong> government <strong>of</strong> Malawi through <strong>the</strong> Department <strong>of</strong> Fisheries introduced<br />
standardised demersal surveys in 1994 to monitor <strong>the</strong> status <strong>of</strong> <strong>the</strong> stocks in <strong>the</strong> two arms <strong>of</strong> <strong>the</strong> <strong>lake</strong>. These surveys<br />
were initially conducted on quarterly basis but due to logistical problems and lack <strong>of</strong> adequate funding <strong>the</strong> frequency<br />
was reduced to two surveys a year. Recent information from <strong>the</strong>se surveys and o<strong>the</strong>r sources indicate that <strong>the</strong><br />
chambo (Oreochromis spp.) stocks in Lake Malawi have declined to <strong>the</strong> lowest level ever and as such it was<br />
proposed that all gears targeting Chambo be banned in Area A (Bulirani et al, 1999). Declining catch per unit effort
174<br />
Lake Malawi Fisheries Management Symposium - Proceedings<br />
(CPUE) is also observed for <strong>the</strong> stocks <strong>of</strong> bombe (Bathyclarias spp), kampango (Bagrus meridionalis) and utaka<br />
(Copadichromis spp.) but <strong>the</strong> <strong>fisheries</strong> for usipa (Engraulicypris sardella) and kambuzi (small non-catfish spp.)<br />
have remained relatively stable. The findings also indicate that despite <strong>the</strong> decline <strong>of</strong> some individual stocks, <strong>the</strong><br />
overall CPUE for <strong>the</strong> deep-water stocks has remained relatively stable (Bulirani et al, 1999).<br />
The fact that <strong>the</strong> overall CPUE has remained relatively stable, despite <strong>the</strong> decline in CPUE <strong>of</strong> <strong>the</strong> large species<br />
suggests that <strong>the</strong> small species are gradually increasing in abundance at <strong>the</strong> expense <strong>of</strong> <strong>the</strong> larger ones.<br />
Unfortunately <strong>the</strong>se small species fetch low market prices. Due to low catch rates <strong>of</strong> commercially important species<br />
and <strong>the</strong> increasing abundance <strong>of</strong> small species, most trawlers and o<strong>the</strong>r fishermen have resorted to targeting specific<br />
Areas in <strong>the</strong> <strong>lake</strong> where most <strong>of</strong> <strong>the</strong> species are caught in reasonable quantities. At present, <strong>the</strong> species that are<br />
highly sought after are chambo (Oreochromis spp.), utaka (Copadichromis spp.), ndunduma (Diplotaxodon spp.),<br />
ncheni (Rhamphochromis spp.), kampango (Bagrus spp.) and bombe (Bathyclarias spp).<br />
Concentrating fishing effort on a particular stock can have serious <strong>management</strong> implications especially in cases<br />
where <strong>the</strong> stock involved is localised and has a low fecundity. For instance, most mouth brooders produce relatively<br />
few <strong>of</strong>fspring because <strong>of</strong> limited brooding space. Most <strong>of</strong> <strong>the</strong> Malawi cichlids fall into this category. In situations <strong>of</strong><br />
intense fishing pressure and <strong>the</strong> use <strong>of</strong> small-meshed gears, chances <strong>of</strong> such stocks being depleted are high. At this<br />
point, it is worth noting that <strong>the</strong> 38 mm cod-end currently in use on <strong>the</strong> Lake Malawi trawl fishery is too small, and<br />
most <strong>of</strong> <strong>the</strong> demersal species being caught are immature (Kanyerere, 1999). Such factors have undoubtedly<br />
contributed to <strong>the</strong> depletion <strong>of</strong> stocks in <strong>the</strong> <strong>lake</strong>.<br />
The decline <strong>of</strong> some stocks within <strong>the</strong> sou<strong>the</strong>rn portion <strong>of</strong> <strong>the</strong> <strong>lake</strong> suggests that <strong>the</strong> fishery is already facing serious<br />
problems, which might include intense and localised fishing pressure, growth over-fishing and recruitment failure. It<br />
is imperative that regulatory <strong>management</strong> procedures such as closed seasons and aggregate quotas, controlled Area<br />
fishing and restrictions on fishing gears and technology be instituted where necessary. However, identification and<br />
formulation <strong>of</strong> such regulations require that;<br />
i) Areas or localities where significant reduction in CPUE and species abundance has occurred be<br />
identified.<br />
ii) those Areas where commercially important species are found and what changes <strong>the</strong> species might<br />
have undergone be identified.<br />
iii) temporal changes <strong>of</strong> abundance for species with wide distributions and those with localised<br />
distributions in relation to Area, depth and time be assessed.<br />
iv) maps <strong>of</strong> species abundance by Area, depth and time be produced.<br />
The spatial and temporal distribution <strong>of</strong> commercial species needs to be assessed over a suitable time period. This<br />
can only be accomplished through <strong>the</strong> use <strong>of</strong> geostatistics as no traditional method is suitable for such assessments.<br />
Geostatistics takes <strong>the</strong> spatial autocorrelation between samples into consideration and through kriging, allows <strong>the</strong><br />
analysis and modelling <strong>of</strong> <strong>the</strong> variability <strong>of</strong> a population in space (Freire 1992). Ignoring spatial patterns when using<br />
catch per unit effort (CPUE) data to estimate stock abundance can sometimes lead to inaccurate assessments<br />
(Pelletier and Parna, 1994). As geostatistics is a relatively new technique to <strong>the</strong> Malawian <strong>fisheries</strong>, this study is<br />
preliminary and will investigate <strong>the</strong> feasibility <strong>of</strong> using geostatistics:<br />
- to model <strong>the</strong> abundance, spatial and temporal distribution <strong>of</strong> Alticorpus mentale,<br />
Buccochromis lepturus, Copadichromis virginalis, Diplotaxodon elongate and<br />
Oreochromis spp. and<br />
- to assess if <strong>the</strong> existing sampling locations meet <strong>the</strong> requirements <strong>of</strong><br />
geostatistical analysis.<br />
Materials and Methods<br />
Sampling sites<br />
The data were collected onboard <strong>the</strong> research vessel, R.V. Ndunduma using demersal trawl gear. A total <strong>of</strong> 54 and 43<br />
fixed stations are sampled bi-annually in <strong>the</strong> sou<strong>the</strong>ast and southwest arms <strong>of</strong> Lake Malawi respectively (Figure 2).<br />
The sou<strong>the</strong>ast arm is divided into Areas A, B and C and <strong>the</strong> southwest arm into Areas D, E and F for <strong>management</strong><br />
purposes (Figure1). A Global Position System (GPS) was used for fixing <strong>the</strong> position <strong>of</strong> shooting and hauling for<br />
each station, with each trawl lasting 30 minutes.
latitude<br />
Map <strong>of</strong> Sou<strong>the</strong>rn Lake Malawi showing Area boundaries<br />
F<br />
175<br />
Lake Malawi Fisheries Management Symposium - Proceedings<br />
Figure 1. Area boundaries for both sou<strong>the</strong>ast and southwest arms <strong>of</strong> Lake Malawi.<br />
-14.4 -14.2 -14.0 -13.8<br />
latitude<br />
-13.60<br />
-13.70<br />
-13.80<br />
-13.90<br />
Chipoka<br />
-14.00<br />
-14.10<br />
-14.20<br />
-14.30<br />
-14.40<br />
Chilambula<br />
E<br />
D<br />
Malembo<br />
C<br />
Monkey Bay<br />
Figure 2. Map <strong>of</strong> sou<strong>the</strong>rn Lake Malawi showing sampling stations in sou<strong>the</strong>ast (SEA) and southwest<br />
(SWA) arms.<br />
Data Collection<br />
All trawling was conducted during <strong>the</strong> day (between 6 am and 5 pm) and for each station depth (m), trawling speed,<br />
actual time trawled and position at start and end <strong>of</strong> each haul (latitude and longitude) were recorded. A total <strong>of</strong> 8<br />
surveys covering <strong>the</strong> sou<strong>the</strong>ast and southwest arms <strong>of</strong> <strong>lake</strong> Malawi have been conducted between 1995 and 1999.<br />
Data for only 1995 and 1999 was, however, used in this analysis.<br />
The sampling and recording <strong>of</strong> <strong>the</strong> catch closely followed guidelines outlined by Sparre et al, (1989). All catfish <strong>of</strong><br />
<strong>the</strong> genera Bathyclarias, Clarias and Bagrus as well as extremely large cichlid and non-cichlid species were sorted<br />
out <strong>of</strong> <strong>the</strong> main catch. Thereafter <strong>the</strong> catch was sub-sampled; <strong>the</strong> fraction <strong>of</strong> which depended on <strong>the</strong> quantity <strong>of</strong> catch<br />
landed. The catch was <strong>the</strong>n divided on deck into four categories namely; small fish (mainly cichlids but also<br />
including Synodontis njassae), Bagrus meridionalis, Clariid catfishes and all large cichlid and non-cichlid fishes.<br />
Each category was sorted into species, length measured to <strong>the</strong> nearest half centimetre and weighed.<br />
B<br />
Makaw a<br />
Makanjira<br />
A<br />
N<br />
Kadango<br />
-14.50<br />
34.40 34.50 34.60 34.70 34.80 34.90 35.00 35.10 35.20 35.30 35.40<br />
Chipoka<br />
Chilambula<br />
S W A<br />
Malembo<br />
longitude<br />
S E A<br />
Monkey Bay<br />
Makawa<br />
Makanjira<br />
34.6 34.8 35.0 35.2<br />
longitude<br />
N<br />
Kadango
Data analysis<br />
176<br />
Lake Malawi Fisheries Management Symposium - Proceedings<br />
Geometric mean<br />
From <strong>the</strong> trawl data, estimates <strong>of</strong> <strong>the</strong> percentage composition and CPUE for A. mentale, B. lepturus, C. virginalis D.<br />
elongate and Oreochromis spp. were obtained. The geometric mean (GM) was used to calculate mean CPUE. This<br />
estimation was chosen over <strong>the</strong> arithmetic mean because preliminary analysis showed that <strong>the</strong> data had an<br />
asymmetric right-skewed distribution. It was <strong>the</strong>refore assumed that abundance was also log-normally distributed.<br />
The GM was obtained by calculating <strong>the</strong> mean across stations <strong>of</strong> <strong>the</strong> log-transformed values and back transforming<br />
(Rosner, 1995) such that;<br />
n<br />
∑<br />
( CPUES<br />
+ 1)<br />
1 log<br />
n<br />
GM = 10 s=<br />
1<br />
−1<br />
where CPUEs is <strong>the</strong> catch per unit effort <strong>of</strong> station s.<br />
Geostatistical analysis<br />
The abundance <strong>of</strong> a species measured at fixed locations in a <strong>lake</strong> or ocean is known as random field data and such<br />
data is suitable for geostatistical analysis. Geostatistical data <strong>of</strong>ten exhibit small-scale variation that may be<br />
modelled as spatial correlation and incorporated into estimation procedures. Spatial variability is modelled as a<br />
function <strong>of</strong> <strong>the</strong> distance between <strong>the</strong> sampling sites, where <strong>the</strong> sites closer toge<strong>the</strong>r in space have more similar data<br />
values than those that are far apart. The variogram provides a measure <strong>of</strong> such correlation by describing how sample<br />
data are related with distance and direction (Kaluzny et al, 1998).<br />
Exploratory data analysis<br />
In two-dimensional space, a sampling location is defined by a longitude and latitude position. In order to<br />
successfully model an underlying random spatial process it must be assumed that:<br />
i) <strong>the</strong> observation and <strong>the</strong> spatial process differ only through white-noise measurement error and that<br />
ii) <strong>the</strong> spatial distribution <strong>of</strong> <strong>the</strong> species in question was stable throughout <strong>the</strong> survey period so that<br />
all CPUE observations reflect <strong>the</strong> same underlying spatial process (Pelletier and Parma, 1994).<br />
Although fish movement might make <strong>the</strong> second assumption difficult to satisfy, Lake Malawi fishes are typically<br />
resident and <strong>the</strong>refore, at a broader spatial scale, <strong>the</strong>ir distribution can be considered relatively stable. The spatial<br />
process in geostatistical data can be decomposed into a large-scale deterministic component and a small-scale<br />
stochastic component with <strong>the</strong> random field in this case not having a constant mean. As <strong>the</strong> existence <strong>of</strong> <strong>the</strong><br />
variogram is based on a process with a constant mean and variance defined only through <strong>the</strong> magnitude <strong>of</strong> distance,<br />
<strong>the</strong>n a variogram based on a random field with both large-scale trend and small-scale random variation will not meet<br />
<strong>the</strong> necessary assumption (Kaluzny et al, 1994). This implies that <strong>the</strong> first step in geostatistical data analysis is <strong>the</strong><br />
detection and removal <strong>of</strong> trend from <strong>the</strong> data before using <strong>the</strong> variogram to estimate <strong>the</strong> underlying random process.<br />
Detecting and removing spatial trends<br />
Procedures used in this study for purposes <strong>of</strong> detecting and removing trend from data are those outlined in Kaluzny<br />
et al (1998). They include:<br />
i) rotation <strong>of</strong> <strong>the</strong> longitude and latitude axes to assess spatial invariance.<br />
ii) modelling <strong>the</strong> logged data as a smooth function <strong>of</strong> <strong>the</strong> longitude and latitude using a generalised<br />
additive model (GAM) and<br />
iii) fitting a local regression model (loess) to <strong>the</strong> whole trend surface.<br />
Residuals from this model are later on used to form kriging predictions.
177<br />
Lake Malawi Fisheries Management Symposium - Proceedings<br />
Trend in <strong>the</strong> sou<strong>the</strong>ast arm<br />
In <strong>the</strong> sou<strong>the</strong>ast arm <strong>the</strong> major trend was generally from south east to northwest. The angle <strong>of</strong> rotation was positive<br />
and <strong>the</strong>refore towards <strong>the</strong> north (90 o ) and ranged between 16 o and 45 o .<br />
Analysis<br />
The empirical variogram provides a description <strong>of</strong> how <strong>the</strong> data are correlated with distance. The semi-variogram<br />
function, γ(h), is defined as half <strong>the</strong> average squared difference between points separated by a distance h (Kaluzny et<br />
al, 1998) and is described as:<br />
where N(h) is <strong>the</strong> set <strong>of</strong> all pairwise Eucledian distances h = i - j, |N(h)| is <strong>the</strong> number <strong>of</strong> distinct pairs in N(h), and zi<br />
and zj are data values at spatial locations i and j, respectively. The letter h represents a distance measure with<br />
magnitude only but when direction is also considered, it becomes a vector h ~ (Kaluzny et al, 1998).<br />
A variogram has at least three parameters namely <strong>the</strong> nugget effect, sill and range. The nugget effect represents<br />
micro-scale variation or measurement error and is estimated from <strong>the</strong> empirical variogram as <strong>the</strong> value <strong>of</strong> γ(h) for h<br />
= 0. The sill is <strong>the</strong> variance <strong>of</strong> <strong>the</strong> random field while <strong>the</strong> range is <strong>the</strong> distance (if any) at which data are no longer<br />
autocorrelated.<br />
Additional parameters used in this study to customise <strong>the</strong> variograms were <strong>the</strong> maximum distance over which <strong>the</strong><br />
variogram is calculated, minimum number <strong>of</strong> pairs used for calculating <strong>the</strong> variogram <strong>of</strong> which 30 is <strong>the</strong> minimum,<br />
lag and number <strong>of</strong> lags. The variograms were estimated using <strong>the</strong> robust variogram estimation method as it has <strong>the</strong><br />
advantage <strong>of</strong> reducing <strong>the</strong> effect <strong>of</strong> outliers without removing specific data points from a data set (Kaluzny et al,<br />
1998). The robust estimation method is based on <strong>the</strong> fourth power <strong>of</strong> <strong>the</strong> square root <strong>of</strong> absolute differences as<br />
follows:<br />
1<br />
| zi−zi| { ∑ Nh ( ) }<br />
2|<br />
Nh ( )|<br />
γ ( h)<br />
=<br />
0. 457 + 0. 944/|<br />
Nh ( )|<br />
1 2 4<br />
Modeling <strong>the</strong> Empirical Variogram<br />
Anisotropy occurs when <strong>the</strong> spatial autocorrelation <strong>of</strong> a process changes with direction. A variogram from an<br />
anisotropic process is not purely a function <strong>of</strong> <strong>the</strong> distance h, but is a function <strong>of</strong> both <strong>the</strong> magnitude and direction <strong>of</strong><br />
h ~ (Kaluzny et al, 1998). An anisotropic variogram is geometrically anisotropic if:<br />
2γ(h) = 2γ o (||Ah||), h ∈ℜ d<br />
1<br />
γ ( h)<br />
= ∑ z<br />
| Nh ( )| i − z<br />
2<br />
j<br />
N( h)<br />
where A is a d x d matrix and 2γ 0 is a function <strong>of</strong> a real variable.<br />
( )<br />
In this situation, <strong>the</strong> Eucledian space is not appropriate for measuring distance between locations, but a linear<br />
transformation <strong>of</strong> it is (Cressie, 1993). Since variograms are only valid for an isotropic process, anisotropy has to be<br />
corrected before fitting a <strong>the</strong>oretical model to <strong>the</strong> empirical one. In this study geometric anisotropy (range <strong>of</strong> <strong>the</strong><br />
2
178<br />
Lake Malawi Fisheries Management Symposium - Proceedings<br />
variogram changing in different directions, while sill remains constant) was identified by using directional<br />
variograms and was subsequently corrected by a linear transformation <strong>of</strong> <strong>the</strong> lag vector h ~ .<br />
After estimating <strong>the</strong> parameters <strong>of</strong> <strong>the</strong> empirical variogram, a <strong>the</strong>oretical model is <strong>the</strong>n fitted to it. This is necessary<br />
because it ensures that <strong>the</strong> variance <strong>of</strong> predicted values is positive. This study makes use <strong>of</strong> <strong>the</strong> spherical model.<br />
O<strong>the</strong>r models tested besides <strong>the</strong> spherical were exponential, gaussian, linear and power. Its choice was mainly based<br />
on <strong>the</strong> observation that it was <strong>the</strong> one that fitted well with <strong>the</strong> shape <strong>of</strong> <strong>the</strong> empirical variogram. Besides this, Freire<br />
et al (1992) state that <strong>the</strong> spherical model is <strong>the</strong> most common in <strong>the</strong> analysis <strong>of</strong> animal populations and geostatistics<br />
in general. According to Cressie, (1993) <strong>the</strong> spherical model has <strong>the</strong> form:<br />
⎧ 0,<br />
⎪<br />
γ ( h;<br />
θ ) = ⎨CO<br />
+ C<br />
⎪<br />
⎩CO<br />
+ C<br />
S<br />
S<br />
{( 3<br />
2)(<br />
|| h || a ) − ( 1 2)(<br />
|| h || a )<br />
where θ = (co,cs,as)', co ≥ 0, cs ≥ 0, as ≥ 0 and C0 is <strong>the</strong> nugget effect, due to <strong>the</strong> variability between samples, <strong>the</strong><br />
microstructure which remains undetected because <strong>of</strong> <strong>the</strong> size <strong>of</strong> <strong>the</strong> sample, or errors in measurement or location. Cs<br />
represents <strong>the</strong> sill-nugget effect, where <strong>the</strong> sill is <strong>the</strong> asymptotic value <strong>of</strong> semivariance, reached with a value <strong>of</strong> h =<br />
a, <strong>the</strong> range, which represents <strong>the</strong> maximum distance at which spatial effects are detected.<br />
The spherical model was fitted to <strong>the</strong> empirical variogram by minimising <strong>the</strong> residual sum <strong>of</strong> squares between <strong>the</strong><br />
<strong>the</strong>oretical model and <strong>the</strong> empirical variogram using <strong>the</strong> weighted least-squares estimation as follows:<br />
K<br />
∑<br />
j=<br />
1<br />
⎧ γ ( h(<br />
j))<br />
⎫<br />
| N(<br />
h(<br />
j))<br />
| ⎨ −1⎬<br />
⎩γ<br />
( h(<br />
j);<br />
θ ) ⎭<br />
where K is <strong>the</strong> number <strong>of</strong> lags, θ = (co,c,a), γ(h(j)) = spherical variogram model and<br />
= empirical variogram.<br />
γ<br />
( h(<br />
j))<br />
s<br />
2<br />
A summary <strong>of</strong> variogram parameters that were used in this analysis is displayed in Table 4. The prediction process<br />
also requires <strong>the</strong> values that are used for correcting anisotropy in addition to <strong>the</strong> range, sill, and nugget. Parameters<br />
used for correcting geometric anisotropy in this study were angle and ratio. The ratio ranged from 1.25 to 2 while<br />
<strong>the</strong> angle ranged from 45 o to 180 o . These were different for each species and year.<br />
Spatial prediction using kriging<br />
Kriging is a linear interpolation method that allows predictions <strong>of</strong> unknown values <strong>of</strong> a random function from<br />
observations at known locations. Kriging incorporates a model <strong>of</strong> <strong>the</strong> covariance <strong>of</strong> <strong>the</strong> random function when<br />
calculating predictions <strong>of</strong> <strong>the</strong> unknown values. There are two categories <strong>of</strong> kriging namely universal and ordinary<br />
(Kaluzny et al, 1998). Ordinary kriging uses a random function model <strong>of</strong> spatial correlation to calculate a weighted<br />
linear combination <strong>of</strong> available samples, for prediction <strong>of</strong> abundance and standard errors for unsampled locations.<br />
Weights for this model are chosen to ensure that <strong>the</strong> average error for <strong>the</strong> model is zero and that <strong>the</strong> modelled error<br />
variance is minimised.<br />
In this analysis, ordinary kriging was used to predict <strong>the</strong> value <strong>of</strong> <strong>the</strong> spatial process S(x) for every location x<br />
(latitude, longitude) in <strong>the</strong> Area, from a linear combination <strong>of</strong> <strong>the</strong> observed values {Z(xi), i = 1,…,g}. Based on <strong>the</strong><br />
assumption that Z(x) and S(x) differ only through measurement error (Pelletier and Parma, 1994), it is possible to<br />
model <strong>the</strong> spatial covariance <strong>of</strong> Z(x) directly instead <strong>of</strong> that <strong>of</strong> S(x). Ordinary kriging requires <strong>the</strong> stationarity <strong>of</strong> <strong>the</strong><br />
first differences <strong>of</strong> Z(x) as demanded by <strong>the</strong> intrinsic hypo<strong>the</strong>sis <strong>of</strong> Ma<strong>the</strong>ron (Cressie, 1993) such that:<br />
s<br />
3<br />
},<br />
h = 0<br />
0 < || h || ≤ a ,<br />
|| h || ≥ a<br />
s<br />
s
Ε(Z(x + h ~ ) - Z(x)) = 0,<br />
V(Z(x + h ~ ) - Z(x)) = 2γ(h)<br />
179<br />
Lake Malawi Fisheries Management Symposium - Proceedings<br />
where h ~ is a vector <strong>of</strong> length h = |h|. The first equation means that Z(x) has <strong>the</strong> same expected value over <strong>the</strong> whole<br />
Area regardless <strong>of</strong> location. In ordinary kriging, this value is assumed to be unknown. In <strong>the</strong> second equation, <strong>the</strong><br />
variance <strong>of</strong> <strong>the</strong> difference is a function <strong>of</strong> h ~ only. If second-order stationarity is assumed (as is usual for kriging)<br />
such that:<br />
Cov(Z(x + h), Z(x)) = C(h),<br />
<strong>the</strong> covariance between two points is only a function <strong>of</strong> <strong>the</strong>ir relative position, <strong>the</strong> semivariogram can <strong>the</strong>n be<br />
expressed in terms <strong>of</strong> <strong>the</strong> spatial covariance as:<br />
γ(h) = δ 2 - C(h)<br />
where <strong>the</strong> sill δ 2 is <strong>the</strong> variance <strong>of</strong> Z(x) in <strong>the</strong> model (Pelletier and Parma, 1994).<br />
Thus <strong>the</strong> spatial correlation structure <strong>of</strong> Z(x) is characterised by <strong>the</strong> variogram, γ(h). The kriging variable was <strong>the</strong><br />
residuals from <strong>the</strong> spatial loess model, while spatial locations were <strong>the</strong> rotated coordinates. The spatial correlation<br />
was modelled as spherical covariance based on <strong>the</strong> spherical variogram model fitted to <strong>the</strong> empirical variogram. The<br />
sill used was specified as <strong>the</strong> sill minus <strong>the</strong> nugget effect.<br />
Results<br />
Observed CPUE and catch composition<br />
Presented in Table 2 is a summary <strong>of</strong> CPUE for all five species.<br />
Table 2. CPUE (kg. 0.5hr -1 ) for each <strong>of</strong> <strong>the</strong> species in sou<strong>the</strong>ast arm <strong>of</strong> <strong>lake</strong> Malawi for 1995 and 1999.<br />
South East Arm (CPUE- kg 0.5 hr -1 )<br />
Species 1995 1999<br />
A. mentale 0.93 1.00<br />
C. virginalis 7.79 2.18<br />
Oreochromis spp. 1.58 0.59<br />
B. lepturus 0.54 0.61<br />
D. elongate 2.65 4.65<br />
In Table 3 is a summary <strong>of</strong> <strong>the</strong> percentage composition for each species presented separately for each Area.<br />
Table 3. Percentage composition in <strong>the</strong> total catch for each <strong>of</strong> <strong>the</strong> species in sou<strong>the</strong>ast arm <strong>of</strong> <strong>lake</strong><br />
Malawi.<br />
A B C<br />
Species 1995 1999 1995 1999 1995 1999<br />
A. mentale 0.00 0.00 0.06 0.20 1.55 2.1<br />
C. virginalis 0.10 15.26 30.87 14.50 28.74 0.91<br />
D. elongate 0.32 4.28 7.01 21.46 1.48 8.80<br />
Oreochromis spp. 31.22 11.78 0.51 0.29 0.02 0.00<br />
B. lepturus 0.10 0.41 0.36 0.48 0.24 0.53
180<br />
Lake Malawi Fisheries Management Symposium - Proceedings<br />
Variograms<br />
Table 4 presents summaries <strong>of</strong> variogram parameters for both <strong>the</strong> sou<strong>the</strong>ast and southwest arms <strong>of</strong> <strong>lake</strong> Malawi<br />
respectively.<br />
Table 4. Variogram parameters for species analysed from <strong>the</strong> sou<strong>the</strong>ast arm <strong>of</strong> <strong>lake</strong> Malawi for 1995 and<br />
1999.<br />
Sou<strong>the</strong>ast Arm -1995 Sou<strong>the</strong>ast Arm - 1999<br />
Species Nugget Sill Range Nugget Sill Range<br />
A. mentale 0.005 0.33 0.19 0.005 0.36 0.28<br />
C. virginalis 0.005 5.2 0.18 0.005 0.75 0.2<br />
Oreochromis spp. 0.005 0.21 0.2 0.005 0.04 0.22<br />
B. lepturus 0.005 0.13 0.36 0.005 0.19 0.3<br />
D. elongate 0.005 2.35 0.18 0.005 2.8 0.19<br />
Table 5. Changes in density for each <strong>of</strong> <strong>the</strong> species in sou<strong>the</strong>ast arm <strong>of</strong> <strong>lake</strong> Malawi for 1995 and 1999.<br />
Density (kilogrammes/nm -2 )<br />
Species 1995 1999<br />
A. mentale 13 15<br />
C. virginalis 1100 680<br />
Oreochromis spp. 319 26<br />
B. lepturus 37 222<br />
D. elongate 20000 14000<br />
Results presented correspond to isotropic variograms.<br />
A Mentale<br />
A. mentale attains a maximum size <strong>of</strong> about 25 cm total length (TL) and attains maturity at a relatively large size. It<br />
occurs in water depths <strong>of</strong> between 60 and 128 m (Turner, 1996). It is <strong>of</strong> significance to deep water bottom trawling<br />
where it contributes about 2% to <strong>the</strong> total catch (Table 3).<br />
The 1995 and 1999 variograms for A. mentale differ (Figure 3, Table 4). The range at which <strong>the</strong> data is no longer<br />
spatially correlated is higher for 1999 (0.28 nm) than for 1995 (0.19 nm) suggesting that a change in <strong>the</strong> distribution<br />
pattern <strong>of</strong> <strong>the</strong> species has occurred. The sill value for 1995 (0.33) is lower than that <strong>of</strong> 1999 (0.36) suggesting that<br />
<strong>the</strong>re was more variance in <strong>the</strong> random field in 1999 than in 1995. Both observations indicate that a change in <strong>the</strong><br />
density and distribution pattern <strong>of</strong> <strong>the</strong> species has occurred over <strong>the</strong> past four years.<br />
The distribution maps in Figure 4 indicate that A. mentale occurs mainly in <strong>the</strong> deep waters <strong>of</strong> Area C and <strong>the</strong><br />
distribution seems to have generally shrunk over <strong>the</strong> past four years as indicated by <strong>the</strong> 1999 distribution map.<br />
However density has slightly increased from 13 kg nm -2 in 1995 to 15 kg nm -2 in 1999 (Table 5). This agrees with<br />
<strong>the</strong> observed increase in percentage composition from 1.6% in 1995 to 2.1% (Table 3) and <strong>the</strong> increase in CPUE<br />
from 0.93 kg 0.5 hr -1 in 1995 to 1.00kg 0.5 hr -1 in 1999 (Table 2).<br />
gamma<br />
0.0 0.2 0.4 0.6 0.8<br />
Mentale 1995<br />
0.0 0.1 0.2 0.3<br />
distance<br />
objective = 0.64<br />
Figure 3. Variograms for A. mentale in <strong>the</strong> sou<strong>the</strong>ast arm <strong>of</strong> <strong>lake</strong> Malawi.<br />
0.0 0.2 0.4 0.6 0.8 1.0 1.2<br />
gamma<br />
Mentale 1999<br />
0.0 0.1 0.2 0.3 0.4<br />
distance<br />
objective = 1.2
-32.6 -32.4 -32.2 -32.0 -31.8<br />
Latitude<br />
181<br />
Lake Malawi Fisheries Management Symposium - Proceedings<br />
Figure 4. A. mentale abundance and distribution patterns during 1995 and 1999 in <strong>the</strong> sou<strong>the</strong>ast arm <strong>of</strong><br />
Lake Malawi.<br />
C. virginalis<br />
C. virginalis is a small shoaling species that is very abundant on steep rocky coasts or submerged rock reefs <strong>of</strong> Lake<br />
Malawi. The species attains a maximum size <strong>of</strong> about 11-15 cm TL. It has been recorded at depths ranging from 9 m<br />
to 74 m. It is a very important species to a variety <strong>of</strong> mechanised and artisanal <strong>fisheries</strong> (Turner, 1996).<br />
gamma<br />
Mentale 1995<br />
Density (kg/sq. nm)<br />
0 2 4 6 8 10<br />
13<br />
0<br />
19.1 19.2 19.3 19.4<br />
Longitude<br />
19.5 19.6 19.7<br />
virginalis 1995<br />
objective = 53<br />
distance<br />
0.00 0.05 0.10 0.15 0.20 0.25<br />
Figure 5. Variograms for C. virginalis in <strong>the</strong> sou<strong>the</strong>ast arm <strong>of</strong> <strong>lake</strong> Malawi.<br />
0.0 0.5 1.0 1.5 2.0<br />
gamma<br />
36.2 36.4 36.6<br />
Longitude<br />
36.8 37.0 37.2<br />
The 1995 and 1999 variograms for C. virginalis differ (Figure 5, Table 4). The range at which <strong>the</strong> data is no longer<br />
spatially correlated is higher for 1999 (0.2 nm) than for 1995 (0.18 nm) suggesting that a change in <strong>the</strong> distribution<br />
pattern <strong>of</strong> <strong>the</strong> species has occurred. The sill value for 1995 (5.2) is much higher than that <strong>of</strong> 1999 (0.75) suggesting<br />
that <strong>the</strong>re was more variance in <strong>the</strong> random field in 1995 than in 1999. Both observations indicate that a change in<br />
<strong>the</strong> density and distribution pattern <strong>of</strong> <strong>the</strong> species has occurred over <strong>the</strong> past four years.<br />
The distribution maps in Figure 6 indicate that C. virginalis occurs in Areas A, B & C. However <strong>the</strong> distribution<br />
seems to have generally shrunk over <strong>the</strong> past four years especially in Areas B and C as observed from <strong>the</strong> 1999<br />
distribution map. Density has decreased from 1100 kg nm -2 in 1995 to 680 kg nm -2 in 1999 (Table 5). This agrees<br />
with <strong>the</strong> observed decrease in percentage composition from 30.87% in 1995 to 14.5% in Area B and from 28.74% in<br />
1995 to 0.91% in 1999 in Area C (Table 3). CPUE has likewise decreased from 7.79 kg 0.5 hr -1 in 1995 to 2.18 kg<br />
0.5 hr -1 in 1999 (Table 2).<br />
8.2 8.4 8.6 8.8<br />
Latitude<br />
Mentale 1999<br />
virginalis 1999<br />
Density (kg/sq.nm)<br />
0.0 0.1 distance 0.2 0.3<br />
15<br />
0<br />
objective = 2.9
182<br />
Lake Malawi Fisheries Management Symposium - Proceedings<br />
Figure 6: C. virginalis distribution pattern and abundance during 1995 and 1999.<br />
Oreochromis spp.<br />
In Lake Malawi, <strong>the</strong> genus Oreochromis is composed <strong>of</strong> four species <strong>of</strong> which three are endemic to <strong>the</strong> <strong>lake</strong>. The<br />
endemic ones are O. squamipinnis (37 cm TL), O. karongae (38 cm TL) and O. lidole (37 cm TL) while O. shiranus<br />
(37 cm TL) is <strong>the</strong> only non-endemic species (Turner, 1996). They occur mainly in shallow waters and have been<br />
recorded at depths ranging from 2 m to 50 m although <strong>the</strong>y are most abundant at depths greater than 20 m (Palsson<br />
et al, 1999).<br />
The 1995 and 1999 variograms for Oreochromis spp. differ (Figure7, Table 4). The range at which <strong>the</strong> data is no<br />
longer spatially correlated is slightly higher for 1999 (0.22 nm) than for 1995 (0.2 nm) suggesting that a change in<br />
<strong>the</strong> distribution pattern <strong>of</strong> <strong>the</strong> species has occurred. The sill value for 1995 (0.21) is much higher than that <strong>of</strong> 1999<br />
(0.04) suggesting that <strong>the</strong>re was more variance in <strong>the</strong> random field in 1995 than in 1999. Both observations indicate<br />
that a change in <strong>the</strong> density and distribution pattern <strong>of</strong> <strong>the</strong> species has occurred over <strong>the</strong> past four years.<br />
0.0 0.2 0.4 0.6 0.8<br />
gamma<br />
-<br />
31<br />
-<br />
32<br />
m -<br />
ap 32<br />
2[,<br />
2]<br />
-<br />
32<br />
-<br />
32<br />
virginalis<br />
19. 19. 19. 19.<br />
map2[,<br />
19. 19. 19.<br />
oreochromis 1995<br />
Density (kg/sq.<br />
)<br />
1100<br />
0<br />
objective = 0.79<br />
0.00 0.05 0.10 0.15 0.20 0.25<br />
distance<br />
0.00 0.05 0.10 0.15<br />
distance (nm)<br />
0.20 0.25 0.30<br />
Figure 7. Variograms for Oreochromis spp in <strong>the</strong> sou<strong>the</strong>ast arm <strong>of</strong> Lake Malawi.<br />
The distribution maps in Figure 8 indicate that Oreochromis spp. occurs mainly in Area A and parts <strong>of</strong> Area B.<br />
However <strong>the</strong> distribution has generally shrunk over <strong>the</strong> past four years especially in Areas A as observed from <strong>the</strong><br />
1999 distribution map. Density has likewise decreased from 319 kg nm -2 in 1995 to 26 kg nm -2 in 1999 (Table 5).<br />
This agrees with <strong>the</strong> observed decrease in percentage composition from 31.22% in 1995 to 11.78% in Area A and<br />
from 0.51% in 1995 to 0.29% in 1999 in Area B. CPUE also decreased from 1.58 kg 0.5hr -1 in 1995 to 0.59 kg 0.5<br />
hr -1 in 1999.<br />
0.00 0.05 0.10 0.15 0.20<br />
gamma<br />
-32.6 -32.4 -32.2 -32.0 -31.8<br />
Latitude<br />
virginalis 1999<br />
19.1 19.2 19.3 19.4 19.5 19.6 19.7<br />
Longitude<br />
oreochromis 1999<br />
Density (kg/sq. nm)<br />
680<br />
0<br />
objective = 0.0395
-33.0 -32.8 -32.6 -32.4 -32.2<br />
latitude<br />
oreochromis 1995<br />
183<br />
Lake Malawi Fisheries Management Symposium - Proceedings<br />
Figure 8. Oreochromis spp. abundance and distribution patterns during 1995 and 1999.<br />
B. lepturus<br />
B. lepturus like all o<strong>the</strong>r members <strong>of</strong> <strong>the</strong> genus is a large heavily-built species that attains a maximum total length <strong>of</strong><br />
about 42 cm. It is a shallow water species, and has <strong>of</strong>ten been sampled from depths ranging from 10 to 26 m<br />
(Turner, 1996). It is probably one <strong>of</strong> <strong>the</strong> most delicious fishes <strong>of</strong> <strong>the</strong> <strong>lake</strong> although it is not found in large numbers.<br />
The 1995 and 1999 variograms for B. lepturus differ (Figure 9, Table 4). The range at which <strong>the</strong> data is no longer<br />
spatially correlated is slightly higher for 1999 (0.22 nm) than for 1995 (0.2 nm) suggesting that a change in <strong>the</strong><br />
distribution pattern <strong>of</strong> <strong>the</strong> species has occurred. The sill value for 1995 (0.21) is much higher than that <strong>of</strong> 1999<br />
(0.04) suggesting that <strong>the</strong>re was more variance in <strong>the</strong> random field in 1995 than in 1999. Both observations indicate<br />
that a change in <strong>the</strong> density and distribution pattern <strong>of</strong> <strong>the</strong> species has occurred over <strong>the</strong> past four years.<br />
The distribution maps in Figure 10 indicate that B. lepturus occurs mainly in <strong>the</strong> shallow waters <strong>of</strong> Areas B and C.<br />
However <strong>the</strong> distribution has shrunk over <strong>the</strong> past four years in both Areas as observed from <strong>the</strong> 1999 distribution<br />
map.<br />
Density has however increased from 37 kg nm -2 in 1995 to 222 kg nm -2 in 1999 (Table 5). This agrees with <strong>the</strong><br />
observed increase in percentage composition from 0.36% in 1995 to 0.48% in 1999 in Area B and from 0.24% in<br />
1995 to 0.53% in 1999 in Area C. CPUE also increased from 0.54 kg 0.5 hr -1 in 1995 to 0.61 kg 0.5 hr -1 in 1999.<br />
0.00 0.05 0.10 0.15 0.20 0.25 0.30<br />
gamma<br />
Lepturus 1995<br />
Density(Kg sq. nm)<br />
319<br />
0<br />
18.6 18.7 18.8 18.9<br />
longitude<br />
19.0 19.1 19.2<br />
objective = 0.1<br />
0.0 0.1 0.2 0.3<br />
distance<br />
0.4 0.5<br />
ga<br />
mm 0.3<br />
a<br />
Figure 9. Variograms for B. lepturus in <strong>the</strong> sou<strong>the</strong>ast arm <strong>of</strong> <strong>lake</strong> Malawi.<br />
-23.0 -22.8 -22.6 -22.4 -22.2<br />
latitude<br />
0.5<br />
0.4<br />
0.2<br />
0.1<br />
0.0<br />
oreochromis 1999<br />
Lepturus 1999<br />
Density (Kg sq. nm)<br />
26<br />
0<br />
29.8 30.0 30.2 30.4<br />
longitude<br />
0.0 0.1 0.2 0.3 0.4<br />
distance<br />
objective = 0.18
-30.8 -30.6 -30.4 -30.2 -30.0<br />
Latitude<br />
184<br />
Lake Malawi Fisheries Management Symposium - Proceedings<br />
Figure 10. B. lepturus abundance and distribution patterns during 1995 and 1999 in <strong>the</strong> sou<strong>the</strong>ast arm <strong>of</strong><br />
Lake Malawi.<br />
D. elongate<br />
Members <strong>of</strong> <strong>the</strong> genus Diplotaxodon belong to <strong>the</strong> "Ndunduma" group <strong>of</strong> fishes that are principally deep-water<br />
piscivores and zooplanktivores with upwardly angled mouths. D. elongate and its relatives are truly pelagic<br />
zooplankton feeders, which occupy <strong>the</strong> feeding niche <strong>of</strong> <strong>the</strong> "Utaka" (Copadichromis) in <strong>of</strong>fshore waters. The<br />
species attains a total length (TL) <strong>of</strong> about 19 cm. It has been recorded throughout <strong>the</strong> pelagic zone <strong>of</strong> <strong>the</strong> <strong>lake</strong> from<br />
<strong>the</strong> surface to a depth <strong>of</strong> at least 220 m (Turner, 1996). Commercially, it is also an important species to both <strong>the</strong><br />
commercial and artisanal <strong>fisheries</strong>.<br />
The 1995 and 1999 variograms for D. elongate differ (Figure 11, Table 4). The range at which <strong>the</strong> data is no longer<br />
spatially correlated is slightly higher for 1999 (0.19 nm) than for 1995 (0.18 nm) suggesting that <strong>the</strong> distribution<br />
pattern <strong>of</strong> <strong>the</strong> species has not changed much. However <strong>the</strong> much higher sill value for 1999 (2.8) than that <strong>of</strong> 1995<br />
(2.35) suggests that <strong>the</strong>re was more variance in <strong>the</strong> random field in 1999 than in 1995. The increased variance in <strong>the</strong><br />
random field indicates that a change in <strong>the</strong> density <strong>of</strong> <strong>the</strong> species has occurred over <strong>the</strong> past four years. The<br />
distribution maps in Figure 12 indicate that D. elongate occurs throughout <strong>the</strong> pelagic waters with highest<br />
concentration occurring in Area B.<br />
0 1 2 3<br />
gamma<br />
Lepturus 1995<br />
elongate 1995<br />
Density (Kg sq. nm)<br />
37<br />
0<br />
21.9 22.0 22.1<br />
Longitude<br />
22.2 22.3 22.4<br />
0.0 0.1 0.2 0.3<br />
distance<br />
objective = 6.9<br />
Figure 11. Variograms for D. elongate in <strong>the</strong> sou<strong>the</strong>ast arm <strong>of</strong> <strong>lake</strong> Malawi.<br />
-30.8 -30.6 -30.4 -30.2 -30.0<br />
Latitude<br />
0 1 2 3 4<br />
gamma<br />
Lepturus 1999<br />
elongate 1999<br />
Density (Kg sq. nm)<br />
222<br />
0<br />
21.9 22.0 22.1<br />
Longitude<br />
22.2 22.3 22.4<br />
objective = 19<br />
0.0 0.1 0.2<br />
distance<br />
0.3 0.4
-30.8 -30.6 -30.4 -30.2 -30.0<br />
Latitude<br />
elongate 1995<br />
Density (Kg. sq. nm)<br />
20000<br />
0<br />
21.9 22.0 22.1<br />
Longitude<br />
22.2 22.3 22.4<br />
185<br />
Lake Malawi Fisheries Management Symposium - Proceedings<br />
21.9 22.0 22.1<br />
Longitude<br />
22.2 22.3 22.4<br />
Figure 12. D. elongate abundance and distribution patterns during 1995 and 1999 in <strong>the</strong> sou<strong>the</strong>ast arm <strong>of</strong><br />
<strong>lake</strong> Malawi.<br />
As observed from <strong>the</strong> 1999 distribution map <strong>the</strong> species has disappeared in shallow waters <strong>of</strong> Areas B and C but has<br />
instead extended into Area A and deeper parts <strong>of</strong> Area C. This agrees with <strong>the</strong> increase in percentage composition<br />
from 0.32% in 1995 to 4.28% in 1999 in Area A, from 7.01% in 1995 to 21.46% in 1999 in Area B and from 1.48%<br />
in 1995 to 8.8% in 1999 in Area C (Table 3). This is also reflected in <strong>the</strong> overall increase in CPUE from 2.65 kg<br />
0.5hr -1 in 1995 to 4.65 kg 0.5 hr -1 in 1999 (Table 2). Density has however decreased from 20000 kg nm -2 in 1995 to<br />
14000 kg nm -2 in 1999 (Table 5).<br />
Discussion<br />
Stock assessment methods that disregard spatial distribution <strong>of</strong> species may provide inaccurate information pertinent<br />
to <strong>management</strong>. This is so because such methods usually assume that <strong>the</strong> existing density Areas or strata are<br />
internally homogeneous unless <strong>the</strong> sampling design is perfectly random (Freire et al, 1992). Having <strong>the</strong> ability to<br />
map abundance gradients and integrating <strong>the</strong>m into space, geostatistics gives a more realistic view <strong>of</strong> a species<br />
distribution. This information can also be used to trace <strong>the</strong> spatial and temporal allocation <strong>of</strong> fishing effort for both<br />
effort-controlled and open-access <strong>fisheries</strong>.<br />
All <strong>the</strong> five species assessed in this study show different distribution patterns. This is expected because distribution<br />
patterns are in most cases linked to food availability, water temperature, dissolved oxygen, bottom sediment type<br />
and o<strong>the</strong>r ecological factors such as presence or absence <strong>of</strong> aquatic vegetation and submerged rocky reefs. The<br />
distribution pattern can at times be highly influenced by human interference such as excessive exploitation that can<br />
bring about localised extinction <strong>of</strong> a species or group <strong>of</strong> species.<br />
Alticorpus mentale<br />
The results from this study indicate that A. mentale mainly occurs in deep waters <strong>of</strong> both <strong>the</strong> southwest and<br />
sou<strong>the</strong>ast arms. In sou<strong>the</strong>ast arm it mainly occurs in deep waters <strong>of</strong> Area C. It is however more abundant in<br />
southwest arm than in sou<strong>the</strong>ast arm. The restricted distribution range greatly endangers <strong>the</strong> continued existence <strong>of</strong><br />
<strong>the</strong> species in <strong>the</strong> sou<strong>the</strong>ast arm because <strong>of</strong> high fishing pressure from deepwater demersal trawlers. However, <strong>the</strong><br />
results from <strong>the</strong> same sou<strong>the</strong>ast arm indicate that <strong>the</strong> species has gradually increased in abundance over <strong>the</strong> period<br />
from 1995 to 1999 despite intense fishing pressure. This can only be attributed to <strong>the</strong> fact that because deepwater<br />
species have a poor market value, fishing pressure has over <strong>the</strong> years been redirected to high value shallow to<br />
medium water-depth (20-70m) species such as C. virginalis, D. elongate and Oreochromis spp. among o<strong>the</strong>rs. The<br />
decline in <strong>the</strong> catch rates and distribution <strong>of</strong> species such as C. virginalis, D. elongate and Oreochromis spp. bears<br />
testimony to <strong>the</strong> redirection <strong>of</strong> fishing effort away from deep waters.<br />
Copadichromis virginalis<br />
This study has shown that C. virginalis occurs along <strong>the</strong> shores <strong>of</strong> <strong>the</strong> sou<strong>the</strong>ast arm especially in Area C <strong>of</strong>f<br />
Makanjila, and in Area B <strong>of</strong>f Masasa, Chirombo and Nkhudzi bay on <strong>the</strong> western shore and to a smaller extent on<br />
eastern shore just <strong>of</strong>f Kadango fishing village (Figure 1). The results based on <strong>the</strong> 1999 data indicate that <strong>the</strong> species<br />
has greatly declined in abundance in Area C but <strong>the</strong>re is instead a marked increase in abundance <strong>of</strong> <strong>the</strong> species in<br />
Area A.<br />
-30.8 -30.6 -30.4 -30.2 -30.0<br />
Latitude<br />
elongate 1999<br />
Density (Kg. sq. nm)<br />
14000<br />
0
186<br />
Lake Malawi Fisheries Management Symposium - Proceedings<br />
The decline in <strong>the</strong> abundance <strong>of</strong> this species in Areas C and B can be attributed to <strong>the</strong> uncontrolled fishing pressure<br />
that is exerted on <strong>the</strong> species from both <strong>the</strong> artisanal, commercial and semi-commercial <strong>fisheries</strong>. Fishers along <strong>the</strong><br />
shores <strong>of</strong> <strong>the</strong> sou<strong>the</strong>ast arm know exactly where to fish for this species resulting into localised declines in abundance<br />
within its preferred grounds while <strong>the</strong> abundance has increased in Areas that are less known to fishers. An example<br />
here is Area A.<br />
Diplotaxodon elongate<br />
The results from this survey indicate that D. elongate is a widely distributed species occurring in <strong>of</strong>fshore waters <strong>of</strong><br />
<strong>the</strong> sou<strong>the</strong>ast arm from Area A to Area C in relatively high densities. The species occurs in highest densities in Area<br />
B. As observed from <strong>the</strong> distribution pattern for both 1995 and 1999 respectively, <strong>the</strong> species has over <strong>the</strong> period<br />
1995-1999 increased in abundance with much higher densities occurring in Area B and partly extending into <strong>the</strong><br />
sou<strong>the</strong>rn portion <strong>of</strong> Area C. However its distribution range has decreased over <strong>the</strong> period between 1995 and 1999.<br />
D. elongate being a pelagic species, is not always available to bottom trawlers and <strong>the</strong>refore suffers relatively less<br />
fishing mortality than o<strong>the</strong>r species that are permanently demersal. There is also relatively less fishing pressure from<br />
<strong>the</strong> lone midwater trawler operating in Area B which occasionally lands about 53% <strong>of</strong> D. elongate as bycatch<br />
(Turner, 1996). Although <strong>the</strong>re are indications that <strong>the</strong> current distribution is not as wide as it used to be especially<br />
in Area C, <strong>the</strong> species unlike <strong>the</strong> o<strong>the</strong>rs, is not greatly affected by fishing activities. It seems to be more or less<br />
governed by <strong>the</strong> existing environmental conditions.<br />
Oreochromis spp.<br />
These species are commonly called "Chambo" and have for decades been <strong>the</strong> mainstay <strong>of</strong> both <strong>the</strong> commercial and<br />
artisanal <strong>fisheries</strong> in sou<strong>the</strong>rn Lake Malawi. Results from this study indicate that Oreochromis spp. occur mostly in<br />
Area A and to a smaller extent in shallow inshore waters <strong>of</strong> Area B. The species have greatly declined in abundance<br />
and <strong>the</strong>ir distribution range has narrowed very much.<br />
The drastic decline in <strong>the</strong> abundance and distribution <strong>of</strong> <strong>the</strong> species has mostly been blamed on localised and<br />
excessive fishing pressure from both commercial and artisanal <strong>fisheries</strong> over <strong>the</strong> years. Much <strong>of</strong> <strong>the</strong> blame has been<br />
laid on <strong>the</strong> light attraction fishery commonly known as Kauni, beach seines, and undermeshed gillnets. To redress<br />
<strong>the</strong> situation, it was recently proposed that beach seines and Kauni <strong>fisheries</strong> be banned in Area A (Bulirani et al,<br />
1999).<br />
The situation in sou<strong>the</strong>ast arm requires urgent intervention from <strong>the</strong> <strong>fisheries</strong> department because if nothing is done<br />
to curb <strong>the</strong> current trends in fishing practices, <strong>the</strong> remaining few pockets will also disappear.<br />
Buccochromis lepturus<br />
The results from this study indicate that in <strong>the</strong> sou<strong>the</strong>ast arm, B. lepturus is evenly distributed in shallow waters <strong>of</strong><br />
Areas B and C. Abundance has generally increased as manifested by <strong>the</strong> higher biomass in 1999 than in 1995.<br />
However by 1999 <strong>the</strong> species had disappeared from <strong>the</strong> eastern part <strong>of</strong> Area C and <strong>the</strong> sou<strong>the</strong>rn most portion <strong>of</strong> <strong>the</strong><br />
<strong>lake</strong> (Area A). Thus <strong>the</strong> distribution range has decreased. The general decline in abundance <strong>of</strong> this species in parts <strong>of</strong><br />
Area C and Area A can be attributed to excessive fishing effort in <strong>the</strong>se Areas mainly because <strong>of</strong> localised fishing<br />
effort in Area A for Oreochromis spp. and in Area C for C. virginalis.<br />
Conclusions<br />
This study has demonstrated that geostatistics can be successfully used to analyse <strong>the</strong> existing CPUE data in Lake<br />
Malawi to detect changes in <strong>the</strong> spatial and temporal distribution <strong>of</strong> fish stocks. The reasonably low nugget effect<br />
(0.005 max) indicates that <strong>the</strong> micro-scale variation or measurement error is small for all <strong>the</strong> species analysed.<br />
Biomass estimates are generally good for species found <strong>of</strong>fshore or in deep water. This is because during kriging,<br />
this part <strong>of</strong> <strong>the</strong> water body is analysed more thoroughly than shallow waters. However, <strong>the</strong>re is ano<strong>the</strong>r method that<br />
can be used to improve biomass estimates for shallow water species. This method was not employed in <strong>the</strong> current<br />
analysis because a lot <strong>of</strong> time is required to manually define <strong>the</strong> Area to be kriged.<br />
In order to enhance <strong>the</strong> efficacy <strong>of</strong> this new technique, <strong>the</strong> number <strong>of</strong> stations needs to be increased in sou<strong>the</strong>ast arm<br />
especially in Area B. The seven stations in Area A need to be evenly redistributed.
187<br />
Lake Malawi Fisheries Management Symposium - Proceedings<br />
Generally, all <strong>the</strong> species studied show localised occurrence in various Areas <strong>of</strong> <strong>the</strong> <strong>lake</strong>, and as such <strong>the</strong>y are very<br />
vulnerable to overfishing and are in imminent danger <strong>of</strong> facing localised extinction. To protect <strong>the</strong>se stocks it is<br />
suggested that stock-specific <strong>management</strong> measures be constituted and implemented as soon as possible. Options to<br />
be considered include closed seasons and aggregate quotas, controlled-Area fishing, restrictions on fishing gear and<br />
technology.
188<br />
Lake Malawi Fisheries Management Symposium - Proceedings<br />
Acknowledgements<br />
I would like to thank ICEIDA (Malawi) for sponsoring my studies at Rhodes University and my project supervisor,<br />
Dr. A. Booth, who untiringly guided me through all <strong>the</strong> data analysis and write-up.<br />
References<br />
Banda, M.C. and Tomasson, T. (1996). Surveys <strong>of</strong> Trawling Grounds and Demersal Fish Stocks in Central Lake Malawi from<br />
Domira Bay to Nkhata Bay in 1994 and 1995. Government <strong>of</strong> Malawi, Fisheries Department. Fisheries Bulletin No.<br />
33,34 pp.<br />
Bulirani, A.E., Banda, M.C., Palsson K.P., and Weyl, O.L.F. (1999). Fish Stocks and Fisheries <strong>of</strong> Malawian Waters. Resource<br />
Report 1999. Government <strong>of</strong> Malawi, Fisheries Department. 54pp.<br />
Cressie, N.A.C. (1993). Statistics for Spatial Data. John Wiley & Sons, New York. 900 pp.<br />
Freire, J., Gonzalez-Gurriaran, E. & Olaso, I.(1992). Spatial Distribution <strong>of</strong> Munida intermedia and M.sarsi<br />
(Crustacea:Anomura) on <strong>the</strong> Galician Continental Shelf (NW Spain): Application <strong>of</strong> Geostatistical Analysis. Estuarine,<br />
Coastal and Shelf Science (1992) 35, 637-647.<br />
Gulland, J.A. (1983). Fish Stock Assessment: A Manual <strong>of</strong> Basic methods. Volume 1. FAO, Rome. 223 pp.<br />
Hall, S.J. (1999). The Effects <strong>of</strong> Fishing on Marine Ecosystems and Communities. Blackwell Scientific Publ., London. 274pp.<br />
Kaluzny, S.P., Vega, S. C., Cardoso, T.P., and Shelly, A,A (1998). S+Spatial Stats- Users Manual for Windows and Unix.<br />
Springer- Verlag New York, Inc., New York. 321 pp.<br />
Kanyerere, G.Z. (1999). Trawl Selectivity and <strong>the</strong> Effect <strong>of</strong> Clogging on Standard Trawl Surveys on Lake Malawi. Government<br />
<strong>of</strong> Malawi, Fisheries Department. Fisheries Bulletin No. 39. 25pp.<br />
Palsson, O.K., Bulirani, A., and Banda, M (1999). A Review <strong>of</strong> Biology, Fisheries and Population dynamics <strong>of</strong> Chambo<br />
Oreochromis spp., Cichlidae) in Lakes Malawi and Malombe. Government <strong>of</strong> Malawi, Fisheries Department, Fisheries<br />
Bulletin No. 38. 35 pp.<br />
Patterson, G. & Kachinjika, O. (1995). Limnology and Phytoplankton Ecology. In A. Menz (ed.), The Fishery Potential and<br />
Productivity <strong>of</strong> <strong>the</strong> Pelagic zone <strong>of</strong> Lake Malawi/Niassa. Natural Resources Institute, Chatham, UK. pp307-349<br />
Pelletier, D. & Parma, A.M.(1994). Spatial Distribution <strong>of</strong> Halibut (Hippoglossus stenolepsis): An Application <strong>of</strong> Geostatistics to<br />
Longline Survey Data. Can. J. Fish. Aquatic(1994). Sci. 51, 1506-1517.<br />
Turner, G.F. (1996). Offshore Cichlids <strong>of</strong> Lake Malawi. Cichlid Press, D-31864 Lauenau, 236 pp.<br />
Turner, G.F.,Tweddle, D., and Makwinja, R.D. (1995). Changes in Demersal Cichlid Communities as a result <strong>of</strong> Trawling in<br />
Sou<strong>the</strong>rn Lake Malawi. In T.J. Pitcher and P.J.D. Hart (eds.), The Impact <strong>of</strong> Species changes in African Lakes.<br />
Chapman and Hall, London, pp.397-412.<br />
Turner, J. (1976). Promotion <strong>of</strong> Integrated Fishery Development-Malawi. An Analysis <strong>of</strong> <strong>the</strong> various <strong>fisheries</strong> <strong>of</strong> Lake Malawi.<br />
Technical Report 1, Rome, FAO. 73pp.<br />
Rosner, B. (1995). Fundamentals <strong>of</strong> Biostatistics. Wadsworth Publ. Company, California 94002. 661 pp.<br />
Sparre, P., Ursin, E. & Venema, S.C. (1989). Introduction to Tropical Fish Stock Assessment. Part 1-Manual. FAO, Fisheries<br />
Technical Paper No. 306/1, 337 pp.
189<br />
Lake Malawi Fisheries Management Symposium - Proceedings<br />
Preliminary Investigations <strong>of</strong> Community Level Responses to Benthic Trawling in<br />
<strong>the</strong> Demersal Fish Fauna <strong>of</strong> Lake Malawi/Niassa, Africa.<br />
Will Darwall<br />
Department <strong>of</strong> Biological Sciences, University <strong>of</strong> Hull, UK, Overseas Development Group / School <strong>of</strong> Development Studies,<br />
University <strong>of</strong> East Anglia, UK<br />
Introduction<br />
A demersal trawl fishery was initiated in 1968 in <strong>the</strong> far south <strong>of</strong> <strong>the</strong> South East Arm (SEA) <strong>of</strong> Lake Malawi in an<br />
area since designated as "Area A" (Tarbit 1971) (Fig. 1). The fishery in Area A has a mean annual yield <strong>of</strong> 800<br />
metric ‘red’ (Bulirani et al. 1999) and targets an estimated 70-80 species, mostly from <strong>the</strong> family Cichlidae.<br />
Management has been largely based on <strong>the</strong> application <strong>of</strong> single species models (Tweddle & Magasa 1989) which<br />
are unable to account for species specific responses to fishing which result from <strong>the</strong> wide range <strong>of</strong> life histories<br />
expressed (see (Adams 1980) for a review <strong>of</strong> life history influence on response to fishing). Life history<br />
characteristics <strong>of</strong> <strong>the</strong> target species range from those maturing at 37mm (Pseudotropheus livingstonii) with a mean<br />
fecundity <strong>of</strong> 25, to those maturing at 160mm (Buccochromis lepturus) with an estimated mean fecundity <strong>of</strong> 450<br />
(Duponchelle & Ribbink 2000). Growth rate estimates for <strong>the</strong>se species still remain uncertain but include values <strong>of</strong><br />
K ranging from 0.49 - 1.82 (Iles 1971; Tweddle & Turner 1977; Duponchelle & Ribbink 2000).<br />
Kyela<br />
Nkhata Bay<br />
Chin<strong>the</strong>che<br />
Nkhotakota<br />
Domira Bay<br />
Senga Bay<br />
Mbamba Bay<br />
SWA SEA<br />
Metangula<br />
Maponda<br />
Area A<br />
Figure 1. Lake Malawi showing <strong>the</strong> location <strong>of</strong> <strong>the</strong> study area, Area A, in <strong>the</strong> South-East Arm (SEA).<br />
Previous studies in Area A have already identified a reduction in fishing yields, changes in species composition,<br />
local extirpation <strong>of</strong> species, decline in abundance <strong>of</strong> large species, increased abundance <strong>of</strong> small species, and an<br />
initial decline in species richness (FAO 1976; Turner 1977a; Turner 1977b; Turner et al. 1995; Stauffer J.R. et al.<br />
1997). The application <strong>of</strong> multispecies models, which may attempt to account for <strong>the</strong> varied species responses to<br />
fishing, is unlikely to be successful because not only are <strong>the</strong> data requirements extensive but it would be hard to<br />
implement <strong>management</strong> recommendations based on a whole suit <strong>of</strong> measures tailored for each individual species, or<br />
group <strong>of</strong> species. An alternative approach is to assess and manage <strong>the</strong> fishery at <strong>the</strong> level <strong>of</strong> <strong>the</strong> fish community or<br />
ecosystem. The ecosystem / community level approach to fishery <strong>management</strong> is becoming more accepted at <strong>the</strong><br />
global level (Hollingworth 2000) and, given <strong>the</strong> multispecies, multigear nature <strong>of</strong> <strong>the</strong> fishery, it should be considered<br />
for Lake Malawi.<br />
In this paper community level responses in <strong>the</strong> demersal fish fauna <strong>of</strong> Area A were investigated throughout <strong>the</strong> thirty<br />
year period <strong>of</strong> benthic trawling with an aim to identifying a suitable "indicator" parameter for future monitoring <strong>of</strong><br />
community level changes in <strong>the</strong> fishery. The study includes analyses <strong>of</strong> both species and trophic composition.
Methods<br />
190<br />
Lake Malawi Fisheries Management Symposium - Proceedings<br />
Species Compositions<br />
Species compositions were obtained from experimental trawl surveys conducted by <strong>the</strong> Malawi Fisheries Research Unit (FRU) since 1970.<br />
Analyses were restricted to catches from within <strong>the</strong> 20-40m depth range which is mainly targeted by <strong>the</strong> trawl fishery in Area A. Inconsistencies<br />
in taxonomic identifications and catch sampling methodologies combined with <strong>the</strong> replacement <strong>of</strong> <strong>the</strong> research vessel E<strong>the</strong>lwyn Trewavas with<br />
<strong>the</strong> RV Ndunduma in 1993/4 necessitated extensive standardisation <strong>of</strong> data.<br />
Data standardisation<br />
Sampling methodologies<br />
There were a number <strong>of</strong> inconsistencies in <strong>the</strong> way trawl catches were sampled through <strong>the</strong> years. The large catfish<br />
and 'o<strong>the</strong>rs' (large cyprinids, mormyrids and large cichlids such as Oreochromis spp. and Buccochromis spp.) had<br />
already been discarded from <strong>the</strong> data obtained for <strong>the</strong> 1991-92 surveys (Turner et al. 1995). Consequently,<br />
community changes can only be assessed for <strong>the</strong> 'small' fish subset <strong>of</strong> <strong>the</strong> community, mainly comprising cichlids 1 .<br />
There may still be inconsistencies between survey periods for Oreochromis and Buccochromis spp. as <strong>the</strong> size at<br />
which <strong>the</strong>y were considered to be "large" and thus excluded from <strong>the</strong> "smalls" category has not been strictly<br />
determined such that different surveys may have discarded different proportions <strong>of</strong> <strong>the</strong>se species.<br />
Taxonomic inconsistencies<br />
The data set for this study spans a period <strong>of</strong> 30 years during which time many <strong>of</strong> <strong>the</strong> species names and cheironyms<br />
used have changed. Considerable effort has been put into tracing <strong>the</strong>se changes in nomenclature and in <strong>the</strong><br />
production <strong>of</strong> a standardised list <strong>of</strong> species names that can be applied to all surveys. Many name changes were<br />
successfully traced through <strong>the</strong> literature or sorted out following discussions with Pr<strong>of</strong>. George Turner who was<br />
responsible for many <strong>of</strong> <strong>the</strong> new cheironyms introduced during <strong>the</strong> 1991-92 survey. For all remaining cases with<br />
potential for taxonomic confusion taxa have been consolidated into species complexes or identification has been<br />
restricted to <strong>the</strong> level <strong>of</strong> genus.<br />
Standardisation <strong>of</strong> catches from E<strong>the</strong>lwynn and Ndunduma trawls<br />
In 1993 both <strong>the</strong> RV E<strong>the</strong>lwynn Trewavas and RV Ndunduma operated simultaneously allowing a direct<br />
comparison <strong>of</strong> trawl catch rates from <strong>the</strong> two vessels (Banda et al. 1996). The difference in codend mesh size, 38mm<br />
on Ndunduma and 25mm on E<strong>the</strong>lwynn, was reported not to have a major impact on catch biomass and <strong>the</strong> two<br />
gears were considered to have "identical selectivity curves for <strong>the</strong> size at first capture". Size frequency distributions<br />
for catches from each vessel were very similar for fish below approximately 10cm (TL) above which <strong>the</strong> Ndunduma<br />
catches were significantly greater. The greater catches by <strong>the</strong> Ndunduma were said to be a product <strong>of</strong> its greater<br />
trawling speed enabling increased capture rates for larger fish such as catfish, cyprinids and large cichlids. The<br />
greater swept area, for both horizontal and vertical dimensions, would also have accounted for <strong>the</strong> greater yields.<br />
Unfortunately no detailed comparison <strong>of</strong> species compositions for catches from <strong>the</strong> two vessels was reported and <strong>the</strong><br />
original data for <strong>the</strong>se trawls appears to have been lost (Banda pers. comm.). The reactivation <strong>of</strong> <strong>the</strong> E<strong>the</strong>lwynn<br />
Trewavas would be most beneficial for direct comparison <strong>of</strong> <strong>the</strong> species selectivities <strong>of</strong> <strong>the</strong> two vessels.<br />
In recognition <strong>of</strong> <strong>the</strong> differences in catch compositions from <strong>the</strong> two vessels all shoaling '<strong>of</strong>f-bottom' species which<br />
would be caught preferentially by <strong>the</strong> Ndunduma but not by <strong>the</strong> E<strong>the</strong>lwynn Trewavas were excluded from <strong>the</strong><br />
analyses. Species groups excluded under this category were all Copadichromis spp., Diplotaxodon spp, and<br />
Rhamphochromis spp. The larger, faster swimming species, also preferentially caught by <strong>the</strong> Ndunduma, were<br />
automatically excluded as <strong>the</strong>y would have been sorted into <strong>the</strong> 'large fish' portion <strong>of</strong> <strong>the</strong> catch. The remaining<br />
portion <strong>of</strong> <strong>the</strong> catch, for which time series analyses could be conducted, comprises <strong>the</strong> group <strong>of</strong> fish known locally<br />
as 'Chisawsawa' which constitutes <strong>the</strong> truly demersal cichlid community. The only non-cichlid included is <strong>the</strong> small<br />
catfish, Synodontis njassae. As all species compositions are presented as percentages <strong>of</strong> total biomass<br />
standardisation <strong>of</strong> trawling times and swept areas was not required.<br />
Fish diets and allocation <strong>of</strong> trophic guilds<br />
Trophic analyses were based on <strong>the</strong> results <strong>of</strong> dietary studies. Fish dietary components were determined from<br />
stomach analysis <strong>of</strong> 114 species from across <strong>the</strong> whole demersal fish community. Over 3,000 fish were sampled<br />
with <strong>the</strong> sample sizes weighted towards those species most dominant in <strong>the</strong> catch. This sampling program provided<br />
1 Data on <strong>the</strong> "large fish" component has since been obtained and will be included in future analyses.
191<br />
Lake Malawi Fisheries Management Symposium - Proceedings<br />
dietary data for 95% <strong>of</strong> <strong>the</strong> mean catch biomass. The results <strong>of</strong> stomach analysis were confirmed in a number <strong>of</strong><br />
cases by results from analysis <strong>of</strong> stable isotope ratios.<br />
Statistical analysis<br />
Dominance curves, diversity indices, and Multi-Dimensional Scaling (MDS) ordination techniques were used in <strong>the</strong><br />
analyses <strong>of</strong> temporal changes in community composition (Primer S<strong>of</strong>tware 1994). MDS ordinations were based on<br />
Bray-Curtis Similarity matrices <strong>of</strong> 4 th root transformed percentage biomass for each species or trophic guild. The<br />
sample unit was taken as each individual trawl catch.<br />
Results<br />
The demersal fish community<br />
The trophic structure <strong>of</strong> <strong>the</strong> demersal fish community includes 4-5 trophic levels based predominantly on <strong>the</strong><br />
consumption <strong>of</strong> detritus and diatoms (Fig. 2). The main food items were, in descending order <strong>of</strong> dominance, detritus<br />
and diatoms (combined in a "diatomaceous ooze"), molluscs, copepods (mainly cylcopoids), o<strong>the</strong>r fish, chironomid<br />
larvae, cladocera, o<strong>the</strong>r insect larvae, and oligochaetes.<br />
Tilapines /<br />
Haplochromines<br />
Catfish<br />
The Fishery<br />
Pisciv. Haplochromines<br />
Haplochromines / Synodontis<br />
Molluscs Caridina<br />
Detritus / diatoms / algae<br />
Figure 2. Schematic diagram <strong>of</strong> <strong>the</strong> demersal fish community food-web.<br />
Temporal changes in community composition<br />
Non-cichlids<br />
Herbivorous /<br />
detritivorous<br />
Carnivorous Inverts<br />
Species composition<br />
Species compositions were obtained from surveys over <strong>the</strong> 1970-75 period and from 1990 to 1998. No surveys were<br />
conducted during <strong>the</strong> 1980's. MDS ordination demonstrates a clear temporal reduction in diversity between<br />
individual trawl catches within each survey period (Fig. 3). In effect <strong>the</strong> similarity between individual trawl catches<br />
within a survey period has increased in more recent years (<strong>the</strong> mean similarity between trawls was 38.89 in 1973<br />
and 54.28 in 1998 - Bray-Curtis similarity index). K-dominance curves show that <strong>the</strong> community has become<br />
dominated (in terms <strong>of</strong> biomass) by fewer species in recent years (Fig. 4). There was no significant reduction in<br />
species richness (at <strong>the</strong> restricted taxonomic level used in <strong>the</strong> analyses) or change in species distributions over time.<br />
The temporal trend for increasing dominance was reversed during <strong>the</strong> last survey period (1995-98) when dominance<br />
was shown to have declined. This apparent reversal towards <strong>the</strong> original state <strong>of</strong> evenness may indicate a degree <strong>of</strong><br />
community resilience to fishing, as originally suggested by Tweddle and Magasa (1989).<br />
Bacteria
192<br />
Lake Malawi Fisheries Management Symposium - Proceedings<br />
Figure 3. MDS ordination in which each point represents <strong>the</strong> species composition <strong>of</strong> a single trawl catch.<br />
The distance between points is a measure <strong>of</strong> <strong>the</strong>ir similarity where points closest toge<strong>the</strong>r are <strong>the</strong> most<br />
similar. Trawls from each survey period are enclosed in ellipses.<br />
Cumilative % biomass<br />
100<br />
90<br />
80<br />
70<br />
60<br />
50<br />
40<br />
30<br />
20<br />
10<br />
0<br />
1 11 21 31 41<br />
Ranked species<br />
Figure 4. K-dominance curves for species biomass.<br />
1971-73<br />
1975<br />
1991-92<br />
1995-98<br />
1971-73<br />
1975<br />
1991-92<br />
1995-98
193<br />
Lake Malawi Fisheries Management Symposium - Proceedings<br />
Trophic guilds<br />
Species were allocated to one <strong>of</strong> ten trophic guilds defined as collections <strong>of</strong> species using similar combinations <strong>of</strong><br />
food types. MDS ordination shows a clear change in guild composition over time (Fig. 5). The most significant<br />
change was seen between <strong>the</strong> 1971-73 and 1975 survey periods in <strong>the</strong> early stages <strong>of</strong> development <strong>of</strong> <strong>the</strong> fishery<br />
(ANOSIM, R statistic = 0.316, p < 0.001). Little change was observed between 1975 and 1991-92 but by <strong>the</strong> time <strong>of</strong><br />
<strong>the</strong> 1997-98 survey guild composition showed no significant difference from <strong>the</strong> original 1971-73 state. The return<br />
to <strong>the</strong> original state following a period <strong>of</strong> change follows <strong>the</strong> pattern <strong>of</strong> change described above for species<br />
compositions.<br />
1971-73<br />
1971-73<br />
1975<br />
1991-92<br />
1995<br />
1997-98<br />
1991-92<br />
Figure 5. MDS ordination <strong>of</strong> trophic guilds. Each point represents <strong>the</strong> trophic guild composition <strong>of</strong> a single<br />
trawl catch. The distance between points is a measure <strong>of</strong> <strong>the</strong>ir similarity where points closest toge<strong>the</strong>r are<br />
<strong>the</strong> most similar.<br />
Trophic biomass pyramids<br />
Pyramids <strong>of</strong> biomass were constructed by multiplying <strong>the</strong> percentage compositions <strong>of</strong> food items for each species by<br />
<strong>the</strong> species percentage composition in <strong>the</strong> community (Fig. 6). The mean trophic level dropped from an initial value<br />
<strong>of</strong> 3.02 in 1971-73 to a low <strong>of</strong> 2.71 in 1975. By <strong>the</strong> time <strong>of</strong> <strong>the</strong> 1995-98 survey period <strong>the</strong> trophic level had risen<br />
back to near its original level at 2.95.<br />
Trophic Level<br />
Trophic Level<br />
5<br />
4<br />
3<br />
2<br />
5<br />
4<br />
3<br />
2<br />
1971-73<br />
0 10 20 30 40 50<br />
% Com position<br />
1991-92<br />
0 10 20 30 40 50<br />
% Composition<br />
Trophic Level<br />
Trophic Level<br />
Figure 6. Pyramids <strong>of</strong> biomass. Each plot depicts <strong>the</strong> mean relative proportion <strong>of</strong> each trophic level within<br />
<strong>the</strong> community for that period <strong>of</strong> survey.<br />
5<br />
4<br />
3<br />
2<br />
1975<br />
1995-98<br />
1975<br />
1995<br />
5<br />
4<br />
3<br />
2<br />
0 10 20 30 40 50<br />
% Composition<br />
0 10 20 30 40 50<br />
% Com position
194<br />
Lake Malawi Fisheries Management Symposium - Proceedings<br />
Conclusions and Recommendations<br />
Species compositions, species diversity (dominance/evenness) and trophic composition have all changed<br />
significantly over <strong>the</strong> 30 year period <strong>of</strong> study. All <strong>of</strong> <strong>the</strong>se community descriptors have followed a similar pattern <strong>of</strong><br />
change. If <strong>the</strong>se patterns are to be interpreted as a community response to fishing it would appear that <strong>the</strong> initiation<br />
<strong>of</strong> <strong>the</strong> fishery has stimulated a rapid alteration in community structure followed by a period <strong>of</strong> relative stability and,<br />
finally, a gradual return towards <strong>the</strong> original state by <strong>the</strong> 1995-98 period. Such a response would be typical <strong>of</strong> that<br />
expected from a community resilient to change. A more useful interpretation <strong>of</strong> this last observation, however,<br />
awaits <strong>the</strong> analysis <strong>of</strong> an extended time series (including data from 1999-2000) combined with analyses for possible<br />
correlation <strong>of</strong> dominance with levels <strong>of</strong> fishing effort, primary productivity and o<strong>the</strong>r environmental variables (work<br />
in progress).<br />
Changes in species dominance parallel <strong>the</strong> changes recorded for all o<strong>the</strong>r aspects <strong>of</strong> community structure<br />
investigated in this study and may, as such, serve as a suitable "indicator" for monitoring community level responses<br />
to fishing pressure. It is well documented that alterations to community structure following fishing may lead to<br />
significant changes in fishery productivity and stability (Jennings & Kaiser 1998). Such community level changes<br />
would not be detected by <strong>the</strong> current approaches to fishery assessment in Lake Malawi. As species dominance can<br />
easily be calculated from <strong>the</strong> data already being collected as part <strong>of</strong> <strong>the</strong> regular program <strong>of</strong> monitoring by <strong>the</strong> FRU it<br />
is recommended that this measure be included as a monitoring parameter for future fishery assessment on Lake<br />
Malawi.<br />
Acknowledgements<br />
Thanks are given to Mr Davis Mandere (FRU) who was responsible for all recent species identifications and to<br />
Valerie Choiseul (EU project) and Tony Mhango (FRU) for <strong>the</strong>ir work on <strong>the</strong> dietary analysis. This work is based<br />
on data obtained as part <strong>of</strong> <strong>the</strong> EU funded INCO-DC project: "The trophic ecology <strong>of</strong> <strong>the</strong> demersal fish community<br />
<strong>of</strong> Lake Malawi/Niassa, Africa."<br />
References<br />
Adams, P. B. 1980. Life history patterns in marine fishes and <strong>the</strong>ir consequences for <strong>management</strong>. Fishery Bulletin, 78, 1-12.<br />
Banda, M., Tomasson, T. & Tweddle, D. 1996. Assessment <strong>of</strong> <strong>the</strong> deep water trawl <strong>fisheries</strong> <strong>of</strong> <strong>the</strong> South East Arm <strong>of</strong> Lake<br />
Malawi using exploratory surveys and commercial catch data. Stock Assessment in Inland Fisheries (ed I. G. Cowx),<br />
pp. 53-75. Fishing News Books, Oxford.<br />
Bulirani, A. E., Banda, M. C., Pálsson, O. K., Weyl, O. L. F., Kanyerere, G. Z., Manase, M. M. & Sipawe, R. D. 1999. Fish<br />
Stocks and Fisheries <strong>of</strong> Malawian Waters. Resource Report. 1999. Lilongwe, Malawi, Government <strong>of</strong> Malawi<br />
Fisheries Department.<br />
Duponchelle, F. & Ribbink, A. J. 2000. Fish Ecology Report: Lake Malawi/Nyassa/Niassa Biodiversity Conservation Project. 1-<br />
139. SADC/GEF.<br />
FAO. 1976. Promotion <strong>of</strong> integrated fishery development, Malawi. FI:DP/MLW/75/109, Technical Report 1. Rome.<br />
Hollingworth, C. E. 2000. Ecosystem Effects <strong>of</strong> Fishing. ICES Journal <strong>of</strong> Marine Science, 57, 465-792.<br />
Iles, T. D. 1971. Ecological aspects <strong>of</strong> growth in African cichlid fishes. J.Cons.int.Explor.Mer., 33, 363-385.<br />
Jennings, S. & Kaiser, M. J. 1998. The Effects <strong>of</strong> fishing on Marine Ecosystems. Advances in Marine Biology, 34, 201-352.<br />
Stauffer J.R., Arnegard M.E., Centron M., Sullivan J.J., Chitsulo L.A., Turner, G. F., Chiotha S. & McKaye, K. R.1997.<br />
Controlling vectors and hosts <strong>of</strong> parasitic diseases using fishes. Bioscience, 47, 41-49.<br />
Tarbit, J. 1971. Lake Malawi Trawling Survey: Interim Report 1969-1971. 2, 1-16. 1971. Zomba, Malawi, Ministry <strong>of</strong><br />
Agriculture & Natural Resources. Fisheries Bulletin Ref Type: Report.<br />
Turner, G. F., Tweddle, D. & Makwinja, R. D. 1995. Changes in demersal cichlid communities as a result <strong>of</strong> trawling in sou<strong>the</strong>rn<br />
Lake Malawi. The Impact <strong>of</strong> Species Changes in African Lakes (eds T. J. Pitcher & P. J. B. Hart), pp. 397-412.<br />
Chapman & Hall, London.<br />
Turner, J. L. 1977a. Changes in size structure <strong>of</strong> cichlid populations <strong>of</strong> Lake Malawi resulting from bottom trawling. Journal <strong>of</strong><br />
<strong>the</strong> Fisheries Research Board <strong>of</strong> Canada, 34, 232-238.<br />
Turner, J. L. 1977b. Some effects <strong>of</strong> demersal trawling in Lake Malawi (Lake Nyassa) from 1968 to 1974. Journal <strong>of</strong> Fish<br />
Biology , 10, 261-272.<br />
Tweddle, D. & Magasa, J. H. 1989. Assessment <strong>of</strong> mulitspecies cichlid <strong>fisheries</strong> <strong>of</strong> <strong>the</strong> Sou<strong>the</strong>ast Arm <strong>of</strong> Lake Malawi, Africa.<br />
J.Cons.int.Explor.Mer., 45, 209-222.<br />
Tweddle, D. & Turner, J. L. 1977. Age, growth and natural mortality rates <strong>of</strong> some cichlid fishes <strong>of</strong> Lake Malawi.<br />
Journal <strong>of</strong> Fish Biology, 10, 385-398.
195<br />
Lake Malawi Fisheries Management Symposium - Proceedings<br />
Resource use overlaps between <strong>the</strong> pair trawl and small-scale <strong>fisheries</strong> in <strong>the</strong><br />
sou<strong>the</strong>ast arm <strong>of</strong> Lake Malawi: preliminary results.<br />
Thomas Eddie Nyasulu<br />
Fisheries Research Unit, P. O. Box 27, Monkey Bay<br />
Abstract<br />
Since <strong>the</strong> development <strong>of</strong> <strong>the</strong> pair trawl fishery, <strong>the</strong>re has been a conflict between <strong>the</strong> small-scale and this fishery.<br />
This study assesses <strong>the</strong> abundance, species composition and size distribution <strong>of</strong> fish exploited by small-scale and<br />
pair trawl in Lake Malawi. Preliminary results have shown that pair trawlers appear to target some shallow-water<br />
fish species at small sizes. Fur<strong>the</strong>rmore, <strong>the</strong>re appears to be overlaps in <strong>the</strong> species harvested by pair trawl and<br />
small-scale <strong>fisheries</strong>.<br />
Introduction<br />
Lake Malawi, <strong>the</strong> sou<strong>the</strong>rnmost <strong>of</strong> <strong>the</strong> great <strong>lake</strong>s <strong>of</strong> Africa covers an area <strong>of</strong> about 30,800km 2 which ranks it ninth<br />
in order <strong>of</strong> size among <strong>the</strong> world’s <strong>lake</strong>s. Experimental bottom trawling in 1965 revealed <strong>the</strong> presence <strong>of</strong><br />
commercially exploitable stock <strong>of</strong> demersal fish, mostly cichlids (Turner 1975). In 1968 a commercial trawl fishery<br />
was initiated in <strong>the</strong> sou<strong>the</strong>ast arm <strong>of</strong> Lake Malawi (Figure 1) in Areas A & B by Maldeco Fisheries Ltd. The pair<br />
trawl fishery was developed to eliminate <strong>the</strong> expensive winching machinery and by 1972, trawling started in Area B<br />
(Turner 1975). In <strong>the</strong> early 1970s, <strong>the</strong> pair trawl fishery realized a mean CPUE value <strong>of</strong> approximately 2 tons per<br />
day and a total <strong>of</strong> 22 pair trawl units were, <strong>the</strong>n, licensed in this fishery (Jambo, in press). However, only five units<br />
presently operate in both sou<strong>the</strong>ast and southwest arms <strong>of</strong> <strong>the</strong> <strong>lake</strong> and present catch-effort data for <strong>the</strong> same area<br />
indicates that <strong>the</strong> CPUE is approaching 1 ton per day (Banda and Tomasson 1997). This decline in <strong>the</strong> number <strong>of</strong><br />
units in operation and <strong>the</strong> catch per unit effort suggests that <strong>the</strong> fishery is collapsing.<br />
The pair trawlers are restricted to fish in areas more than 20 metres deep and at least 1 nautical mile from <strong>the</strong> shore.<br />
This is similar to <strong>the</strong> area fished by <strong>the</strong> small-scale fishery and <strong>the</strong>re are indications that <strong>the</strong>re is competition<br />
between <strong>the</strong> pair-trawlers and <strong>the</strong> small-scale <strong>fisheries</strong> is over <strong>the</strong> fishing ground. Small-scale fishers operate using<br />
a variety <strong>of</strong> gears including open water seines, beach seines, gill nets and hook and line (Weyl et al. 2000). During<br />
<strong>the</strong> early days <strong>of</strong> operations, <strong>the</strong>re were no restrictions over <strong>the</strong> type <strong>of</strong> fishing gears to be used nei<strong>the</strong>r were <strong>the</strong>re<br />
any restrictions on any fishing activity until 1952 when a minimum <strong>of</strong> 102 mm mesh size for seine nets with <strong>the</strong><br />
headline length <strong>of</strong> greater than 274 metres was put in place (Lowe 1952). Presently most <strong>of</strong> <strong>the</strong> small-scale <strong>fisheries</strong><br />
involve traditional gears which operate manually while a few chilimira, kauni and gill netters use motorized boats.<br />
Chambo was <strong>the</strong> main species caught in <strong>the</strong> 1970s by both <strong>the</strong> commercial and <strong>the</strong> small-scale <strong>fisheries</strong>. The<br />
collapse <strong>of</strong> <strong>the</strong> chambo fishery in <strong>the</strong> sou<strong>the</strong>rn arms <strong>of</strong> Lake Malawi and Lake Malombe (Banda et al 1997, Weyl et<br />
al 1999) and <strong>the</strong> growing demand for fish by <strong>the</strong> growing Malawi population has aggravated some conflicts between<br />
pair-trawlers and <strong>the</strong> small-scale fishers, each sector accusing <strong>the</strong> o<strong>the</strong>r over <strong>the</strong> depletion <strong>of</strong> <strong>the</strong> fish stocks. This<br />
paper tries to look at <strong>the</strong> causes and effects <strong>of</strong> <strong>the</strong> conflicts and provide possible preliminary recommendations that<br />
would be applied to both fishing sectors. This survey was designed to determine if <strong>the</strong>re is any resource use<br />
overlaps between <strong>the</strong> small-scale and pair trawl fishery in <strong>the</strong> sou<strong>the</strong>ast arm <strong>of</strong> Lake Malawi and attempt to<br />
determine <strong>the</strong> causes for <strong>the</strong> conflicts which exist between <strong>the</strong> pair trawl and small-scale <strong>fisheries</strong> over <strong>the</strong> <strong>fisheries</strong><br />
resources in <strong>the</strong> study area. It should however be noted that this study is in its initial phase and that results presented<br />
here are preliminary.<br />
Methods <strong>of</strong> data collection<br />
The survey was conducted in <strong>the</strong> sou<strong>the</strong>ast arm <strong>of</strong> Lake Malawi (Figure 1) and small scale and pair trawl catches<br />
were sampled at Kela beach, Mpwepwe and Namiasi.Fish samples were collected from pair-trawlers and all smallscale<br />
fishermen to determine <strong>the</strong> species composition and size selectivity <strong>of</strong> <strong>the</strong> catches. A representative sample<br />
was taken from <strong>the</strong> total catch which was later sorted to <strong>the</strong> species level. Each species component in <strong>the</strong> sample<br />
was weighed and all fish in <strong>the</strong> sample were measured for total length to <strong>the</strong> nearest millimetre.
Figure 1. Map <strong>of</strong> <strong>the</strong> study sites in <strong>the</strong> sou<strong>the</strong>ast arm (SEA) <strong>of</strong> Lake Malawi.<br />
196<br />
Lake Malawi Fisheries Management Symposium - Proceedings<br />
Results and discussion<br />
The in both pair-trawl and small-scale <strong>fisheries</strong>, <strong>the</strong> species composition is multi-species and target species are<br />
determined by <strong>the</strong> mode <strong>of</strong> operation <strong>of</strong> <strong>the</strong> gear ra<strong>the</strong>r than by <strong>the</strong> preference <strong>of</strong> <strong>the</strong> fisher. More than 60 species<br />
were recorded from <strong>the</strong> small scale fishery and <strong>the</strong> pair trawl fishery. The genera comprising <strong>the</strong> majority <strong>of</strong> <strong>the</strong> pair<br />
trawl catch composition and <strong>the</strong>ir contribution to various small scale gears is shown in Table 1. It is evident that<br />
<strong>the</strong>re is considerable overlap in <strong>the</strong> genera harvested by <strong>the</strong> small-scale and pair-trawl <strong>fisheries</strong> (Table 1).<br />
Fur<strong>the</strong>rmore, a number <strong>of</strong> shallow water species, including Otopharynx argyrosoma, Nyassachromis argyrosoma,<br />
and Pseudotropheus livingstonii were recorded in pair trawl catches. This indicates that <strong>the</strong> 1-nautucal mile<br />
<strong>of</strong>fshore rule is not abided to by <strong>the</strong> pair-trawl <strong>fisheries</strong>.<br />
Table 1. Percent contribution <strong>of</strong> <strong>the</strong> genus Oreochromis, Nyassachromis, Ctenopharynx, Lethrinops,<br />
Otopharynx, Rhamphochromis and Copadichromis to <strong>the</strong> catch in <strong>the</strong> pair trawl fishery, gill net fishery,<br />
chilimira/kauni, hand line and beach seine fishery.<br />
Pair Trawl<br />
GN<br />
1-2 inch<br />
GN<br />
2-3 inch<br />
GN<br />
3inch +<br />
Chilimira Kauni Hand lines<br />
Beach<br />
seines<br />
Oreochromis 2.3 0.2 24.0 68.0 9.9 34.0 3.5 14.5<br />
Nyassachromis 4.0 0.0 15.2 0.0 0.0 0.0 0.0 0.0<br />
Ctenopharynx 5.9 0.0 0.0 0.0 0.0 0.0 0.0 0.0<br />
Lethrinops 8.3 3.4 2.7 0.0 0.0 0.2 2.6 11.2<br />
Otopharynx 12.9 1.8 0.0 0.0 1.5 0.0 18.5 8.2<br />
Rhamphochromis 17.1 2.5 0.0 2.7 42.5 37.0 13.3 5.7<br />
Copadichromis 21.3 70.2 14.8 0.0 25.0 5.0 4.1 12.2<br />
Table 1 shows that <strong>the</strong> main areas <strong>of</strong> overlap between <strong>the</strong> pair trawl and <strong>the</strong> small scale fishery are in <strong>the</strong> genus<br />
Oreochromis, Rhamphochromis and Copadichromis. While Oreochromis was not a major component <strong>of</strong> <strong>the</strong> pair<br />
trawl catch (
197<br />
Lake Malawi Fisheries Management Symposium - Proceedings<br />
different length sizes within <strong>the</strong> range <strong>of</strong> 110 cm and 230 cm. From Figure 2 it is clear that a high proportion <strong>of</strong><br />
Rhamphochromis spp. caught by <strong>the</strong> pair-trawlers were immature (Figure 2). In <strong>the</strong> small-scale fishery, on <strong>the</strong> o<strong>the</strong>r<br />
hand, a large proportion <strong>of</strong> <strong>the</strong> catch was mature. In <strong>the</strong> gill net fishery almost all <strong>the</strong> fish caught were mature. The<br />
chilimira kauni and <strong>the</strong> beach seine <strong>fisheries</strong> on <strong>the</strong> o<strong>the</strong>r hand appear to target smaller Rhamphochromis. Although,<br />
greater amounts <strong>of</strong> <strong>the</strong> fish caught in <strong>the</strong> chilimira/kauni fishery are mature, <strong>the</strong>re is also a considerable amount <strong>of</strong><br />
immature fish in <strong>the</strong> catch. This contrasts with <strong>the</strong> pair-trawl fishery in which immature individuals dominated <strong>the</strong><br />
catch. It is <strong>the</strong>refore evident that <strong>the</strong>re is very high competition for this resource between <strong>the</strong> two fishing sectors,<br />
both for <strong>the</strong> mature and <strong>the</strong> immature fish.<br />
Pair Trawl<br />
Frequency<br />
250<br />
200<br />
150<br />
100<br />
50<br />
0<br />
20 50 80 110 140 170 200 230 260 290 320 350 380 410 440<br />
Total length (mm)<br />
Chilimira/kauni<br />
Frequency<br />
Frequency<br />
1500<br />
1000<br />
500<br />
0<br />
20 50 80 110 140 170 200 230 260 290 320 350 380 410 440<br />
Total length (mm)<br />
Gill net<br />
30<br />
25<br />
20<br />
15<br />
10<br />
5<br />
0<br />
20 50 80 110 140 170 200 230 260 290 320 350 380 410 440<br />
Total length (mm)<br />
Beach seine<br />
Frequency<br />
20<br />
15<br />
10<br />
5<br />
0<br />
20 50 80 110 140 170 200 230 260 290 320 350 380 410 440<br />
Total length (mm)<br />
Figure 2. Length frequency <strong>of</strong> Rhamphochromis spp., in <strong>the</strong> pair trawl, chilimira/kauni, gill net and beach<br />
seine <strong>fisheries</strong> <strong>of</strong> <strong>the</strong> sou<strong>the</strong>ast arm <strong>of</strong> Lake Malawi.
198<br />
Lake Malawi Fisheries Management Symposium - Proceedings<br />
Copadichromis virginalis matures at lengths <strong>of</strong> 10.6 cm. This species is one <strong>of</strong> <strong>the</strong> most abundant and economically<br />
important fish in <strong>the</strong> <strong>lake</strong>. This fish is by most fishing gear and <strong>the</strong>re appears to be a degree <strong>of</strong> user overlap in this<br />
resource. Copadichromis virginalis are harvested by <strong>the</strong> pair trawl fishery before maturity and <strong>the</strong>re was only small<br />
contribution <strong>of</strong> mature individuals to <strong>the</strong> total catch (Figure 3). The situation, in general, differs from chilimira/kauni<br />
fishery where most <strong>of</strong> <strong>the</strong> fish caught were mature (Figure 3). Gill nets are selective for mature individuals and most<br />
<strong>of</strong> <strong>the</strong> catch is dominated by fish that range between 115 mm and 140 mm (Figure 3). However, not all <strong>the</strong> fish<br />
found in gill nets are mature since <strong>the</strong>re some evidence <strong>of</strong> fish which were less than 106 mm. This shows that both<br />
fishing sectors harvest a wide length-range <strong>of</strong> C. virginalis <strong>the</strong>re is high competition between <strong>the</strong>se two fishing<br />
sectors for Copadichromis virginalis.<br />
Pair Trawl<br />
Frequency<br />
250<br />
200<br />
150<br />
100<br />
50<br />
0<br />
Chilimira/kauni<br />
Frequency<br />
20 40 60 80 100 120 140<br />
Total length (mm)<br />
600<br />
500<br />
400<br />
300<br />
200<br />
100<br />
0<br />
20 40 60 80 100 120 140<br />
Total length (mm)<br />
Gill net<br />
Frequency<br />
1500<br />
1000<br />
500<br />
Nkacha<br />
Frequency<br />
0<br />
20 40 60 80 100 120 140<br />
Total length (mm)<br />
60<br />
50<br />
40<br />
30<br />
20<br />
10<br />
0<br />
20 40 60 80 100 120 140<br />
Total length (mm)<br />
Figure 2. Length frequency <strong>of</strong> Copadichromis virginalis in <strong>the</strong> pair trawl, chilimira/kauni, gill net and<br />
nkacha net <strong>fisheries</strong> <strong>of</strong> <strong>the</strong> sou<strong>the</strong>ast arm <strong>of</strong> Lake Malawi.
199<br />
Lake Malawi Fisheries Management Symposium - Proceedings<br />
Conclusions and recommendations<br />
These preliminary results have indicated that <strong>the</strong>re is some evidence <strong>of</strong> an overlap for some species between pair<br />
trawl and small-scale <strong>fisheries</strong>. This has been due to <strong>the</strong> fact that both <strong>fisheries</strong> fish in water less that 50 m deep.<br />
While pair trawlers are licensed and bound by <strong>the</strong> regulation to fish in areas that are at least 1 nautical mile <strong>of</strong>fshore<br />
and deeper than 18 meters, <strong>the</strong> presence <strong>of</strong> shallow-water species like Otopharynx argyrosoma, Nyassachromis<br />
argyrosoma and Pseudotropheus spp. shows that chances are very high that <strong>the</strong> pair-trawl fishery operates in waters<br />
shallower than 20 meters and closer than one nautical mile from shore.<br />
While <strong>the</strong> catch compositions in small-scale gears such as chilimira/kauni and gill nets have shown that most <strong>of</strong> <strong>the</strong><br />
fish caught in <strong>the</strong>se <strong>fisheries</strong> are mature, juvenile fish predominate <strong>the</strong> catch in <strong>the</strong> pair-trawl fishery. In addition,<br />
juvenile cichlids, too small to be identified even down to <strong>the</strong> genus level, were also found in <strong>the</strong> catch sampled from<br />
<strong>the</strong> pair trawlers at Namiasi fish landing site. This composition contributed to about 2% <strong>of</strong> <strong>the</strong> total catch sampled<br />
from two fishing units from <strong>the</strong> Namiasi landing site. A different scenario became evident from Mpwepwe where<br />
<strong>the</strong> unit belongs to <strong>the</strong> Fisheries Department. All fish collected from this pair-trawl unit were comparatively large<br />
and approximated <strong>the</strong> size at maturity for individual species. While pair-trawlers are bound by <strong>the</strong> regulation to use<br />
a 38 mm mesh at <strong>the</strong> bunt, <strong>the</strong> presence <strong>of</strong> juvenile fish from <strong>the</strong>se private-owned units from Namiasi indicates that<br />
<strong>the</strong>se pair-trawlers use very small meshed bunts for <strong>the</strong>ir trawl nets.<br />
It is <strong>the</strong>refore imperative that <strong>the</strong>re is a strong need for some <strong>management</strong> efforts to be put in place for <strong>the</strong> pair-trawl<br />
fishery before <strong>the</strong> situation gets out <strong>of</strong> hand. Some <strong>of</strong> <strong>the</strong> many <strong>management</strong> efforts required for <strong>the</strong> fishery are to<br />
enforce <strong>the</strong> 1-nautical mile/18m depth limitation <strong>of</strong> <strong>the</strong> gear and to enforce <strong>the</strong> 38mm minimum mesh size for pairtrawlers.<br />
Acknowledgements.<br />
This Programme was funded by <strong>the</strong> Department <strong>of</strong> Fisheries and NARMAP. Thanks to my fellow researchers,<br />
M<strong>of</strong>fat Manase, Richard Sipawe and Jacqueline Chisambo for jointly using part <strong>of</strong> <strong>the</strong>ir data.<br />
References<br />
Banda, M., and Tomasson, T., 1997. Demersal fish stocks in Sou<strong>the</strong>rn Lake Malawi: Stock Assessment and<br />
Exploitation. Fisheries Department <strong>of</strong> Malawi, Bulletin No. 35, pp 39.<br />
Eccles, D. H., and Trewavas, E., 1989. Malawi Cichlid fishes. The classification <strong>of</strong> some Haplochromine genera.<br />
Herten (W. Germany), Lake Fish Movies, pp335.<br />
Jambo, C. M. (in press). Commercial and artisanal <strong>fisheries</strong> in Lake Malawi: Who is to blame for <strong>the</strong> declining<br />
catches?<br />
Lowe, R. H. 1952. Report on <strong>the</strong> Tilapia and o<strong>the</strong>r fish and fishes <strong>of</strong> Lake Nyasa1945-47, Part 11. London, HMSO,<br />
Colonial Office Fisheries Publ. 1(12), pp126.<br />
Turner, G. F. 1992. The mechanised <strong>fisheries</strong> <strong>of</strong> Lake Malawi. FI:DP/MLW/86/013 Field Document 23.FAO, Rome,<br />
24pp.<br />
Turner, J. L. 1975. Some effects <strong>of</strong> demersal trawling in Lake Malawi (Lake Nyasa) from 1968 to 1974.<br />
Weyl, O. L. F., Banda M. C., Manase, M., Namoto, W., Mwenekibombwe, L. H., 1999. Analysis <strong>of</strong> Catch and<br />
Effort Data for <strong>the</strong> Fisheries <strong>of</strong> Lake Malawi.
200<br />
Lake Malawi Fisheries Management Symposium - Proceedings<br />
Population biology <strong>of</strong> <strong>the</strong> catfish Bagrus meridionalis from <strong>the</strong> sou<strong>the</strong>rn part <strong>of</strong><br />
Lake Malawi.<br />
Moses Banda<br />
Fisheries Research Unit, P.O. Box 27, Monkey Bay, MALAWI-AFRICA. Tel. 265-587-432, E-mail: fru@<strong>malawi</strong>.net<br />
Abstract<br />
The study investigated <strong>the</strong> endemic catfish, Bagrus meridionalis <strong>of</strong> Lake Malawi in order to understand <strong>the</strong>ir ecological relations,<br />
distribution, abundance and life history. The catfish are <strong>the</strong> second most important group <strong>of</strong> targeted species in Lake Malawi’s<br />
<strong>fisheries</strong>. Surveys were done using <strong>the</strong> research vessel, Ndunduma, using a bottom and mid-water trawl from June 1994 to March<br />
1996. The <strong>management</strong> implications <strong>of</strong> <strong>the</strong> ecology in relation to development <strong>of</strong> <strong>the</strong> deep trawl fishery are discussed.<br />
Key words: Catfish, ecology, distribution, abundance, life history, Lake Malawi.<br />
Introduction<br />
The demersal catfish Bagrus meridionalis (Gün<strong>the</strong>r) (local name: kampango), is <strong>the</strong> only bagrid species that occurs<br />
in Lake Malawi. It is one <strong>of</strong> <strong>the</strong> large fish species found in <strong>the</strong> <strong>lake</strong> and is a predator endemic to <strong>the</strong> <strong>lake</strong> and feeds<br />
mainly on small <strong>lake</strong> demersal cichlids. B. meridionalis is one <strong>of</strong> <strong>the</strong> most common and widely distributed species in<br />
<strong>the</strong> <strong>lake</strong>, and inhabits a variety <strong>of</strong> habitats (Jackson et al. 1963).<br />
B. meridionalis is important commercially and is valued as a food fish by <strong>the</strong> rural community. It is caught mainly<br />
by gillnets and long lines in <strong>the</strong> small-scale commercial <strong>fisheries</strong> and by bottom trawlers in <strong>the</strong> large commercial<br />
<strong>fisheries</strong> (Jackson et al. 1963, Tweddle 1982, Sipawe 2001). The small-scale <strong>fisheries</strong> operate mainly in waters<br />
shallower than 20 m and <strong>the</strong> large-scale commercial <strong>fisheries</strong> operate in deeper water (Alimoso 1989). The mean<br />
total annual landings are about 1300 tonnes representing approximately 2.5 % <strong>of</strong> <strong>the</strong> mean annual total fish catch in<br />
Malawi for <strong>the</strong> past decade (Banda 2000).<br />
While several authors have described some aspects <strong>of</strong> its biology, previous studies have focused mainly on feeding<br />
(Jackson et al. 1963, McKaye 1986, LoVullo et al. 1992) and reproductive biology (Jackson et al. 1963, Tweddle<br />
1982, FAO 1976, McKaye 1985, LoVullo et al. 1992, McKaye et al. 1992). Three notable exceptions have looked at<br />
<strong>the</strong> age and growth (Tweddle 1975, Roberts 1990, LoVullo et al. 1992). However, no full account <strong>of</strong> <strong>the</strong> biology and<br />
ecology <strong>of</strong> Kampango in a single area has been published.<br />
This study provided information on <strong>the</strong> distribution and biology <strong>of</strong> <strong>the</strong> Kampango around <strong>the</strong> sou<strong>the</strong>rn part <strong>of</strong> Lake<br />
Malawi, which is under ever-increasing pressure from both <strong>the</strong> small- and <strong>the</strong> large-scale commercial <strong>fisheries</strong>. The<br />
paper contributes to <strong>the</strong> knowledge <strong>of</strong> <strong>the</strong> life history <strong>of</strong> Bagrus, and may be <strong>of</strong> great importance to <strong>the</strong> assessment<br />
and implementation <strong>of</strong> <strong>the</strong> <strong>management</strong> plan for <strong>the</strong> sustainable use <strong>of</strong> <strong>the</strong> deep-water fishery, which is rapidly<br />
expanding.<br />
Materials and methods<br />
The data in this study were collected during <strong>the</strong> stock assessment and biological surveys, from June 1994 to July<br />
1996, carried out in <strong>the</strong> sou<strong>the</strong>ast arm (SEA) and southwest arm (SWA) <strong>of</strong> Lake Malawi (Figure 1) by <strong>the</strong> Fisheries<br />
Department. Stock assessment surveys were done on a quarterly basis and were designed to monitor changes taking<br />
place in <strong>the</strong> SEA and SWA, <strong>the</strong> heavily exploited areas, whilst biological surveys were done in between <strong>the</strong> stock<br />
assessment surveys to provide additional information on <strong>the</strong> reproduction <strong>of</strong> <strong>the</strong> fish. The 17 m long Fisheries<br />
Department research vessel, Ndunduma powered with a 380 hp engine which pulls a Gulloppur bottom trawl net<br />
with a 23 m headrope and a 38 mm mesh cod end was used. The effective mesh size in <strong>the</strong> cod end was 4 mm due to<br />
<strong>the</strong> net liner used to ensure that escape through <strong>the</strong> meshes was minimal.<br />
Eight stock assessment surveys were done and during each survey a total <strong>of</strong> 97 fixed trawl stations (54 in <strong>the</strong> SEA<br />
and 43 in SWA) were sampled. The stations were stratified into shallow 0-50 m, deep 50-100 m and very deep 100-<br />
150 m. Each trawl lasted for 30 minutes. Twelve additional surveys were done in between <strong>the</strong> quarterly surveys and<br />
29 stations were sampled in each survey in <strong>the</strong> same depth ranges. The duration <strong>of</strong> each pull varied between 30-120<br />
minutes in order to obtain a large sample. All trawling was done during <strong>the</strong> day at depths between 10 and 150m<br />
depth. It was not possible to sample in water less than 10 m deep because <strong>of</strong> restrictions imposed by <strong>the</strong> draught <strong>of</strong><br />
<strong>the</strong> vessel.
201<br />
Lake Malawi Fisheries Management Symposium - Proceedings<br />
B. meridionalis were sorted out from <strong>the</strong> main catch which was always composed <strong>of</strong> many small cichlids and some<br />
larger fish. Each <strong>of</strong> <strong>the</strong>m was measured on board <strong>the</strong> vessel to <strong>the</strong> nearest 0.5 cm (total length) and most fish were<br />
weighed to <strong>the</strong> nearest 0.01 kg and those that were not weighed individually were collectively weighed as a species<br />
group to <strong>the</strong> nearest 0.1 kg.<br />
Figure 1. Map <strong>of</strong> sou<strong>the</strong>rn <strong>of</strong> Lake Malawi showing <strong>the</strong> sampling stations used in <strong>the</strong> monitoring<br />
surveys.<br />
Sex was determined after dissection and, in some cases <strong>the</strong> gonads were removed and weighed to <strong>the</strong> nearest 0.1g.<br />
The state <strong>of</strong> sexual maturity was assessed by <strong>the</strong> Nikolsky (1963) method, based on <strong>the</strong> external appearance <strong>of</strong> <strong>the</strong><br />
gonads. The average length at first maturity was estimated by using <strong>the</strong> logistic equation:<br />
p= 1/(1 + e -r(L-Lm) )<br />
where p = <strong>the</strong> proportion <strong>of</strong> fish with ripe gonads, r = <strong>the</strong> slope <strong>of</strong> <strong>the</strong> curve, L = <strong>the</strong> length <strong>of</strong> fish and Lm = <strong>the</strong><br />
mean length at 50% maturity.<br />
The catch per unit effort (C/f) assumed as index <strong>of</strong> abundance was expressed as:<br />
Results<br />
-14.4 -14.2 -14.0 -13.8<br />
Latitude<br />
34.60 34.75 34.90<br />
Longitude<br />
35.05 35.20<br />
C/f = catch (kg) /swept area (ha).<br />
Distribution and relative abundance<br />
The distribution and abundance <strong>of</strong> <strong>the</strong> total number <strong>of</strong> individuals caught during <strong>the</strong> stock assessment surveys are<br />
shown in Figure 2. B. meridionalis was widespread, being found at each station, in both arms. The mean biomass <strong>of</strong><br />
B. meridionalis from <strong>the</strong> SEA and SWA were 4.8 and 4.0 kg ha -1 respectively and <strong>the</strong> mean biomass from <strong>the</strong> former<br />
was significantly different (t-test, p < 0.05) from <strong>the</strong> latter. The mean biomass decreased with increasing depth and<br />
it was not significantly different in <strong>the</strong> 0-50 and 51-100 m depth strata, but <strong>the</strong> average biomass in <strong>the</strong> > 100 m<br />
depth strata was significantly (t-test, p < 0.05) lower in both arms (Table 1). There was no significant difference<br />
between biomass values in different surveys (t-test, p < 0.05) (Table 2).<br />
Size structure<br />
The length-frequency distributions <strong>of</strong> <strong>the</strong> Bagrus in different depth strata in both SEA and SWA were generally<br />
unimodal with few at fish < 5.0 cm (Figures 3-6). This absence was not attributed to net selectivity because <strong>the</strong> cod<br />
end was covered with a liner, which retained small cichlids <strong>of</strong> about 1.0 cm. B. meridionalis ranged from 4.5 cm to<br />
105 cm TL with single modes which varied with depth. The smaller size- classes generally dominated and showed<br />
asymmetrical distribution, particularly in waters deeper than 50m. In contrast, bimodal distribution patterns were<br />
noticeable in 0-20 m depth range, especially in <strong>the</strong> SEA indicating <strong>the</strong> presence <strong>of</strong> two distinct sizes <strong>of</strong> fish, small<br />
and large (Figures 7-10). The mean length decreased with increasing depth and many large individuals were caught<br />
SEA
202<br />
Lake Malawi Fisheries Management Symposium - Proceedings<br />
in shallower water (< 20 m) in both arms (Figures 3-6). Females were significantly larger (t-test, p < 0.05) than<br />
males in both arms and also fish (both sexes) caught in <strong>the</strong> SEA were generally larger than those from <strong>the</strong> SWA<br />
(Table 3).<br />
Sex ratios<br />
The sex ratio, based on all Kampango sampled, did not deviate from 1:1 ratio (Table 4). Similarly, <strong>the</strong> sexes were<br />
equally represented in all depth strata except in shallow water <strong>of</strong> <strong>the</strong> SWA in which <strong>the</strong>re were significantly more<br />
males (χ 2 –test, p < 0.05) than females. Sex ratios grouped into 5-cm length classes varied within <strong>the</strong> length intervals<br />
and in some cases <strong>the</strong>re were significant departures (χ 2 –test, p < 0.05) from <strong>the</strong> 1:1 ratio (Table 5). Males<br />
predominated in all <strong>the</strong> small size intervals and female in <strong>the</strong> large size intervals.<br />
Table 1. The mean biomass (kg ha -1 ) and density (number per unit area) with standard error (s.e.) <strong>of</strong><br />
Bagrus meridionalis in <strong>the</strong> sou<strong>the</strong>rn part <strong>of</strong> Lake Malawi, June 1994 – March 1996.<br />
Area Depth (m) Biomass Density<br />
Mean s.e. Mean s.e.<br />
SEA 0-50 4.90 (1.47) 5 (2.03)<br />
50-100 5.40 (1.50) 11 (2.74)<br />
>100 2.20 (1.63) 5 (5.24)<br />
0-150 4.80 (0.98) 8 (1.77)<br />
SWA 0-50 5.20 (1.84) 8 (4.13)<br />
50-100 4.40 (1.34) 16 (4.82)<br />
>100 1.20 (0.72) 5 (3.70)<br />
0-150 4.00 (1.01) 11 (2.96)<br />
Table 2. The mean biomass (kg ha -1 ) with standard error (in brackets) <strong>of</strong> Bagrus meridionalis in <strong>the</strong><br />
sou<strong>the</strong>rn part <strong>of</strong> Lake Malawi during <strong>the</strong> quarterly surveys, June 1994 – March 1996.<br />
SEA SWA<br />
Surveys Biomass s.e. Biomass s.e.<br />
1 22.1 (2.16) 15.5 (2.33)<br />
2 26.9 (2.90) 21.1 (3.00)<br />
3 21.2 (2.56) 25.3 (3.93)<br />
4 25.1 (2.70) 24.2 (2.87)<br />
5 31.6 (3.53) 19.1 (2.51)<br />
6 23.3 (2.36) 25.1 (2.92)<br />
7 22.2 (2.43) 15.6 (2.14)<br />
8 20.4 (3.09) 17.6 (2.73)
-30.8 -30.6 -30.4 -30.2 -30.0<br />
Latitude<br />
14.6 14.8 15.0<br />
Latitude<br />
Bagrus meridionalis<br />
CPUE (Kg/hr)<br />
54<br />
0<br />
21.9 22.0 22.1 22.2 22.3 22.4<br />
Longitude<br />
Bagrus meridionalis<br />
34.2 34.4 34.6<br />
Longitude<br />
34.8 35.0<br />
203<br />
Lake Malawi Fisheries Management Symposium - Proceedings<br />
CPUE (Kg/hr)<br />
Figure 2. The distribution <strong>of</strong> Bagrus meridionalis caught by trawling during monitoring surveys in <strong>the</strong><br />
south east arm (above)and south west arm (below) <strong>of</strong> Lake Malawi.<br />
Table 3. The mean length (cm TL) with standard error <strong>of</strong> Bagrus meridionalis in <strong>the</strong> sou<strong>the</strong>rn part <strong>of</strong> Lake<br />
Malawi during <strong>the</strong> quarterly surveys, June 1994 – March 1996.<br />
Area Sex Mean s.e Total<br />
SEA Male 34.2 0.13 7582<br />
Female 38.4 0.18 7708<br />
both sexes 36.4 0.11 15290<br />
SWA Male 30.0 0.11 9002<br />
Female 31.3 0.15 8753<br />
both sexes 30.5 0.09 17753<br />
148<br />
0
204<br />
Lake Malawi Fisheries Management Symposium - Proceedings<br />
Table 4. The ratio <strong>of</strong> males to females in relation to area <strong>of</strong> Bagrus in <strong>the</strong> sou<strong>the</strong>rn part <strong>of</strong> Lake Malawi. *<br />
denote values that are significantly different (χ 2 –test, p < 0.05) from a 1:1 ratio. N = number <strong>of</strong> fish<br />
examined.<br />
Area Depth (m) Ratio<br />
SEA & SWA 0-150 1.0<br />
SEA 0-50 1.0<br />
Table 5. The ratio <strong>of</strong> males to females in relation to size (20 cm size classes) <strong>of</strong> Bagrus in <strong>the</strong> sou<strong>the</strong>rn<br />
part <strong>of</strong> Lake Malawi. Asterisks denote values that are significantly different (χ 2 –test, p < 0.05) from a 1:1<br />
ratio. N = number <strong>of</strong> fish examined.<br />
Depth (m)<br />
SEA SWA<br />
Length class (m) 0-50 51-100 >100 0-50 51-100 >100<br />
0-20 1.1 1.1 1.0 1.5* 0.9 1.0<br />
21-40 1.2* 1.1* 1.0 1.1* 1.0* 0.9<br />
41-60 1.3* 0.9* 0.7 1.5* 0.8* 0.4<br />
61-80 0.1* 0.1* 0.5 0.2* 0.1* 0.4<br />
81-100 0.1*<br />
Length-weight relationships<br />
The length-weight relationships <strong>of</strong> Bagrus indicated that <strong>the</strong> growth is isometric i.e. <strong>the</strong> body length <strong>of</strong> an individual<br />
fish grows in proportion to <strong>the</strong> cubic root <strong>of</strong> its body weight. The relationship between log total length and log<br />
weight is:<br />
Log10W = – 5.13 + 3.04*Log10L.<br />
51-100 1.0<br />
>100 1.0<br />
SWA 0-50 1.1*<br />
51-100 1.0<br />
>100 0.9<br />
Reproductive patterns<br />
The breeding periodicity <strong>of</strong> Kampango is shown in Figure 11. Ripe individuals were found throughout <strong>the</strong> year<br />
indicating that continuous breeding occurs, although <strong>the</strong>re was a considerable seasonal variation in <strong>the</strong> proportion <strong>of</strong><br />
adult fish with ripe gonads. The breeding peak, which was between November and December, coincided with <strong>the</strong><br />
rainy season. Breeding individuals were recorded at all depths, but <strong>the</strong> species appear to prefer shallow water (< 50<br />
m) (Table 6). Bagrus meridionalis reached sexual maturity at 52 cm TL in females and 43.8 cm TL in males in <strong>the</strong><br />
sou<strong>the</strong>rn part <strong>of</strong> Lake Malawi and <strong>the</strong> difference between sexes were significant (χ 2 -test, p < 0.05) (Figure 12).<br />
Table 6. The percentage <strong>of</strong> ripe Bagrus in relation to depth in Lake Malawi. N = number <strong>of</strong> fish examined.<br />
Area N 0-50 51-100 >100 m<br />
SEA 3403 77.4 22.3 0.3<br />
SWA 2292 78.1 21.6 0.3
Percent<br />
20.0<br />
18.0<br />
16.0<br />
14.0<br />
12.0<br />
10.0<br />
8.0<br />
Percent (a) Shallow water (0-50 m)<br />
6.0<br />
4.0<br />
2.0<br />
0.0<br />
10 20 30 40 50 60 70 80 90 100<br />
Total length (cm)<br />
(b) Deep water (51-100 m)<br />
25.0<br />
20.0<br />
15.0<br />
10.0<br />
5.0<br />
0.0<br />
40.0<br />
35.0<br />
30.0<br />
25.0<br />
20.0<br />
15.0<br />
10.0<br />
5.0<br />
0.0<br />
205<br />
Lake Malawi Fisheries Management Symposium - Proceedings<br />
N = 2131<br />
x = 39.9 cm<br />
s.e. = 0.25<br />
N = 4535<br />
x = 33.0 cm<br />
s.e. = 0.14<br />
10 20 30 40 50 60 70 80 90 100<br />
Total length (cm)<br />
Percent (c) Very deep water (> 100 m)<br />
N = 916<br />
x = 27.0 cm<br />
s.e. = 0.31<br />
10 20 30 40 50 60 70 80 90 100<br />
Total length (cm)<br />
Figure 3. The length-frequency distribution <strong>of</strong> male Bagrus meridionalis in <strong>the</strong> south east arm <strong>of</strong> Lake<br />
Malawi collected between June 1994 and March 1996. All mean length numbers (x) are significantly<br />
different (t-test, p < 0.05).
Percent<br />
Percent<br />
(a) Shallow water (0-50 m)<br />
12.0<br />
10.0<br />
8.0<br />
6.0<br />
4.0<br />
2.0<br />
0.0<br />
10 20 30 40 50 60 70 80 90 100<br />
Total length (cm)<br />
(b) Deep water (51-100 m)<br />
18.0<br />
16.0<br />
14.0<br />
12.0<br />
10.0<br />
8.0<br />
6.0<br />
4.0<br />
2.0<br />
0.0<br />
35.0<br />
30.0<br />
25.0<br />
20.0<br />
15.0<br />
10.0<br />
5.0<br />
0.0<br />
206<br />
Lake Malawi Fisheries Management Symposium - Proceedings<br />
N = 2147<br />
x = 46.5 cm<br />
s.e. = 0.38<br />
N = 4572<br />
x = 36.7 cm<br />
s.e. = 0.20<br />
10 20 30 40 50 60 70 80 90 100<br />
Total length (cm)<br />
Percent (c) Very deep water (> 100 m)<br />
N = 989<br />
x = 28.5 cm<br />
s.e. = 0.34<br />
10 20 30 40 50 60 70 80 90 100<br />
Total length (cm)<br />
Figure 4. The length-frequency distribution <strong>of</strong> female Bagrus meridionalis in <strong>the</strong> south east arm <strong>of</strong> Lake<br />
Malawi collected between June 1994 and March 1996. All mean length numbers (x) are significantly<br />
different (t-test, p < 0.05).
Percent<br />
20.0<br />
18.0<br />
16.0<br />
14.0<br />
12.0<br />
10.0<br />
8.0<br />
Percent (a) Shallow water (0-50 m)<br />
6.0<br />
4.0<br />
2.0<br />
0.0<br />
10 20 30 40 50 60 70 80 90 100<br />
Total length (cm)<br />
(b) Deep water (51-100 m)<br />
25.0<br />
20.0<br />
15.0<br />
10.0<br />
5.0<br />
0.0<br />
40.0<br />
35.0<br />
30.0<br />
25.0<br />
20.0<br />
15.0<br />
10.0<br />
5.0<br />
0.0<br />
207<br />
Lake Malawi Fisheries Management Symposium - Proceedings<br />
N = 3046<br />
x = 35.2 cm<br />
s.e. = 0.21<br />
N = 5229<br />
x = 27.6 cm<br />
s.e. = 0.12<br />
10 20 30 40 50 60 70 80 90 100<br />
Total length (cm)<br />
Percent (c) Very deep water (> 100 m)<br />
N = 725<br />
x = 26.0 cm<br />
s.e. = 0.34<br />
10 20 30 40 50 60 70 80 90 100<br />
Total length (cm)<br />
Figure 5. The length-frequency distribution <strong>of</strong> male Bagrus meridionalis in <strong>the</strong> south west arm <strong>of</strong> Lake<br />
Malawi collected between June 1994 and March 1996. All mean length numbers (x) are significantly<br />
different (t-test, p < 0.05).
Percent<br />
Percent<br />
(a) Shallow water (0-50 m)<br />
20.0<br />
18.0<br />
16.0<br />
14.0<br />
12.0<br />
10.0<br />
8.0<br />
6.0<br />
4.0<br />
2.0<br />
0.0<br />
10 20 30 40 50 60 70 80 90 100<br />
Total length (cm)<br />
(b) Deep water (51-100 m)<br />
35.0<br />
30.0<br />
25.0<br />
20.0<br />
15.0<br />
10.0<br />
5.0<br />
0.0<br />
35.0<br />
30.0<br />
25.0<br />
20.0<br />
15.0<br />
10.0<br />
5.0<br />
0.0<br />
208<br />
Lake Malawi Fisheries Management Symposium - Proceedings<br />
N = 2630<br />
x = 37.9 cm<br />
s.e. = 0.31<br />
N = 5350<br />
x = 28.6 cm<br />
s.e. = 0.16<br />
10 20 30 40 50 60 70 80 90 100<br />
Total length (cm)<br />
Percent (c) Very deep water (> 100 m)<br />
N = 773<br />
x = 27.1 cm<br />
s.e. = 0.41<br />
10 20 30 40 50 60 70 80 90 100<br />
Total length (cm)<br />
Figure 6. The length-frequency distribution <strong>of</strong> female Bagrus meridionalis in <strong>the</strong> south west arm <strong>of</strong> Lake<br />
Malawi collected between June 1994 and March 1996. All mean length numbers (x) are significantly<br />
different (t-test, p < 0.05).
Percent<br />
Percent<br />
(a) Shallow water (0-20 m)<br />
35.0<br />
30.0<br />
25.0<br />
20.0<br />
15.0<br />
10.0<br />
5.0<br />
0.0<br />
10 20 30 40 50 60 70 80 90 100<br />
Total length (cm)<br />
209<br />
Lake Malawi Fisheries Management Symposium - Proceedings<br />
N = 368<br />
x = 42.4 cm<br />
s.e. = 0.76<br />
(b) Deep water (21-50 m)<br />
20.0<br />
18.0<br />
N = 1763<br />
16.0<br />
x = 39.4 cm<br />
14.0<br />
12.0<br />
10.0<br />
8.0<br />
6.0<br />
4.0<br />
2.0<br />
0.0<br />
s.e. = 0.26<br />
10 20 30 40 50 60 70 80 90 100<br />
Total length (cm)<br />
Figure 7. The length-frequency distribution <strong>of</strong> male Bagrus meridionalis in <strong>the</strong> south east arm <strong>of</strong> Lake<br />
Malawi collected between June 1994 and March 1996. All mean length numbers (x) are significantly<br />
different (t-test, p < 0.05).<br />
Percent<br />
Percent<br />
(a) Shallow water (0-20 m)<br />
16.0<br />
14.0<br />
12.0<br />
10.0<br />
8.0<br />
6.0<br />
4.0<br />
2.0<br />
0.0<br />
14.0<br />
12.0<br />
10.0<br />
8.0<br />
6.0<br />
4.0<br />
2.0<br />
0.0<br />
N = 359<br />
x = 53.6 cm<br />
s.e. = 1.09<br />
10 20 30 40 50 60 70 80 90 100<br />
Total length (cm)<br />
(b) Deep water (21-50 m)<br />
N = 1788<br />
x = 45.1 cm<br />
s.e. = 0.40<br />
10 20 30 40 50 60 70 80 90 100<br />
Total length (cm)<br />
Figure 8. The length-frequency distribution <strong>of</strong> female Bagrus meridionalis in <strong>the</strong> south east arm <strong>of</strong> Lake<br />
Malawi collected between June 1994 and March 1996. All mean length numbers (x) are significantly<br />
different (t-test, p < 0.05).
Percent<br />
Percent<br />
(a) Shallow water (0-20 m)<br />
25.0<br />
20.0<br />
15.0<br />
10.0<br />
5.0<br />
0.0<br />
10 20 30 40 50 60 70 80 90 100<br />
Total length (cm)<br />
(b) Deep water (21-50 m)<br />
25.0<br />
20.0<br />
15.0<br />
10.0<br />
5.0<br />
0.0<br />
210<br />
Lake Malawi Fisheries Management Symposium - Proceedings<br />
N = 576<br />
x = 38.9 cm<br />
s.e. = 0.55<br />
N = 2470<br />
x = 34.3 cm<br />
s.e. = 0.22<br />
10 20 30 40 50 60 70 80 90 100<br />
Total length (cm)<br />
Figure 9. The length-frequency distribution <strong>of</strong> male Bagrus meridionalis in <strong>the</strong> south west arm <strong>of</strong> Lake<br />
Malawi collected between June 1994 and March 1996. All mean length numbers (x) are significantly<br />
different (t-test, p < 0.05).<br />
Percent<br />
Percent<br />
(a) Shallow water (0-20 m)<br />
12.0<br />
10.0<br />
8.0<br />
6.0<br />
4.0<br />
2.0<br />
0.0<br />
14.0<br />
12.0<br />
10.0<br />
8.0<br />
6.0<br />
4.0<br />
2.0<br />
0.0<br />
N = 359<br />
x = 53.6 cm<br />
s.e. = 1.09<br />
10 20 30 40 50 60 70 80 90 100<br />
Total length (cm)<br />
(b) Deep water (21-50 m)<br />
N = 1788<br />
x = 45.1 cm<br />
s.e. = 0.40<br />
10 20 30 40 50 60 70 80 90 100<br />
Total length (cm)<br />
Figure 10. The length-frequency distribution <strong>of</strong> female Bagrus meridionalis in <strong>the</strong> south west arm <strong>of</strong> Lake<br />
Malawi collected between June 1994 and March 1996. All mean length numbers (x) are significantly<br />
different (t-test, p < 0.05).
% mature<br />
30.0<br />
25.0<br />
20.0<br />
15.0<br />
10.0<br />
5.0<br />
0.0<br />
J94 A94 O94 D94 F95 A95 J95 A95 O95 D95 F96 A96<br />
Months<br />
211<br />
Lake Malawi Fisheries Management Symposium - Proceedings<br />
% F %M<br />
Figure 11. Breeding periodicity <strong>of</strong> male and female Bagrus meridionalis in <strong>the</strong> sou<strong>the</strong>rn part <strong>of</strong> Lake<br />
Malawi. Samples were collected between June 1994 and April 1996.<br />
Proportion mature<br />
Proportion mature<br />
(a)<br />
0.80<br />
0.60<br />
0.40<br />
0.20<br />
0.00<br />
(b)<br />
0.80<br />
0.60<br />
0.40<br />
0.20<br />
0.00<br />
0 10 20 30 40<br />
Length (cm)<br />
50 60 70 80<br />
Observed Calculated<br />
0 20 40 60 80 100<br />
Length (cm)<br />
Observed Calculated<br />
Figure 12. The mean length at first maturity in (a) male and (b) female Bagrus meridionalis. (Lm = 43.8<br />
cm TL for males and 52.0 cm TL for females).
212<br />
Lake Malawi Fisheries Management Symposium - Proceedings<br />
Discussion<br />
Bagrus meridionalis were commonly caught in <strong>the</strong> bottom water trawl, which is consistent with previous studies<br />
(Turner 1982, Thompson et al. 1996). Depth is <strong>the</strong> most important factor determining its distribution. B.<br />
meridionalis were described as broadly eurytopic in <strong>the</strong>ir distribution patterns because <strong>the</strong>y have a wide<br />
geographical distribution and inhabit a variety <strong>of</strong> habitats (Figure 2). They can live in a wide range <strong>of</strong> conditions,<br />
<strong>of</strong>ten moving from one habitat to ano<strong>the</strong>r.<br />
The length-frequency distributions <strong>of</strong> B. meridionalis are ‘dome-shaped’, a phenomenon usually attributed to gearselectivity,<br />
in particular gillnets (Ricker 1975). In this case it is negated because <strong>the</strong> gear used in this study is almost<br />
non-selective (since <strong>the</strong> smallest specimen <strong>of</strong> Bagrus caught in this gear was about 4.5 cm TL). These distributions<br />
probably reflect <strong>the</strong> size gradation <strong>of</strong> Bagrus with depth in <strong>the</strong> <strong>lake</strong>. The absence <strong>of</strong> <strong>the</strong> smallest length classes <strong>of</strong><br />
Bagrus suggests that <strong>the</strong>y occur in water < 10 m deep or in areas where trawling was not possible. These small fish<br />
are being guarded in <strong>the</strong>ir nests, which are <strong>of</strong>ten situated adjacent to rocks (Jackson et al. 1963). The decrease in <strong>the</strong><br />
numbers <strong>of</strong> large fish in shallow waters may reflect high fishing pressure by <strong>the</strong> small-scale commercial <strong>fisheries</strong>.<br />
The bi-modal distribution Bagrus in < 0-20 m water depth range was attributed to gillnet fishery (Figures 7-10). The<br />
gillnet selectivity studies (Jackson et al. 1963, Tweddle 1975, Sipawe, 2001 in prep.) indicate that <strong>the</strong> gill-net<br />
selectivity peak is between 35-55 cm TL if all meshes are combined. Therefore, fish over 40 cm TL were less liable<br />
to be caught, and fish less than 35 cm TL more exposed to higher fishing mortality.<br />
There was size gradation with depth indicating that some zonation or restricted movement occurs (Figures 3-6). The<br />
presence <strong>of</strong> adults in shallow water (< 50 m) and juveniles in deeper water (> 50 m) may be a way <strong>of</strong> avoiding<br />
interspecific competition and cannibalism. The difference in mean length between fish caught in <strong>the</strong> SEA and SWA<br />
may be explained by <strong>the</strong> following: 1) <strong>the</strong> fish stocks <strong>of</strong> Kampango from <strong>the</strong> SEA is different from that <strong>of</strong> <strong>the</strong> SWA,<br />
and 2) <strong>the</strong>re is less competition <strong>of</strong> food resources in <strong>the</strong> SEA than SWA which perhaps promotes faster growth <strong>of</strong> B.<br />
meridionalis in <strong>the</strong> former. The numbers <strong>of</strong> fish per km 2 are 473 and 813 in <strong>the</strong> SEA and SWA, respectively. Fishing<br />
pressure is higher in <strong>the</strong> SEA than in <strong>the</strong> SWA if <strong>the</strong> number <strong>of</strong> fishing gear and fishermen are considered to be<br />
indicative <strong>of</strong> fishing mortality (Table 5). Similar fishing pressure could account for <strong>the</strong> reduced number <strong>of</strong> large fish<br />
in <strong>the</strong> 0-50 m depth stratum. The intensity <strong>of</strong> gillnet fishing pressure on <strong>the</strong> Kampango population structure is<br />
evident in Figures (7-10).<br />
B. meridionalis was most abundant in < 100 m water depth. The variation in abundance with depth reflected depth<br />
preferences and numbers. Size gradation indicates that <strong>the</strong>ir depth distribution was determined by depth preferences.<br />
The effect <strong>of</strong> numbers on estimates <strong>of</strong> abundance is clearly observed in this species where few large fish in <strong>the</strong> 0-50<br />
m depth range gave a similar estimate <strong>of</strong> biomass to that <strong>of</strong> many small fish in <strong>the</strong> 51-100 m depth range. The<br />
abundance <strong>of</strong> Bagrus throughout <strong>the</strong> study period was remarkably constant and <strong>the</strong>re was no evidence <strong>of</strong><br />
seasonality. This suggested that recruitment remained constant because its population structure was mainly<br />
composed <strong>of</strong> small individuals.<br />
The spatial distribution <strong>of</strong> <strong>the</strong> overall sexes was within <strong>the</strong> expected ratio. The sex ratio however, was different in<br />
shallow water (< 50 m) in <strong>the</strong> SWA and in <strong>the</strong> length classes and this discrepancy was mainly attributed to fishing<br />
pressure. Studies by Jackson et al., (1963) and Tweddle (1982) indicated that more females were caught in gillnets<br />
than males and <strong>the</strong> most vulnerable fish size was between 35-55 cm TL. This is confirmed by this study because<br />
61.3% (32.8% males, 28.5% females) <strong>of</strong> <strong>the</strong> 33052 fish examined were in <strong>the</strong> 35-55 cm TL range. The difference in<br />
sex ratio was also significant between 45-55 cm TL (Table 3). Females were fished more than <strong>the</strong> males probably<br />
because <strong>of</strong> <strong>the</strong>ir fast growth rate. The significant difference in sex ratios above 55 cm TL could be attributed to<br />
growth pattern. Males seemed not to grow as big as females.<br />
The main breeding period <strong>of</strong> Bagrus meridionalis occurred in <strong>the</strong> rainy season and <strong>the</strong> actual duration depends on<br />
<strong>the</strong> length <strong>of</strong> <strong>the</strong> rains, which is consistent with o<strong>the</strong>r studies (McKaye 1986: Jackson et al. 1963, Tweddle 1975,<br />
1982) and o<strong>the</strong>r bagrids (Dadzie and Ochieng-Okach 1989). The breeding peak coincided with <strong>the</strong> zooplankton<br />
production peak (Irvine 1995) that ensures that food is available for <strong>the</strong> young. Breeding occurred within <strong>the</strong> same<br />
depth range in which <strong>the</strong>y foraged (Table 6) which suggests that <strong>the</strong>re was no spawning migration (Banda, 2000).<br />
The inshore migration in spawning B. meridionalis (Jackson et al. 1963, Tweddle 1982) may reflect <strong>the</strong> need for<br />
breeding fish to find suiTable spawning sites.<br />
The length at first maturity differed in male and female B. meridionalis, with females maturing at a larger size,<br />
probably because <strong>of</strong> different growth rates between sexes. The results were similar to estimates by Eccles (1972),
213<br />
Lake Malawi Fisheries Management Symposium - Proceedings<br />
but not to those by Tweddle (1982) and Bernacsek et al., (1983). The difference in mean lengths could be explained<br />
by: 1) <strong>the</strong> difficulty in determining <strong>the</strong> gonadal stages, <strong>the</strong>reby erroneously including or excluding small fish in <strong>the</strong><br />
ripe category, 2) different stocks were studied and 3) <strong>the</strong> sample size was too small in <strong>the</strong> early studies as higher<br />
values were obtained by Eccles (1972) with a larger sample (1409) compared to Tweddle (1982) and Bernacsek et<br />
al. 1983 who examined about 200 and 170 specimens, respectively.<br />
Conclusion<br />
The present study indicates that fishing is having a major impact on <strong>the</strong> population structure <strong>of</strong> Bagrus. Different<br />
<strong>fisheries</strong> have different impact on <strong>the</strong> population. The selective cropping <strong>of</strong> certain length classes most <strong>of</strong> which are<br />
immature is carried out by small-scale commercial <strong>fisheries</strong> (gillnet fishery and longline fishery) in shallow water<br />
while unselective fishing is undertaken by trawlers in deep waters. The result is that both <strong>fisheries</strong> will invariably<br />
eliminate large fish species including B. meridionalis.<br />
B. meridionalis has maintained a substantial relative stable population especially in <strong>the</strong> sou<strong>the</strong>rn part <strong>of</strong> <strong>the</strong> <strong>lake</strong><br />
where both <strong>fisheries</strong> operate because <strong>the</strong> <strong>fisheries</strong> have been limited to coastal areas and <strong>the</strong> decline in large fish has<br />
always been compensated by improved recruitment and <strong>the</strong> fact that <strong>the</strong> nursery areas are in <strong>the</strong> less exploited deep<br />
water. The contention that <strong>the</strong> decline in <strong>the</strong> catches <strong>of</strong> B. meridionalis was caused by high fishing pressure on <strong>the</strong><br />
immature fish (FAO 1976, Fryer 1984, Alimoso 1989, Alimoso, et al. 1989) is not substantiated by <strong>the</strong>se studies<br />
because <strong>of</strong> <strong>the</strong>ir life history. Therefore, this decline may reflect <strong>the</strong> absence <strong>of</strong> certain length classes <strong>of</strong> fish as <strong>the</strong><br />
small-scale commercial <strong>fisheries</strong> are selective in nature. This raises a question as to whe<strong>the</strong>r <strong>the</strong> noted general<br />
decline in <strong>the</strong> catch is indicative <strong>of</strong> overfishing or gear selectivity. However, <strong>the</strong> population <strong>of</strong> Bagrus will definitely<br />
decline with <strong>the</strong> expansion <strong>of</strong> <strong>the</strong> expansion <strong>of</strong> <strong>the</strong> deep-water fishery and may lead to a collapse because both adults<br />
and juveniles will be vulnerable to exploitation.<br />
This size structure <strong>of</strong> Bagrus from <strong>the</strong> two arms indicates that <strong>the</strong> populations seem to be different which<br />
necessitates <strong>the</strong> establishment as to whe<strong>the</strong>r <strong>the</strong>se populations are indeed distinct fish stocks. Future research<br />
priorities should focus on mapping <strong>the</strong> populations and distinguishing <strong>the</strong>m for <strong>management</strong> purposes. These studies<br />
should be accompanied by studies on <strong>the</strong> biology and population dynamics <strong>of</strong> <strong>the</strong> most important commercial fish<br />
species.<br />
Acknowledgements<br />
This work forms part <strong>of</strong> my PhD studies, which was funded by Icelandic Development Agency.<br />
References<br />
Alimoso, S.B., 1989. Management <strong>of</strong> catfish (Bagrus meridionalis Gün<strong>the</strong>r) in sou<strong>the</strong>rn Lake Malawi. Fishbyte, 7(2):10-12.<br />
Alimoso, S.B., Magasa, J.H. and van Zalinge, N.P. 1989. Exploitation and Management <strong>of</strong> fish resources in Lake Malawi. In:<br />
Fisheries <strong>of</strong> <strong>the</strong> African Great Lakes. Wageningen, Ne<strong>the</strong>rlands, Occassional Paper No. 3, 83-95.<br />
Banda, M.C. 2000. The biology and ecology <strong>of</strong> <strong>the</strong> catfishes <strong>of</strong> <strong>the</strong> Genera bathyclarias and Bagrus in Lake Malawi.<br />
Unpublished PhD. Thesis. University <strong>of</strong> Zimbabwe.<br />
Bernacsek, G.M., Massingo, A. and Contreras, A. 1983. Exploratory gillnetting in Lake Niassa, Moszambique, with biological<br />
pr<strong>of</strong>iles <strong>of</strong> <strong>the</strong> main taxa caught. FAO/GCP/MOZ/oo6/SWE (phase II). Field Document, 5, 129 pp.<br />
Dadzie, S. and Ochieng-Okach, J.L. 1989. The reproductive biology <strong>of</strong> a suluriod catfish, Bagrus docmak<br />
(Forsskål)(Cypriniformes, Bagridae) in <strong>the</strong> Winam Gulf <strong>of</strong> Lake Victoria. Revue Zoology <strong>of</strong> Africa, 103, 143-154.<br />
Eccles, D.H. 1972. Bagrus meridionalis (Kampango). Department <strong>of</strong> Agriculture and Fisheires Annual Report 1964-65, Part<br />
II:6-13.<br />
FAO, 1976. Promotion <strong>of</strong> intergrated fishery development, Malawi. Analysis <strong>of</strong> <strong>the</strong> various <strong>fisheries</strong> <strong>of</strong> Lake Malawi. FAO,<br />
FI:DP/MLW/77/516. Technical report 1.<br />
Fryer, G. 1984. The conservation and rational exploitation <strong>of</strong> <strong>the</strong> biota <strong>of</strong> Africa’s Great Lakes. In: Conservation <strong>of</strong> Threatened<br />
natural Habitats. Hall A.V. (Ed). South African Natural Science Programmes Report (92), CSIR, Pretoria, pp. 135-146.<br />
Irvine, K. 1995. Standing biomasses, production, spatial and temporal distributions <strong>of</strong> <strong>the</strong> crustacean zooplankton. In: The<br />
Fishery Potential and Productivity <strong>of</strong> <strong>the</strong> pelagic Zone <strong>of</strong> Lake Malawi/Niassa. Menz, A. (Ed). Chatham, U.K: Natural<br />
Resources Institute, pp. 85-108.<br />
Jackson, P.B.N., Iles, T.D. Harding, D. and Fryer, G. 1963. Report on <strong>the</strong> survey <strong>of</strong> nor<strong>the</strong>rn Lake Nyassa, 1954-55. Joint<br />
Fisheries Research Organisation. Government Printers. Zomba, Malawi.<br />
LoVullo, T.J., Stauffer, J.R. and McKaye K.R. 1992. Diet and growth <strong>of</strong> brood <strong>of</strong> Bagrus meridionalis Gün<strong>the</strong>r (Siluriformes:<br />
Bagridae) in Lake Malawi, Africa. Copie, 4, 1084-1088.<br />
McKaye, K.R. 1985. Cichlid-catfish mutualistic defence <strong>of</strong> young in Lake Malawi, Africa. Oecologia, 66, 358-363.<br />
McKaye, K.R. 1986. Trophic egg and parental foraging for young by <strong>the</strong> catfish Bagrus meridionalis <strong>of</strong> Lake Malwi, Africa.<br />
Oecologia, 69(3), 358-363.
214<br />
Lake Malawi Fisheries Management Symposium - Proceedings<br />
McKaye, K.R. Mughogho, D.E. and LoVullo, T.J. 1992. Formation <strong>of</strong> <strong>the</strong> shellfish school. Environmental Biology <strong>of</strong> Fisheries,<br />
35, 312-218.<br />
Nikolsky, G.V. 1963. The ecology <strong>of</strong> fishes. New York: Academic Press.<br />
Ricker, W.E. 1975. Computation and interpretation <strong>of</strong> Biological Statistics <strong>of</strong> Fish Populations. Bulletin <strong>of</strong> <strong>the</strong> Fisheries Research<br />
Board <strong>of</strong> Canada, 191, 1-382.<br />
Roberts, K.S. 1990. Ageing <strong>the</strong> Lake Malawi catfish Bagrus meridionalis using otoliths. Unpublished MSc. Thesis. University <strong>of</strong><br />
Wales.<br />
Sipawe, R. 2001. Gear and species selectivity <strong>of</strong> <strong>the</strong> gillnet fishery in Lake Malawi. (Proceedings <strong>of</strong> this <strong>symposium</strong>)<br />
Thompson, A.B. Allison, E.H. and Ngatunga, B.P. 1996. Distribution and breeding biology <strong>of</strong> <strong>of</strong>fshore pelagic cyprinids and<br />
catfish in Lake Malawi/Niassa. Environmental Biology <strong>of</strong> Fishes, 47, 27-42.<br />
Turner, J.L. 1982. Analysis <strong>of</strong> purse seine and gillnet catch data <strong>of</strong>f Nkhata Bay, Lake Malawi, from March 1980 to April 1981.<br />
In: Biology Studies on <strong>the</strong> Pelagic Ecosystem <strong>of</strong> Lake Malawi, FI: DP/MLW/75/019, Technical Report 1, FAO, Rome,<br />
pp. 154-162.<br />
Tweddle, D.1975. Age and growth <strong>of</strong> <strong>the</strong> catfish Bagrus meridionalis Gün<strong>the</strong>r in <strong>the</strong> sou<strong>the</strong>rn Lake Malawi. Journal <strong>of</strong> Fish<br />
Biology, 7, 667-685.<br />
Tweddle, D. 1982. Fish breeding migrations in <strong>the</strong> North Rukuru area <strong>of</strong> Lake Malawi with a note on gillnet colour selectivity.<br />
Journal <strong>of</strong> Science and Technology (Malawi), 3(2), 67-74.
215<br />
Lake Malawi Fisheries Management Symposium - Proceedings<br />
Feeding habit and development <strong>of</strong> feeding-related morphological characters in<br />
Oreochromis shiranus (Boulenger, 1896) larvae and juveniles in Malawi<br />
Shinsuke Morioka and Daniel Sikawa<br />
Department <strong>of</strong> Aquaculture and Fisheries Science, Bunda College <strong>of</strong> Agriculture, University <strong>of</strong> Malawi, P.O. Box 30321, c/o JICA<br />
Malawi Office, Lilongwe, Malawi. TEL: 265-277-214, FAX: 265-771-125, E-mail: morioka@<strong>malawi</strong>.net<br />
Abstract<br />
Stomach content, gut length, morphology <strong>of</strong> pharyngeal teeth and gill rakers <strong>of</strong> Oreochromis shiranus larvae and juveniles were<br />
investigated in order to elucidate <strong>the</strong> timing <strong>of</strong> feeding habit conversion, and <strong>the</strong> relationships between feeding habit and <strong>the</strong><br />
feeding-related morphological characters. Stomach content showed that <strong>the</strong> feeding habit <strong>of</strong> fish drastically changed between 14-20<br />
mm TL from zooplanktovorous to herbivorous (phytoplanktovorous). Pharyngeal plate and teeth were already ossified in <strong>the</strong><br />
smallest fish <strong>of</strong> this study (9.95 mm TL) and teeth number increased as fish grew. Percentage length <strong>of</strong> gut ((gut length/TL) x 100<br />
%) became more than 100 % when TL reached 15-20 mm, falling mostly under <strong>the</strong> size with feeding habit conversion. Gill rakers in<br />
4 th gill arch started appearing at 14 mm TL when <strong>the</strong> feeding habit started converting. Consequently, <strong>the</strong> conversion <strong>of</strong> feeding habit<br />
in Oreochromis shiranus started when <strong>the</strong> percentage intestine length became over 100 % and gill rakers in 4 th gill started<br />
appearing, and pharyngeal teeth did not seem to relate directly with such feeding habit conversion.<br />
Key words: Oreochromis shiranus, feeding habit, morphological development, zooplanktovorous, phytoplanktovorous<br />
Introduction<br />
Lake Malawi provides <strong>the</strong> main fish protein resources to <strong>the</strong> Malawian public. However, <strong>the</strong> fish catch in Malawi<br />
has declined since <strong>the</strong> late 1980s from over 70,000 t in 1989 to 40,000 t in 1999 (Zidana, 2000), leading to <strong>the</strong><br />
decrease <strong>of</strong> fish consumption by <strong>the</strong> Malawian public. Therefore, <strong>the</strong> government <strong>of</strong> Malawi has attempted to<br />
promote <strong>the</strong> finfish aquaculture since late 1980s. However, <strong>the</strong>re have been no remarkable developments in<br />
aquaculture production in Malawi, although <strong>the</strong> number <strong>of</strong> small-scale aquacultural farmers and <strong>the</strong>ir production has<br />
recently increased (Sidira, 2001).<br />
It is well known that Oreochromis species are phytoplanktovorus (Appler, 1985) and that <strong>the</strong> protein requirement,<br />
for a relatively high growth rate, is low. Therefore, Oreochromis shiranus is considered to be <strong>the</strong> most<br />
recommendable species for aquaculture in Malawi, and <strong>the</strong> majority <strong>of</strong> <strong>the</strong> small-scale farmers (92.9 %) grow this<br />
species (Sikawa, 1999). However, <strong>the</strong> feeding performance <strong>of</strong> larvae and juveniles <strong>of</strong> Oreochromis shiranus in<br />
Malawi has been scarcely reported so far, although <strong>the</strong> feeding and growth <strong>of</strong> fish larvae and juveniles are<br />
indispensable aspects for fur<strong>the</strong>r development <strong>of</strong> seed production and nursing techniques in aquaculture.<br />
When considering <strong>the</strong> feeding performance <strong>of</strong> fish larvae and juveniles, <strong>the</strong> morphological development relevant to<br />
feeding habit and/or behavior, as well as <strong>the</strong> internal secretion, should be elucidated. In this study, <strong>the</strong>refore, <strong>the</strong><br />
stomach content and <strong>the</strong> feeding-related morphological characters, such as gut length, gill rakers, pharyngeal teeth<br />
and stomach content <strong>of</strong> Oreochromis shiranus larvae and juveniles were investigated and <strong>the</strong> relation between <strong>the</strong><br />
morphological development and feeding habit was discussed.<br />
Materials and methods<br />
This study was conducted using larvae and juveniles <strong>of</strong> Oreochrommis shiranus collected from <strong>the</strong> experimental<br />
ear<strong>the</strong>n pond (15 x 50 m/m, 60 cm depth) <strong>of</strong> Bunda College <strong>of</strong> Agriculture, University <strong>of</strong> Malawi, during 24 May ~<br />
15 June 2000. Water temperature during this period was 17.5 ~ 21.0 o C. In this pond, 333 males and 667 females<br />
were stocked in September 1999. The fish mostly relied on natural food (plankton) although 20 kg <strong>of</strong> maize bran<br />
was given as supplemental diet to <strong>the</strong> fish once a week.<br />
Fifty larvae and juveniles were used in this study. The size (total length) rage <strong>of</strong> fish was 9.95 ~ 50.30 mm. Fish<br />
were preserved in 5-10 % formalin immediately after collection. Twenty specimens were treated as <strong>the</strong> double<br />
stained transparent specimen, following <strong>the</strong> method described by Kawamura and Hosoya (1991). These specimens<br />
were used for determination <strong>of</strong> <strong>the</strong> number <strong>of</strong> pharyngeal teeth on <strong>the</strong> posterior edge <strong>of</strong> lower pharyngeal plate and<br />
<strong>the</strong> ossified gill rakers <strong>of</strong> 4 th gill arch. O<strong>the</strong>r specimens were used to observe <strong>the</strong> stomach contents and intestine<br />
length (mm). The percentage length <strong>of</strong> intestine (PLI) was <strong>the</strong>n calculated (PLI = [intestine length / total length] x<br />
100 %). The percentage <strong>of</strong> zooplankton mass and algal mass in stomach in each fish was obtained on <strong>the</strong> basis <strong>of</strong> <strong>the</strong><br />
acreage <strong>of</strong> each organism in <strong>the</strong> microscopic image. The identification <strong>of</strong> zooplankton and phytoplankton in<br />
stomachs were attempted to higher than family level.
Results<br />
216<br />
Lake Malawi Fisheries Management Symposium - Proceedings<br />
Development <strong>of</strong> pharyngeal teeth and gill rakers<br />
Both lower and upper pharyngeal plates were already ossified in <strong>the</strong> smallest fish used in this study (9.95 mm TL).<br />
The number <strong>of</strong> pharyngeal teeth on <strong>the</strong> most posterior portion <strong>of</strong> lower pharyngeal plate increased as fish grew from<br />
8 at 9.95 mm TL to 36 at 43.65 mm TL (Figure 1). The relationship between TL and <strong>the</strong> number <strong>of</strong> pharyngeal teeth<br />
was expressed by <strong>the</strong> following two regressions intersecting at (19.91, 22.66); P = 1.29·L – 3.02 (91 = 0.95, n=9)<br />
and P = 0.50·L + 12.71 (r = 0.86, n = 11) where P is <strong>the</strong> number <strong>of</strong> teeth <strong>of</strong> lower pharyngeal plate and L is total<br />
length. The width <strong>of</strong> lower pharyngeal plate linearly increased as fish grew (Figure 2). The relationship between TL<br />
and <strong>the</strong> width <strong>of</strong> <strong>the</strong> lower pharyngeal plate was expressed by W = 0.097·L - 0.059 (r = 0.99, n = 20), where W is<br />
width <strong>of</strong> lower pharyngeal plate and L is total length. Algal cells attached on <strong>the</strong> surface <strong>of</strong> pharyngeal plate with<br />
mucus were frequently observed in fish larger than 20 mm TL.<br />
Gill rakers in <strong>the</strong> 4 th gill arch did not appear in fish smaller than 14.00 mm TL although <strong>the</strong> 4 th gill arch was already<br />
formed. Gill rakers in 4 th gill arch started appearing at 14.05 mm TL and increased in number as fish grew (Figure<br />
3). The relationship between TL and <strong>the</strong> number <strong>of</strong> gill rakers <strong>of</strong> <strong>the</strong> 4 th gill arch, after gill rakers appeared, was<br />
expressed by GR=1.52·L-14.46 (r=0.98, n=17) where GR is <strong>the</strong> number <strong>of</strong> gill rakers and L is total length.<br />
No. <strong>of</strong> phartngeal te<br />
40<br />
35<br />
30<br />
25<br />
20<br />
15<br />
10<br />
5<br />
0<br />
N = 1.29L - 3.02<br />
r = 0.91<br />
N = 0.50L + 12.71<br />
r = 0.86<br />
0 10 20 30 40 50 60<br />
Total length (mm)<br />
Figure 1. Relationship between total length and <strong>the</strong> number <strong>of</strong> pharyngeal teeth in O. shiranus larvae and<br />
juveniles.<br />
Width <strong>of</strong> lower pharygeal plate<br />
6<br />
5<br />
4<br />
3<br />
2<br />
1<br />
0<br />
W = 0.097L - 0.059<br />
r = 0.99<br />
0 10 20 30 40 50 60<br />
Total length (mm)<br />
Figure 2. Relationship between total length and <strong>the</strong> width <strong>of</strong> lower pharyngeal plate.
Number <strong>of</strong> gill rakers <strong>of</strong> 4th gil<br />
70<br />
60<br />
50<br />
40<br />
30<br />
20<br />
10<br />
0<br />
GR=1.52L-14.46<br />
r=0.98<br />
0 10 20 30 40 50 60<br />
Total length (mm)<br />
217<br />
Lake Malawi Fisheries Management Symposium - Proceedings<br />
Figure 3. Relationship between total length and <strong>the</strong> number <strong>of</strong> gill rakers <strong>of</strong> 4 th gill arch.<br />
Intestine length<br />
Gut length was measured in 30 specimens and <strong>the</strong> intestines were elongated from 8.00 to 215.00 mm in 12.75 ~<br />
41.30 mm TL <strong>of</strong> fish. Percent length <strong>of</strong> intestine (PIL = [intestine length / total length] x 100 %) smaller than 15.00<br />
mm TL was less than 100%. It increased as fish grew and reached more than 500% when TL was over 40 mm. The<br />
relationship between TL and PIL was expressed as PIL = 1.01·L 1.64 (r = 0.95, n=30), where PIL is percent intestine<br />
length and L is total length.<br />
Feeding habit<br />
Fish smaller than 14.00 mm TL mainly fed on zooplankton, such as Rotifers, Copepods, Brachiopods (Table 1).<br />
Feeding habit was changed drastically between 14.00 and 20.00 mm TL from zooplanktovorous to<br />
phytoplanktovorous including mono-cellular green algae, diatoms etc. (Table 1). Fibrous matter was occasionally<br />
observed in <strong>the</strong> stomach contents and seemed to originate from water-plants (Table 1). Fish larger than 20.00 mm<br />
TL dominantly fed on phytoplankton or algae even though zooplankton existed in water, as indicated by <strong>the</strong> stomach<br />
content <strong>of</strong> smaller fish that mainly fed on zooplankton.<br />
Table 1. Zooplankton and algae found in stomachs <strong>of</strong> Oreochromis shiranus larvae and juveniles.<br />
Fish size Main content in stomach<br />
< 15.00 mm TL<br />
>15.00 mm TL<br />
Rotifers<br />
Branchionidae, Euchlandae<br />
Copepods<br />
Diatomidae, Cyclopidae<br />
Branchiopods<br />
Daphnidae<br />
Diatoms<br />
Rhizosoleniaceae, Naviculaceae, Nitzschiaceae<br />
Green algae<br />
Characiaceae, Palmellaceae, Coelastraceae<br />
Zygnemataceae<br />
Blue-green algae<br />
Chroococcaceae<br />
Water plant (unidentified)
Percentage length <strong>of</strong> intes<br />
600<br />
500<br />
400<br />
300<br />
200<br />
100<br />
0<br />
IL = 1.01L 1.64<br />
r = 0.96<br />
0 5 10 15 20 25 30 35 40 45<br />
Total length (mm)<br />
218<br />
Lake Malawi Fisheries Management Symposium - Proceedings<br />
Figure 4. Relationship between total length and <strong>the</strong> percentage length <strong>of</strong> intestine.<br />
Percentage <strong>of</strong><br />
zooplankton/phytoplankton in st<br />
100<br />
90<br />
80<br />
70<br />
60<br />
50<br />
40<br />
30<br />
20<br />
10<br />
0<br />
0 5 10 15 20 25 30 35 40 45<br />
Total length (mm)<br />
Figure 5. Relationship between total length and <strong>the</strong> percentage contents <strong>of</strong> zooplankton/algae in<br />
stomach.<br />
Discussion<br />
Although Oreochromis species are known to be phytoplanktovorous or herbivorous (Appler, 1985, H<strong>of</strong>er, 1988), <strong>the</strong><br />
feeding performance at larval and early juvenile stages has scarcely been considered. In this study, <strong>the</strong> conversion <strong>of</strong><br />
feeding habit from zooplanktovorous to phytoplanktovorous or herbivorous was observed to take place between<br />
14.00 and 20.00 mm TL on <strong>the</strong> basis <strong>of</strong> stomach content analysis (Table 1). This observation elucidated that O.<br />
shiranus changed <strong>the</strong> feeing habit when TL reached more than 20 mm TL, although <strong>the</strong>y may be able to adapt to<br />
feed on zooplankton if phytoplankton is insufficient in quantity. When <strong>the</strong> conversion in feeding habit took place,<br />
<strong>the</strong> gill rakers <strong>of</strong> 4 th gill arch had just appeared (Figure 5) and percentage intestine length was over 100 % (Figure 4).<br />
In herbivorous and omnivorous fish, <strong>the</strong> function <strong>of</strong> <strong>the</strong> gill raker as a filter for phytoplanktonic organisms is well<br />
known. So, in O. shiranus, <strong>the</strong> development <strong>of</strong> gill rakers was also strongly related to herbivorous feeding habit<br />
development. Digestive ability <strong>of</strong> fish increases with <strong>the</strong> development <strong>of</strong> digestive organs and <strong>the</strong> enzyme<br />
production systems. Morioka (1993) reported that <strong>the</strong> increase in percent intestine length drastically increased after<br />
<strong>the</strong> transitional phase from larval to juvenile stages in a tropical omnivorous fish Chanos chanos. During <strong>the</strong><br />
transitional phase from larvae to juveniles, <strong>the</strong> digestive systems develop morphologically and physiologically and<br />
<strong>the</strong>y subsequently have <strong>the</strong> specific peculiarity in feeding habit (Tanaka, 1975). In O. shiranus, <strong>the</strong> transitional<br />
phase from larval to juvenile stages and <strong>the</strong> drastic changes in morphology and physiology are considered to take<br />
place at lengths <strong>of</strong> 15 – 20 mm TL.
219<br />
Lake Malawi Fisheries Management Symposium - Proceedings<br />
Although characters in pharyngeal teeth, i.e. <strong>the</strong> number <strong>of</strong> pharyngeal teeth (Figure 1) and <strong>the</strong> width <strong>of</strong> lower<br />
pharyngeal plate (Figure 2), may be related with <strong>the</strong> feeding habit conversion, <strong>the</strong> function <strong>of</strong> pharyngeal teeth for<br />
feeding could not be identified in this study. The decline <strong>of</strong> increasing rate <strong>of</strong> pharyngeal teeth after 20 mm TL<br />
(Figure 1) may demonstrate that <strong>the</strong> pharyngeal teeth are more functional for feeding on zooplankton and less<br />
functional when fish becomes herbivorous or phytoplanktovorous. In addition, <strong>the</strong> algae adhering to <strong>the</strong> surface <strong>of</strong><br />
<strong>the</strong> pharyngeal plate by mucus was <strong>of</strong>ten observed in this study as well as in Tilapia rendalii (K. Utsugi, pers.<br />
comm.). This suggests that <strong>the</strong> pharyngeal teeth (plate) may function to transport phytoplankton to <strong>the</strong> digestive tract<br />
after <strong>the</strong> filtering <strong>of</strong> planktonic organisms by <strong>the</strong> gill rakers.<br />
In this study, <strong>the</strong> larvae and juveniles were sampled in May and June, this period was <strong>the</strong> dry season and water<br />
temperature was relatively low as 17~21ºC. This indicates, as additional information, that O. shiranus breeds almost<br />
throughout <strong>the</strong> year even though <strong>the</strong> lowest water temperature were less than 20ºC. This is in contrast to Yata and<br />
Miyashita (1988) report that O. niloticus did not breed under less than 23ºC.<br />
Consequently, <strong>the</strong> stage at <strong>the</strong> occurrence <strong>of</strong> feeding habit conversion and <strong>the</strong> development <strong>of</strong> several characters<br />
relevant to feeding <strong>of</strong> O. shiranus larvae and juveniles were elucidated in this study. We believe that this<br />
information is useful not only for <strong>the</strong> technical development in aquaculture but <strong>the</strong> resource <strong>management</strong> fields for<br />
fur<strong>the</strong>r understanding <strong>the</strong> performance <strong>of</strong> <strong>the</strong> species in <strong>the</strong> wild. Since <strong>the</strong> decline in resource level has been<br />
recently pointed out especially in <strong>the</strong> <strong>lake</strong> chambo (O. karongae etc.) (Zidana, 2000). Researches on <strong>the</strong> early life<br />
history <strong>of</strong> fish are indispensable when considering <strong>the</strong> resource <strong>management</strong> aspects, and <strong>the</strong> surveys on feeding<br />
biology <strong>of</strong> fish larvae and juveniles have important roles for providing <strong>the</strong> information relevant to fish survival at<br />
early developmental phases which influences recruitment success. Taking <strong>the</strong> recent decline in <strong>the</strong> fish resource<br />
level into account, <strong>the</strong> research on <strong>the</strong> early biology <strong>of</strong> fish should be more emphasized in order to obtain more<br />
information for understanding <strong>the</strong> early life history <strong>of</strong> fish.<br />
Acknowledgements<br />
We express our great thanks to DR. J.S. Likongwe, Department <strong>of</strong> Aquaculture and Fisheries Science, Bunda<br />
College <strong>of</strong> Agriculture, University <strong>of</strong> Malawi, for his advisory comment. We also thank Mr. O. Matambo and<br />
technical staff <strong>of</strong> <strong>the</strong> department for sample collection. Lastly, We are grateful to Japan International Cooperation<br />
Agency (JICA) to give us <strong>the</strong> opportunity to conduct this research.<br />
References<br />
Appler, H.N. 1985. Evaluation <strong>of</strong> Hydrodictyon reticulatum as protein source in feed for Oreochromis (Tilapia) niloticus and<br />
Tilapia zillii. J. Fish. Biol., 27: 327-334.<br />
Brooks A.C and Maluwa A.O., 1997, Technical Supplement, Fish Farming in Malawi, A case study <strong>of</strong> <strong>the</strong> Central and Nor<strong>the</strong>rn<br />
Regions Fish Farming Project, Malawi Government, Ministry <strong>of</strong> Natural Resources. Malawi.<br />
H<strong>of</strong>er, R. 1988. Morphological adaptations <strong>of</strong> <strong>the</strong> digestive tract <strong>of</strong> tropical cyprinids and cichlids to diet. J. Fish. Biol., 33: 399-<br />
408.<br />
Kawamura, K. and K. Hosoya (1991) A modified double staining technique for making a transparent fish-skeletal specimen.<br />
Bull. Natl. Res. Inst. Aquaculture, 20: 11-18.<br />
Morioka, S. 1993. Ecology <strong>of</strong> milkfish Chanos chanos larvae in <strong>the</strong> surf zone. Doctoral dessertation, Tokyo University <strong>of</strong><br />
Fisheries. (in Japanese)<br />
Sidira, F.D. 2001. Annual report on <strong>the</strong> fish farming activities for <strong>the</strong> year 2000, Lilongwe, Mchinji, Kasungu and Dowa West.<br />
Department <strong>of</strong> Fisheries, Lilongwe.<br />
Sikawa D.C. 1999. On station and on farm investigation <strong>of</strong> optimal conditions for mass fingerling production <strong>of</strong> Tilapia,<br />
Oreochrmois shiranus (Boulenger 1896) in small scale hatchery systems in Malawi. Fish Farming Center, Mzuzu,<br />
Malawi.<br />
Tanaka, M. 1975. Digestive system <strong>of</strong> fish juveniles. Pages 7-23. In: Development and feeding <strong>of</strong> fish juveniles (eds.) T. Iwai<br />
and H. Tsukamoto, Koseisya Koseikaku, Tokyo.<br />
Zidana F.G. 2000, Malawi annual statistical bulletin. Ministry <strong>of</strong> Agriculture and Irrigation, Lilongwe. 56pp.<br />
Yata, T. and T. Miyashita. 1988. Seed production <strong>of</strong> Tilapia. In: Tilapia (ed.) T. Hidaka, Midori-shobo, Tokyo.
220<br />
Lake Malawi Fisheries Management Symposium - Proceedings<br />
Otolith growth increments in three cyprinid species in Lake Malawi and<br />
information <strong>of</strong> <strong>the</strong>ir early growth<br />
Shinsuke Morioka 1 & Emanuel Kaunda 2<br />
1 Department <strong>of</strong> Aquaculture and Fisheries Science, Bunda College <strong>of</strong> Agriculture, University <strong>of</strong> Malawi. c/o JICA Malawi Office, P.O.<br />
Box 30321, Lilongwe 3, Malawi. TEL: 265-277-214, FAX: 265-771-125, E-mail: morioka@<strong>malawi</strong>.net<br />
2 Department <strong>of</strong> Aquaculture and Fisheries Science, Bunda College <strong>of</strong> Agriculture, University <strong>of</strong> Malawi. c/o JICA Malawi Office, P.O.<br />
Box 30321, Lilongwe 3, Malawi<br />
Abstract<br />
Otoliths features and growth increments <strong>of</strong> three Malawian cyprinids, i.e. usipa Engraulicypris sardella, sanjika Opsaridium<br />
microcephalum and mpasa Opsaridium microlepis were investigated. The sagittae <strong>of</strong> all <strong>the</strong> species were not suitable for otolith<br />
increment reading due to <strong>the</strong> increment invisibility and fragile structures in rostrum portions. The asterisci have ambiguous core<br />
structures and fewer increment counts than <strong>the</strong> actual age (in Mpasa) or <strong>the</strong> ones in <strong>the</strong> lapilli (all species). This feature shows that<br />
<strong>the</strong> asteriscus is not applicable for daily increments analysis. The lapilli <strong>of</strong> <strong>the</strong>m had clear increments from <strong>the</strong> core to edge, and<br />
were considered to be <strong>the</strong> best otolith for increment analysis. Hence, <strong>the</strong> lapilli were employed to elucidate <strong>the</strong> breeding periods and<br />
growth patterns in three species. The breeding period <strong>of</strong> Usipa was observed to take place almost throughout <strong>the</strong> year and <strong>the</strong> one<br />
<strong>of</strong> Sanjika was observed to take place at least 8 months from November to July. The growth in larvae and juveniles <strong>of</strong> both Usipa<br />
and Sanjika was relatively slower in <strong>the</strong> dry season and faster in <strong>the</strong> rainy season. Such difference in growth is considered to be due<br />
to <strong>the</strong> difference in water temperature between <strong>the</strong> dry and rainy season.<br />
Key words: Cyprinidae, sagitta, lapillus, asteriscus, growth, Lake Malawi<br />
Introduction<br />
Information on <strong>the</strong> early growth <strong>of</strong> fish is indispensable for both <strong>the</strong> development <strong>of</strong> resource <strong>management</strong> and<br />
aquacultural activities. The three cyprinid species inhabiting Lake Malawi, Usipa Engraulicypris sardella, Sanjika<br />
Opsaridium microcephalum and Mpasa Opsaridium microlepis, are all important for commercial fishing and sports<br />
fishing in <strong>the</strong> latter two. However, <strong>the</strong> current situation <strong>of</strong> fishery production in those species is not positive. In<br />
Usipa Engraulicypris sardella, for instance, <strong>the</strong> mechanism for <strong>the</strong> great yearly catch fluctuation (Zidana 2000) has<br />
not been well elucidated, and little biological research has been made on <strong>the</strong> species (Thompson et al. 1995). In<br />
Mpasa Opsaridium microlepis, <strong>the</strong> recent decline in catch has been pointed out (Makimoto, pers. com.), and no<br />
research has been made on <strong>the</strong> species recently although Tweddle (1982, 1987) conducted preliminary surveys on<br />
<strong>the</strong> biological aspects <strong>of</strong> <strong>the</strong> species. Much <strong>of</strong> <strong>the</strong> biology on Sanjika Opsaridium microcephalum, is still unknown,<br />
such as breeding season, growth, seasonal distribution etc.<br />
Among <strong>the</strong> biological features <strong>of</strong> fish, <strong>the</strong> information <strong>of</strong> <strong>the</strong> early developmental stages is extremely important<br />
because <strong>the</strong> early biology could explain lots <strong>the</strong> subsequent features <strong>of</strong> fish species, i.e. <strong>the</strong> breeding activity,<br />
biomass fluctuation, recruitment success and so on. To obtain <strong>the</strong> information on <strong>the</strong> early biology <strong>of</strong> fish, <strong>the</strong><br />
utilization <strong>of</strong> otolith daily increment has been broadly applied since Pannella (1971) and <strong>the</strong> growth analysis in<br />
larvae and juveniles with daily increments was developed <strong>the</strong>reafter (Bro<strong>the</strong>rs and McFarland 1981,Campana and<br />
Neilson 1985, Campana 1990, Watanabe and Kuroki 1997). In most <strong>of</strong> <strong>the</strong> earlier studies employing otoliths, <strong>the</strong><br />
sagitta was used to age fish in days. However, <strong>the</strong> sagitta is occasionally unsuitable for <strong>the</strong> determination <strong>of</strong> age in<br />
days due to <strong>the</strong> structural complexity (occurrence <strong>of</strong> sub-daily increments or fragility) and <strong>the</strong> lapillus has resulted to<br />
be better material in such cases (H<strong>of</strong>f et al. 1997, Morioka and Machinandiarena 2001, Morioka et al. 2001).<br />
In this study, <strong>the</strong> detection <strong>of</strong> <strong>the</strong> applicable otoliths among <strong>the</strong> sagitta, lapillus and asteriscus were primarily<br />
conducted on Usipa Engraulicypris sardella, Sanjika Opsaridium microcephalum and Mpasa Opsaridium<br />
microlepis. Secondly, <strong>the</strong> elucidation <strong>of</strong> <strong>the</strong> breeding season and early growth pattern <strong>of</strong> <strong>the</strong> species were considered<br />
using <strong>the</strong> growth increments <strong>of</strong> <strong>the</strong> otolith that was observed as <strong>the</strong> applicable one in <strong>the</strong> primal achievement in this<br />
study.<br />
Materials and Methods<br />
Fish used in this study were <strong>the</strong> larvae, juveniles and sub-adults <strong>of</strong> three cyprinid species, i.e. Usipa Engraulicypris<br />
sardella, Sanjika Opsaridium microcephalum and Mpasa Opsaridium microlepis. Larvae and juveniles <strong>of</strong> Usipa and<br />
<strong>the</strong> juveniles <strong>of</strong> Sanjika were collected from Nkhotakota and Chia beach (Figure 1) using seine nets (1 mm mesh, 1<br />
m height, 8 m and 30 m width) operated along <strong>the</strong> shore. Collection <strong>of</strong> <strong>the</strong>se two species were made on 20 July, 17<br />
August 2000, January 18, February 28, 5 April and 3 May 2001 (n = 149 and 15.00 – 96.7 mm TL for Usipa, n =<br />
181 and 14.30 - 77.45 mm TL for Sanjika). Juveniles <strong>of</strong> Mpasa were hatched at <strong>the</strong> National Aquaculture Center,<br />
Domasi, Malawi by artificial fertilization (dry method) and 20 juveniles were sacrificed at 65 day-old after hatching
221<br />
Lake Malawi Fisheries Management Symposium - Proceedings<br />
(12.75-22.25 mm TL). Ten wild sub-adults <strong>of</strong> Mpasa were also collected from Salima on 1 May 2001 and<br />
Nkhotakota on 3 May 2001 (131.40 – 181.10 mm TL).<br />
Fish was preserved in 70% ethanol immediately after collection and <strong>the</strong> otoliths (sagitta, lapillus and asteriscus)<br />
were extracted. Extracted otoliths were embedded on <strong>the</strong> glass slides with epoxy resin. When otoliths were opaque,<br />
<strong>the</strong>y were ground with sand paper (# 1500) and lapping films (12 µm, 9 µm, 6 µm mesh) for being thin proximal<br />
sections, following <strong>the</strong> method described by Nishimura (1993). Ground surfaces <strong>of</strong> otoliths were occasionally etched<br />
by 0.1 N HCL to emphasize <strong>the</strong> contrast <strong>of</strong> <strong>the</strong> continuous and discontinuous zones in otoliths. Otolith<br />
microstructures were observed under <strong>the</strong> optic microscopy with transmitted light (x 200 - 400). For all species,<br />
otolith increment counts were counted and <strong>the</strong> radii <strong>of</strong> every five increments in Usipa’s lapilli were recorded. In<br />
Usipa, TL was back-calculated every 5 days using <strong>the</strong> relationship between otolith radii and TL, following <strong>the</strong><br />
method <strong>of</strong> Watanabe and Kuroki (1997).<br />
Figure 1. Collection sites <strong>of</strong> fish.<br />
Results<br />
Otolith features<br />
External and internal features <strong>of</strong> otoliths were more or less similar among three species <strong>of</strong> this study. The sagitta was<br />
arrow head shaped and had an obvious nucleus with two projections (rostrums) on anterior/posterior sides (Figure<br />
2). The increments in <strong>the</strong> sagittae were deposited clearly from <strong>the</strong> nucleus up to c. 30 th increment at <strong>the</strong> bases <strong>of</strong> both<br />
anterior- and posterior-rostrums, <strong>the</strong>n, <strong>the</strong>y became invisible in rostrum portions (Figure 2). Rostrum portions, in<br />
addition, were fragile and <strong>of</strong>ten destroyed by otolith extracting and grinding treatments. These features indicated that<br />
<strong>the</strong> sagitta was not a suitable material for <strong>the</strong> age determination in days.<br />
The lapillus was oval-shaped and had a clear nucleus (Figure 3). The increments in <strong>the</strong> lapilli were clearly visible<br />
from <strong>the</strong> nuclei to edge portion after grinding (Figure 3). The increment counts in <strong>the</strong> lapilli <strong>of</strong> laboratoryhatched/reared<br />
Mpasa juveniles agreed with <strong>the</strong> actual age in days (65 days after hatching). Thus, <strong>the</strong> lapilli were<br />
considered to be <strong>the</strong> applicable otolith for daily increment analysis in <strong>the</strong> species used in this study.<br />
The asteriscus was oval-shaped and had an ambiguous nucleus (Figure 4). This ambiguous nucleus made <strong>the</strong> 1 st<br />
increment identification impossible. In <strong>the</strong> asterisci, additionally, <strong>the</strong> increment counts were much fewer than <strong>the</strong>
222<br />
Lake Malawi Fisheries Management Symposium - Proceedings<br />
ones in <strong>the</strong> lapilli or, <strong>the</strong>y were much less than <strong>the</strong> actual age in days in laboratory-hatched/reared Mpasa juveniles.<br />
These features demonstrated that <strong>the</strong> asterisci were also not useful for daily increment analysis.<br />
On <strong>the</strong> basis <strong>of</strong> <strong>the</strong> upper observations, <strong>the</strong> lapilli were resulted to be <strong>the</strong> best material for <strong>the</strong> increment analysis <strong>of</strong><br />
otolith. Hence, <strong>the</strong> lapilli were employed for <strong>the</strong> subsequent analyses.<br />
A B C<br />
Figure 2. Sagittae <strong>of</strong> juveniles in Engraulicypris sardella (A), Opsaridium microcephalum (B) and<br />
Opsaridium microlepis (C). Bars indicate 100 µm.<br />
A B C<br />
Figure 3. Lapilli <strong>of</strong> juveniles in Engraulicypris sardella (A), Opsaridium microcephalum (B) and<br />
Opsaridium microlepis (C). Bars indicate 100 µm.<br />
A B C<br />
Figure 4. Asterisci <strong>of</strong> juveniles in Engraulicypris sardella (A), Opsaridium microcephalum (B) and<br />
Opsaridium microlepis (C). Bars indicate 100 µm.<br />
Breeding seasons<br />
Breeding season <strong>of</strong> each species was estimated by <strong>the</strong> increment counts in <strong>the</strong> lapilli. In Usipa, <strong>the</strong> hatching months<br />
were observed almost throughout <strong>the</strong> year except January, March, May and August although <strong>the</strong> frequencies <strong>of</strong> <strong>the</strong><br />
hatching month varied in each month, being particularly higher in December and April (Figure 5A). This suggested<br />
that Usipa bred almost throughout <strong>the</strong> year. In Sanjika, <strong>the</strong> hatching months were observed consecutively from late<br />
November to early July (Figure 5B), suggesting that Sanjika bred at least during 8 months a year. The highest<br />
frequency was observed in May and <strong>the</strong> second highest was in January. In Mpasa, <strong>the</strong> hatching months were<br />
observed from September to December although <strong>the</strong> number <strong>of</strong> specimens was only 10.
Frequency (%<br />
Frequency (%<br />
30<br />
25<br />
20<br />
15<br />
10<br />
5<br />
0<br />
45<br />
40<br />
35<br />
30<br />
25<br />
20<br />
15<br />
10<br />
5<br />
0<br />
B<br />
Nov Dec Jan Feb Mar Apr May Jun Jul<br />
Hatching month<br />
A<br />
223<br />
Lake Malawi Fisheries Management Symposium - Proceedings<br />
Sep Oct Nov Dec Jan Feb Mar Apr May Jun Jul Aug<br />
Hatching month<br />
Figure 5. Hatching months <strong>of</strong> Engraulicypris sardella (A) and Opsaridium microcephalum (B) estimated<br />
by <strong>the</strong> lapilli increment counts.<br />
Growth patterns<br />
Growth <strong>of</strong> Usipa larvae and juveniles born in <strong>the</strong> rainy season (November to February) was faster than <strong>the</strong> one born<br />
in <strong>the</strong> dry season (June and July)(Figure 6). The growth rate <strong>of</strong> Usipa in <strong>the</strong> rainy season was more than 0.70 mm TL<br />
per day while less than 0.50 mm TL in <strong>the</strong> dry season. Sanjika juveniles also showed that <strong>the</strong> growth in fish born in<br />
<strong>the</strong> rainy season was higher than <strong>the</strong> one born in <strong>the</strong> dry season (Figure 7). Sanjika could be separated into <strong>the</strong><br />
following 3 groups: fish born and grown in <strong>the</strong> rainy season (n = 74, referred to as <strong>the</strong> summer-born group), fish<br />
born in <strong>the</strong> rainy season and grown during both <strong>the</strong> rainy and dry seasons (n = 3, referred to as <strong>the</strong> intermediate<br />
group), and fish born and grown in <strong>the</strong> dry season (n = 104, referred to as <strong>the</strong> winter-born group). Growth rate in <strong>the</strong><br />
rainy season was more than 0.70 mm TL while less than 0.60 mm TL per day in <strong>the</strong> dry season. In Mpasa, <strong>the</strong><br />
largest specimen (181.60 mm TL) was aged 221 days after hatching and <strong>the</strong> smallest one (131.40 mm TL) was aged<br />
151 days, demonstrating that Mpasa grew at <strong>the</strong> rate <strong>of</strong> more than 0.80 mm TL per day.
Total length (m<br />
50<br />
45<br />
40<br />
35<br />
30<br />
25<br />
20<br />
15<br />
10<br />
5<br />
0<br />
born in November<br />
born in December<br />
born in January<br />
born in Feburuary<br />
born in dry season<br />
224<br />
Lake Malawi Fisheries Management Symposium - Proceedings<br />
0 10 20 30 40 50 60 70<br />
Number <strong>of</strong> lapilli increments (age in days)<br />
Figure 6. Relationship between lapilli increment counts (age in days) and back-calculated total length at<br />
ages (mm) in Engraulicypris sardella. Back-calculated TL was individually expressed <strong>the</strong> fish groups<br />
hatched in different months or season. Closed circle: fish born in November, opened circle: in December,<br />
opened square: in January, opened diamond: in February and closed triangle: in dry season, respectively.<br />
Total length (m<br />
120<br />
100<br />
80<br />
60<br />
40<br />
20<br />
0<br />
0 20 40 60 80 100 120 140 160<br />
Lapilli increment counts (age in days)<br />
Figure 7. Relationship between lapilli increment counts (age in days) and total length (mm). Closed circle:<br />
fish born/grown in rainy season, opened circle: fish born/grown in dry season, opened triangle: fish born<br />
in rainy season and grown in rainy/dry season.
225<br />
Lake Malawi Fisheries Management Symposium - Proceedings<br />
Discussion<br />
Difficulties in use <strong>of</strong> <strong>the</strong> sagittae for <strong>the</strong> determination <strong>of</strong> age in days have been occasionally pointed out because <strong>of</strong><br />
<strong>the</strong> structural complexity or <strong>the</strong> occurrence <strong>of</strong> sub-daily increments (H<strong>of</strong>f et al. 1997, Morioka and Machinandiarena<br />
2001, Morioka et al. 2001). In <strong>the</strong> three cyprinid species used in this study, <strong>the</strong> sagitta was considered inappropriate<br />
material for <strong>the</strong> daily increments analysis due to <strong>the</strong> fragility and invisibility <strong>of</strong> increments in rostrum portions<br />
(Figure 2). In <strong>the</strong> asteriscus, <strong>the</strong> difficulty in 1 st increment identification due to <strong>the</strong> ambiguous nuclei was observed<br />
(Figure 3). Moreover, in general, <strong>the</strong> asteriscus was observed to be formed later than <strong>the</strong> sagitta and lapillus, a<br />
certain period after hatching such as observed in Anguilla japonica (Umezawa 1988), Delitistes luxatus and<br />
Chasmistes brevirostris (H<strong>of</strong>f et al. 1997). Such information also demonstrates <strong>the</strong> disadvantage <strong>of</strong> <strong>the</strong> asterisci in<br />
<strong>the</strong> analysis <strong>of</strong> daily increments. Thompson et al. (1995) described that <strong>the</strong> asterisci had two projections and <strong>the</strong><br />
sagittae were formed later than <strong>the</strong> lapilli and asterisci in Usipa. We suspect that <strong>the</strong>y misidentified <strong>the</strong> sagittae as<br />
<strong>the</strong> asterisci. Additionally, <strong>the</strong>y employed <strong>the</strong> sagittae and asterisci in combination for <strong>the</strong> increment analysis instead<br />
<strong>of</strong> using <strong>the</strong> lapilli although <strong>the</strong>y found <strong>the</strong> readable increments in <strong>the</strong> lapilli and <strong>the</strong> upper-noted unsuitable<br />
characteristics were found in o<strong>the</strong>r otoliths. As shown in this study, as well as observed in o<strong>the</strong>r cyprinids (H<strong>of</strong>f et<br />
al. 1997), <strong>the</strong> lapilli are apparently superior to o<strong>the</strong>rs for <strong>the</strong> increment counts with <strong>the</strong> consecutive readability <strong>of</strong><br />
increments. The sagittae have been mainly applied for <strong>the</strong> otolith increments analysis so far. But, with taking <strong>the</strong><br />
superiority in <strong>the</strong> lapilli found in cyprinids (this study and H<strong>of</strong>f et al. 1997) and o<strong>the</strong>r species (Morioka and<br />
Machinandiarena 2001) into account, <strong>the</strong> use <strong>of</strong> <strong>the</strong> lapilli should be emphasized more and developed.<br />
Breeding period <strong>of</strong> Mpasa estimated in this study was from <strong>the</strong> latter half <strong>of</strong> <strong>the</strong> dry season and <strong>the</strong> beginning <strong>of</strong> <strong>the</strong><br />
rainy season (September to December). However, <strong>the</strong> sexually matured adults were captured in earlier months (July<br />
and August)(P.B. Kataya, pers. comm.). This indicates that <strong>the</strong> breeding season <strong>of</strong> Mpasa may extend from July to<br />
December.<br />
Breeding period <strong>of</strong> Usipa was observed to take place almost throughout <strong>the</strong> year and Sanjika’s one was at least over<br />
8 months (Figure 5), although <strong>the</strong> water temperature in <strong>the</strong> <strong>lake</strong> seasonally varies between 23 ºC and more than 28<br />
ºC (Patterson and Kachinjika 1995). These long-term breeding periods in Usipa and Sanjika strongly suggest <strong>the</strong><br />
existence <strong>of</strong> <strong>the</strong> plural stocks in both species, that is, <strong>the</strong> different stocks adapting to <strong>the</strong> different optimum<br />
temperature for reproduction.<br />
The growth <strong>of</strong> Usipa larvae and juveniles and Sanjika juveniles in <strong>the</strong> rainy season was higher than <strong>the</strong> one in <strong>the</strong><br />
dry season (Figures 6 and 7). The differences in growth also suggest <strong>the</strong> existence <strong>of</strong> <strong>the</strong> plural stocks in both Usipa<br />
and Sanjika in <strong>the</strong> <strong>lake</strong> as well as <strong>the</strong> long term breeding periods discussed above. Differences in growth may be<br />
able to be explained by <strong>the</strong> water temperature in <strong>the</strong> <strong>lake</strong> that is higher in <strong>the</strong> rainy season and lower in <strong>the</strong> dry<br />
season as referred above (Patterson and Kachinjika 1995). In addition, <strong>the</strong> larger water inlet from <strong>the</strong> rivers during<br />
<strong>the</strong> rainy season may provide more nutrients to promote <strong>the</strong> larger biomass <strong>of</strong> <strong>the</strong> planktonic organisms that is <strong>the</strong><br />
main diet <strong>of</strong> fish larvae and juveniles. However, Irvine (1995) observed that <strong>the</strong> zooplankton biomass was more<br />
abundant during <strong>the</strong> dry season than <strong>the</strong> rainy season (1995).<br />
Conclusive note<br />
In this study, several fundamental biological features <strong>of</strong> Usipa, Sanjika and Mpasa, <strong>the</strong> important species for both<br />
<strong>the</strong> commercial and sports fishing in Lake Malawi, were preliminary elucidated. More information is necessary to<br />
clarify <strong>the</strong> biological aspects <strong>of</strong> <strong>the</strong> early-staged fish especially in relation to <strong>the</strong> fish resource <strong>management</strong>.<br />
Additionally, <strong>the</strong> biological information <strong>of</strong> fish larvae and juveniles is indispensable for <strong>the</strong> fur<strong>the</strong>r development <strong>of</strong><br />
<strong>the</strong> aquacultural activity. In both senses, <strong>the</strong> long-term research on <strong>the</strong> important fish larvae and juveniles is strongly<br />
recommended.<br />
Acknowledgements<br />
We thank Mr. S. Matsumoto and his colleagues for assisting us in fish sample collection. We are also grateful to<br />
Japan International Cooperation Agency (JICA) for giving us <strong>the</strong> opportunity to conduct this study.
226<br />
Lake Malawi Fisheries Management Symposium - Proceedings<br />
References<br />
Bro<strong>the</strong>rs, E.B. and W.N. McFarland (1981) Correlation between otolith microstructure, growth and life history transitions in<br />
newly recruited French grunts (Haemulon flavolineatum). Rapp. P.-V. Reun. Cons. Int. Explor. Mer., 178, 369-374.<br />
Campana, S.E. (1990) How reliable are growth back-calculation based on otoliths? Can. J. Fish. Aquat. Sci., 47, 2219-2227.<br />
Campana, S. and J.D. Neilson (1985) Microstructure <strong>of</strong> fish otoliths. Can. J. Fish. Aquat. Sci., 42, 1014-1032.<br />
H<strong>of</strong>f, G.R., D.J. Logan and D.F. Markle (1997): Otolith morphology and increment validation in young Lost Liver and shortnose<br />
suckers. Transact. Amer. Fish. Soc., 126, 488-494.<br />
Morioka, S, L. Machinandiarena (2001) Comparison <strong>of</strong> daily increment formation pattern between sagittae and lapilli <strong>of</strong> ling<br />
(Genypterus blacodes) larvae and juveniles collected <strong>of</strong>f Argentina. New Zealand J. Mar. Freshwater Res., 35(1):<br />
111-119.<br />
Morioka, S., L. Machinandiarena and M.F. Villarino. 2001. Preliminary information on internal structures <strong>of</strong> otoliths and growth<br />
<strong>of</strong> ling, Genypterus blacodes (Ophidiidae), larvae and juveniles collected <strong>of</strong>f Argentine. Bull. Jpn. Soc. Fish.<br />
Oceanogr., 65(2): 9-16.<br />
Nishimura, A. (1993): Age determination <strong>of</strong> walleye pollock based on <strong>the</strong> otolith (Review). Sci. Rep. Hokkaido Fish. Exp. Stn.,<br />
42, 37-49. (in Japanese)<br />
Thompson, A.B., E.H. Allison, B.P. Ngatunga and A. Bulirani. 1995. Fish growth and breeding biology. In: The fishery potential<br />
and productivity <strong>of</strong> <strong>the</strong> pelagic zone <strong>of</strong> Lake Malawi / Niassa (ed.) A. Menz. Natural Resources Institute, UK.<br />
Tweddle, D. 1982. Fish breeding migrations in <strong>the</strong> north Rukuku area <strong>of</strong> Lake Malawi with a not on gillnet colour selectivity.<br />
Journal <strong>of</strong> Science and Technology in Malawi 3(2); 67-74.<br />
Tweddle, D. 1987. An assessment <strong>of</strong> <strong>the</strong> growth rate <strong>of</strong> Mpasa, Opsaridium microlepis (Gunter, 1864) (Pisces: Cyprinidae), by<br />
length frequency analysis. Journal <strong>of</strong> Limnological Society <strong>of</strong> South Africa 13(2): 52-57.<br />
Watanabe, Y. and T. Kuroki (1997) Asymptotic growth trajectories <strong>of</strong> larval sardine (Sardinops melanosticus) in <strong>the</strong> coastal<br />
waters <strong>of</strong>f western Japan. Mar. Biol., 127, 369-378.<br />
Zidana F.G. 2000, Malawi annual statistical bulletin. Ministry <strong>of</strong> Agriculture and Irrigation, Lilongwe.
227<br />
Lake Malawi Fisheries Management Symposium - Proceedings<br />
Development <strong>of</strong> African catfish Clarias gariepinus larvae during <strong>the</strong> transitional<br />
phase between endogenous and exogenous energy intake.<br />
Seiji Matsumoto, Shinsuke Morioka and Sigeru Kumagai<br />
Department <strong>of</strong> Aquaculture and Fisheries Science, Bunda College <strong>of</strong> Agriculture, University <strong>of</strong> Malawi. c/o JICA Malawi Office, P.O.<br />
Box 30321, Lilongwe 3, Malawi. Tel: 265-277-214, Fax: 265-771-125, E-mail: morioka@<strong>malawi</strong>.net<br />
Abstract<br />
Development <strong>of</strong> newly hatched African Catfish Clarias gariepinus larvae in an aspect <strong>of</strong> energy intake conversion was investigated.<br />
The anus and mouth <strong>of</strong> larvae opened by 16 and 22 h after hatching, respectively. However, <strong>the</strong> onset <strong>of</strong> feeding was observed<br />
from day 3 (67 h) after hatching when <strong>the</strong> jaw structure started being ossified and <strong>the</strong> nerve in barbel appeared. Yolk was<br />
completely absorbed on day 7 after hatching (166 h after hatching). These observations demonstrated that <strong>the</strong> larvae had <strong>the</strong><br />
transitional period to utilize both endogenous and exogenous energy sources for c. 100 h. Mass-mortality in larvae reared under<br />
starvation after hatching took place from day 11 to day 14, all specimens being dead on day 16. These phenomena indicated that<br />
<strong>the</strong> food-derived larvae had survived using <strong>the</strong> energy sources in <strong>the</strong>ir body tissues after yolk absorption for more than 4days<br />
(maximum 7 days). This fact showed <strong>the</strong> larvae <strong>of</strong> this species having a stronger starvation tolerance than <strong>the</strong> marine fish larvae<br />
reported in earlier studies. The delayed feeding experiments showed that <strong>the</strong> PNR (point <strong>of</strong> no-return) existed on day 9-10 after<br />
hatching, demonstrating that larvae should start feeding by 9-10 days after hatching to survive before reaching <strong>the</strong> PNR.<br />
Key words: Clarias gariepinus larvae, yolk, onset <strong>of</strong> feeding, survival<br />
Introduction<br />
African Catfish Clarias gariepinus (Burchell 1815) are widely distributed over Africa. This species is known as<br />
having an omnivorous feeding habit although <strong>the</strong> higher protein level in diet is recommendable (Viveen et al. 1985,<br />
Haylor 1992). Catfish species is <strong>the</strong> one <strong>of</strong> <strong>the</strong> main species under aquaculture especially in temperate and tropical<br />
freshwaters because <strong>of</strong> <strong>the</strong> omnivorous feeding habit and rapid growth such as observed in C. gariepinis (Haylor<br />
1992), Parasilurus asotus (Tsuchiya 1976) and Ictalurus punctatus (Watanabe 1988). In such background, <strong>the</strong><br />
aquacultural aspects, e.g. seed production/rearing techniques and nutritional features have been broadly surveyed so<br />
far in catfish species.<br />
For fur<strong>the</strong>r development <strong>of</strong> aquacultural techniques, <strong>the</strong> understanding <strong>of</strong> biological view in <strong>the</strong> larval stage is<br />
indispensable. Especially, <strong>the</strong> information on <strong>the</strong> survival, feeding performance and morphological development in<br />
early larvae should be well grasped in view <strong>of</strong> this critical period (Kohno 1998). Major achievements in such<br />
aspects have, so far, been made mainly in marine fin fish (Wiggins et al. 1985, Yamashita and Aoyama 1985,<br />
Khono et el. 1990). However, such features in catfish species have been scarcely made as yet. In addition, such<br />
information also contributes for fur<strong>the</strong>r understanding <strong>the</strong> fish biology in <strong>the</strong> natural water in relation to <strong>the</strong> resource<br />
<strong>management</strong> aspects.<br />
In this study, <strong>the</strong>refore, <strong>the</strong> survival, onset <strong>of</strong> feeding and <strong>the</strong> early development <strong>of</strong> morphology in newly-hatched<br />
African catfish larvae were investigated and <strong>the</strong> features during <strong>the</strong> energy intake conversion from endogenous to<br />
exogenous were discussed.<br />
Materials and methods<br />
Some 30,000 African catfish larvae used in this study were produced with artificial fertilization (dry method) at <strong>the</strong><br />
Department <strong>of</strong> Aquaculture and Fisheries Science, Bunda College <strong>of</strong> Agriculture, University <strong>of</strong> Malawi, on 15<br />
March (batch 1) and 15 April (batch 2) 2001. Newly-hatched larvae were stocked in 1000 l or 200 l plastic tanks<br />
immediately after hatching. Water temperature during rearing was 22-25 ºC. Artemia sp. naulii and natural<br />
zooplankton (Copepoda, Branchiopoda, Ploima etc.) were given at <strong>the</strong> density <strong>of</strong> 5 – 10 ind. per ml once a day. The<br />
hatching time was recorded in batch 1 as when <strong>the</strong> 1 st specimen hatched. Thereafter, some 500 larvae were<br />
intermittently sampled with <strong>the</strong> interval <strong>of</strong> more frequently than every 12 hours. Using <strong>the</strong>se specimens, <strong>the</strong> trend in<br />
decrease <strong>of</strong> <strong>the</strong> yolk sac volume and <strong>the</strong> morphological development were observed. Yolk sac volume can be<br />
calculated with <strong>the</strong> formula V = 4/6·πR 3 if <strong>the</strong> shape <strong>of</strong> yolk sac is spherical, where R is <strong>the</strong> yolk radius. But, we<br />
applied <strong>the</strong> formula V = π/6·LH 2 (Blaxter and Hempel 1963), where L is length (mm) and H is height (mm), because<br />
<strong>the</strong> shape <strong>of</strong> yolk sac was not spherical in this species. One hundred nine <strong>of</strong> <strong>the</strong>m were treated as being <strong>the</strong> double<br />
stained transparent specimen using <strong>the</strong> method <strong>of</strong> Kawamura and Hosoya (1991) to observe <strong>the</strong> jaw structures and<br />
barbel development.<br />
Sixty-five larvae from batch 1 were stocked in 1 l beaker and reared without feeding and survival rate was recorded<br />
until all larvae were died by starvation. Some 400 larvae from batch 2 were separately stocked in 7 beakers and 7
228<br />
Lake Malawi Fisheries Management Symposium - Proceedings<br />
different timings (delayed feeding) <strong>of</strong> first diet supply were set (Table 1). The survival rates in each setting were<br />
recorded.<br />
Table 1. Experimental design <strong>of</strong> delayed feeding.<br />
Results<br />
Settings Timings <strong>of</strong> 1 st diet supply<br />
D-4 Diet given on 4 days after hatching<br />
D-6 6 days after hatching<br />
D-8 8 days after hatching<br />
D-10 10 days after hatching<br />
D-12 12 days after hatching<br />
D-14 14 days after hatching<br />
Starvation Without diet until dead<br />
Yolk sac absorption and survival in food deprived specimens<br />
Total length (TL) <strong>of</strong> larvae at hatching was 4.07 ± 0.11 mm (mean ± SD, n = 10). TL, <strong>the</strong>n, continuously developed<br />
and reached 9.23 ± 0.71 mm (n = 5) at 166 h when yolk sac completely absorbed (Figure 1). Yolk sac <strong>of</strong> newlyhatched<br />
larvae drastically declined from hatching to 97 h after hatching as expressed by <strong>the</strong> formula V = -0.0102·T +<br />
1.0208 (r = 0.986). It gradually decreased <strong>the</strong>reafter as expressed by <strong>the</strong> formula V = -0.0002·T + 0.0329 (r = 0.732).<br />
The complete yolk sac absorption was observed at 166 h (7-day) after hatching (Figure 2). The food deprived<br />
(starved) larvae from batch 1 highly survived until <strong>the</strong> 10 days after hatching and <strong>the</strong> mass mortality took place<br />
<strong>the</strong>reafter (Figure 3). They all died on day 16 after hatching. In <strong>the</strong> larvae (from batch 2) under <strong>the</strong> different timings<br />
<strong>of</strong> 1 st diet giving, <strong>the</strong> ones <strong>of</strong> D-4, -6 and -8 survived with relatively higher survival rates (more than 50%) while <strong>the</strong><br />
ones <strong>of</strong> D-10, -12 and -14 showed <strong>the</strong> close patterns in mortality observed in starved larvae and all died after 17<br />
days after hatching in D-12, -14 and starvation (Figure 4). In D-10, only one larva survived.<br />
Total length (m<br />
12<br />
10<br />
8<br />
6<br />
4<br />
2<br />
0<br />
onset <strong>of</strong><br />
feeding<br />
0 50 100 150 200<br />
Hours after hatching<br />
Figure 1. Relationship between hour after hatching and total length (mm) in Clarias gariepinus larvae.<br />
Dotted line indicates <strong>the</strong> onset <strong>of</strong> feeding.
Yolk volume (mm<br />
1.2<br />
1<br />
0.8<br />
0.6<br />
0.4<br />
0.2<br />
0<br />
229<br />
Lake Malawi Fisheries Management Symposium - Proceedings<br />
Days after hatching<br />
0 1 2 3 4 5 6<br />
V = -0.0102T + 1.0208<br />
r =<br />
V = -0.0002T + 0.0329<br />
r = 0.732<br />
0 20 40 60 80 100 120 140 160 180<br />
Hours after hatching<br />
Figure 2. Relationship between hours after hatching and yolk sac volume (mm 3 ) in Clarias gariepinus<br />
larvae.<br />
Survival rate<br />
100<br />
90<br />
80<br />
70<br />
60<br />
50<br />
40<br />
30<br />
20<br />
10<br />
0<br />
yolk completely absorbed<br />
0 2 4 6 8 10 12 14 16 18<br />
Days after hatching (days <strong>of</strong> starvation)<br />
Figure 3. Relationship between days after hatching and survival rate (%) in starved Clarias gariepinus<br />
larvae.
Survival rate<br />
120<br />
100<br />
80<br />
60<br />
40<br />
20<br />
0<br />
Fed from D-4<br />
Fed from D-6<br />
Fed from D-8<br />
Fed from D-10<br />
Fed from D-12<br />
Fed from D-14<br />
Starved<br />
230<br />
Lake Malawi Fisheries Management Symposium - Proceedings<br />
yolk completely absorbed<br />
0 2 4 6 8 10 12 14 16 18<br />
Days after hatching<br />
Figure 4. Relationship between days after hatching and survival rate (%) in delayed feeding experiments<br />
<strong>of</strong> Clarias gariepinus larvae. See Table 1 for experimental design and symbols.<br />
Morphological development and feeding performance<br />
At hatching, <strong>the</strong> bony structure and barbel did not exist. The anus was observed to open at 16 h after hatching and<br />
<strong>the</strong> mouth opened at 22 h. The eye pigmentation was observed from 34 h and <strong>the</strong> development <strong>of</strong> barbel started as<br />
well. The cartilage structure <strong>of</strong> <strong>the</strong> upper / lower jaws appeared at 39.5 h. At 58 h, <strong>the</strong> upper / lower jaw structures<br />
started being ossified and <strong>the</strong> taste bud cell in <strong>the</strong> barbel started developing. At 67 h, <strong>the</strong> onset <strong>of</strong> feeding was<br />
observed. The bony structure <strong>the</strong>reafter developed and <strong>the</strong> cleithrum appeared at 70 h. At 112 h, <strong>the</strong> pectoral fin bud<br />
appeared and <strong>the</strong> cartilage <strong>of</strong> pectoral fin support appeared at 118 h. Morphological development at hours after<br />
hatching was described in Table 2.<br />
Table 2. Morphological development at hour after hatching.<br />
Hours after<br />
hatching<br />
0<br />
16<br />
22<br />
34<br />
58<br />
67<br />
70<br />
112<br />
118<br />
166<br />
Morphological features and<br />
feeding performance<br />
No bony structures and <strong>the</strong> eyes not pigmented<br />
Anus opened<br />
Mouth opened and barbel appeared<br />
Eye pigmentation started and upper / lower jaw structures<br />
appeared<br />
Upper / lower jaws started being ossified and taste bud cells<br />
in barbel appeared<br />
Onset <strong>of</strong> feeding<br />
Cleithrum appeared<br />
Pectoral fin bud appeared<br />
Pectoral fin support appeared<br />
Yolk completely absorbed
231<br />
Lake Malawi Fisheries Management Symposium - Proceedings<br />
Discussion<br />
Viveen et al. (1985) reported that <strong>the</strong> yolk sac <strong>of</strong> this species was absorbed by 3-day after hatching. However, in this<br />
study, <strong>the</strong> yolk sac was observed to retain until 166 h after hatching (7-day after hatching) although c. 98% <strong>of</strong> yolk<br />
sac was absorbed by 100 h (Figure 1). In o<strong>the</strong>r marine fish, <strong>the</strong> same trend, such as <strong>the</strong> drastic decrease in yolk sac<br />
volume in initial phase while it continued retaining with gradual decrease <strong>the</strong>reafter, was observed (Khono et al.<br />
1990). The onset <strong>of</strong> feeding was observed at 67 h after hatching and <strong>the</strong> period to utilize both endogenous and<br />
exogenous energy sources was elucidated for 100 h (more than 4 days) in this species. In pelagic marine fish larvae,<br />
generally, <strong>the</strong> overlapping period with endogenous and exogenous energy sources was much shorter such as<br />
observed in Chanos chanos (Kohno et al. 1990).<br />
The survival rate in food-deprived larvae was high until 10 days after hatching (Figures 3 and 4). In addition, <strong>the</strong><br />
larvae that were given diet 8 days after hatching showed relatively high survival (more than 50%) while <strong>the</strong> ones not<br />
given diet for more than 10 days after hatching died (Figure 4). This indicates that <strong>the</strong> PNR (point <strong>of</strong> no-return,<br />
(Blaxter and Hempel 1963)) <strong>of</strong> C. gariepinus exists at around 9~10-days after hatching at 22.0-25.0ºC water<br />
temperature. This demonstrates that <strong>the</strong> larvae need to start feeding by <strong>the</strong> 8 th day after hatching, although <strong>the</strong> lower<br />
water temperature may give more allowance in time until reaching <strong>the</strong> PNR. In species that have an oil globule, i.e.<br />
Psetta maxima (M. Moteki, unpubl. data), <strong>the</strong> yolk sac is absorbed at around onset <strong>of</strong> feeding and <strong>the</strong> oil globule is<br />
retained longer. In such species, <strong>the</strong> survival <strong>of</strong> larvae after onset <strong>of</strong> feeding relies mainly on energy supply from <strong>the</strong><br />
oil globule. However, C. gariepinnus is a species that does not have an oil globule, and <strong>the</strong> survival is considered to<br />
be influenced by <strong>the</strong> performance decline in <strong>the</strong> yolk sac.<br />
Rana (1985) reported that <strong>the</strong> yolk sac in Oreochromis mossambicus larvae was mainly consumed for <strong>the</strong><br />
maintenance <strong>of</strong> body, not for growth. In this study, however, <strong>the</strong> larvae showed a continuous growth in TL even<br />
during <strong>the</strong> phase before <strong>the</strong> onset <strong>of</strong> feeding (0~67 h, Figure 1). This shows <strong>the</strong> larvae <strong>of</strong> this species utilizing <strong>the</strong><br />
yolk sac both for <strong>the</strong> maintenance and growth <strong>of</strong> body.<br />
Although <strong>the</strong> anus and mouth opened at 16 and 22 h after hatching, respectively, <strong>the</strong> onset <strong>of</strong> feeding was observed<br />
at 67 h (Table 2). At <strong>the</strong> time <strong>of</strong> <strong>the</strong> onset <strong>of</strong> feeding, <strong>the</strong> initial ossification <strong>of</strong> jaw structures was observed as well as<br />
<strong>the</strong> occurrence <strong>of</strong> taste buds in <strong>the</strong> barbels. This process demonstrates that <strong>the</strong> larvae do not possess <strong>the</strong> feeding<br />
function before <strong>the</strong> start <strong>of</strong> ossification in jaw structures and <strong>the</strong> appearance <strong>of</strong> taste buds in barbel (Table 2). In<br />
several marine species as reported earlier, e.g. Chanos chanos (Morioka 1993) and Psetta maxima (M. Moteki, pers.<br />
comm.), <strong>the</strong> pectoral fin bud appeared before or at <strong>the</strong> onset <strong>of</strong> feeding. However, in C. gariepinus, <strong>the</strong> cleithrum<br />
appeared at 70 h (Table 2) and <strong>the</strong> pectoral fin structures appeared <strong>the</strong>reafter (112 h) (Table 2), showing that <strong>the</strong><br />
pectoral fin is functionally not related with <strong>the</strong> onset <strong>of</strong> feeding in this species. This suggests that <strong>the</strong> larval C.<br />
gariepinus have different feeding manners from Chanos chanos, in an aspect <strong>of</strong> <strong>the</strong> utility <strong>of</strong> pectoral fin being<br />
relevant to swimming manner. In addition, Taki et al. (1987) reported that <strong>the</strong> swimming manner shifts from <strong>the</strong><br />
undulation to caudal propulsion when <strong>the</strong> structures in caudal fin are ossified in Chanos chanos larvae, while it was<br />
observed that <strong>the</strong> larval C. gariepinus was not likely to have such change in <strong>the</strong> swimming manner. Although lots <strong>of</strong><br />
fish species have pelagic larval stages and feed on suspended organisms as reported in marine fin fish species<br />
(Tanaka 1975), C. gariepinus are ra<strong>the</strong>r benthic even in pre-larval stage with negative phototaxis and it does not<br />
have <strong>the</strong> planktonic / pelagic larval phase. Such ecological differences seem to be relevant to <strong>the</strong> above-mentioned<br />
differences in morphological development.<br />
Conclusive note<br />
In this study, <strong>the</strong> preliminary information <strong>of</strong> <strong>the</strong> larval biology in relation to <strong>the</strong> onset feeding was obtained. The<br />
elucidated features are; 1) Clarias gariepinus larvae have <strong>the</strong> strong starvation tolerance supported by <strong>the</strong> long-term<br />
retention <strong>of</strong> yolk sac, 2) this species has a relatively long period to utilize both endogenous and exogenous energy<br />
sources, 3) <strong>the</strong> PNR <strong>of</strong> this species is around 9~10-days after hatching that indicates <strong>the</strong> larvae require to start<br />
feeding before reaching <strong>the</strong> PNR for higher survival, and 4) <strong>the</strong> larvae <strong>of</strong> this species are able to start feeding when<br />
<strong>the</strong>y possess <strong>the</strong> ossified jaw structures and <strong>the</strong> appearance <strong>of</strong> taste buds in barbel. However, <strong>the</strong> survival <strong>of</strong> fish<br />
larvae is strongly influenced by <strong>the</strong> quality <strong>of</strong> bloodstock and eggs that also affect <strong>the</strong> subsequent development <strong>of</strong><br />
feeding functions. In addition, <strong>the</strong> development <strong>of</strong> feeding functions is relevant to <strong>the</strong> development in morphology,<br />
especially in skeletal structures as shown in Taki et al. (1987). For fur<strong>the</strong>r consideration on <strong>the</strong> survival and feeding<br />
aspects relevant not only to aquaculture but <strong>the</strong> biological features in <strong>the</strong> wild, <strong>the</strong> detailed investigation on <strong>the</strong><br />
maternal factors such as egg quality and skeletal development would be necessary.
232<br />
Lake Malawi Fisheries Management Symposium - Proceedings<br />
Acknowledgements<br />
We thank Mr. O. Matambo and his colleagues for assisting us in <strong>the</strong> hatchery activities. We are also grateful to<br />
Japan International Cooperation Agency (JICA) for giving us <strong>the</strong> opportunity to conduct this study.<br />
References<br />
Blaxter, J.H.S. and G. Hempel. 1963. The influence <strong>of</strong> egg size on herring larvae (Clupea harrengus). J. Cons. Int. Explor. Mer.,<br />
28:211-240.<br />
Haylor, G.S. 1992. African catfish hatchery manual. Institute <strong>of</strong> Aquaculture, University <strong>of</strong> Stirling, Stirling.<br />
Kawamura, K. and K. Hosoya. 1991. A modified double staining technique for making a transparent fish-skeletal specimen. Bull.<br />
Natl. Res. Inst. Aquaculture, 20: 11-18.<br />
Kohno, H. 1998. Early life history features influencing larval survival <strong>of</strong> cultivated tropical finfish. In: Tropical mariculture, (ed.)<br />
S.S. De Silva, Pages 71-111, Academic Press, London.<br />
Kohno, H., M. Duray, A. Gallego and Y. Taki. 1990. Survival <strong>of</strong> larval milkfish, Chanos chanos, during changeover from<br />
endogenous to exogenous energy sources. Proc. Sec. Asian Fish. Forum, 437-440.<br />
Rana, K.J. 1985. Influence <strong>of</strong> egg size on <strong>the</strong> growth, onset <strong>of</strong> feeding, point-<strong>of</strong>-no-return, and survival <strong>of</strong> unfed Oreochromis<br />
mossambicus fry. Aquaculture, 46: 119-131.<br />
Taki, Y., H. Kohno and S. Hara. 1987. Morphological aspects <strong>of</strong> <strong>the</strong> development <strong>of</strong> swimming and feeding functions in <strong>the</strong><br />
milkfish Chanos chanos. Japan. J. Ichthyol., 34(2): 198-208.<br />
Tanaka, M. 1975. Digestive systems in fish juveniles. In.: Feeding and Development <strong>of</strong> Fish Juveniles, Pages 7-23, (eds.) T. Iwai<br />
and H. Tsukahara, Kouseisya Kouseikaku, Tokyo. (in Japanese)<br />
Tsuchiya, M. 1976. Aquaculture <strong>of</strong> catfish. In: Freshwater Aquaculture, Pages 429-434, (ed.) D. Inaba, Kouseisya Kouseikaku,<br />
Tokyo. (in Japanese)<br />
Viveen, W.J.A.R., C.J.J. Richter, P.G.W.J. van Oordt, J.A.L. Janssen and E.A. Huisman. 1985. Practical Manual for <strong>the</strong> culture<br />
<strong>of</strong> <strong>the</strong> African catfish (Clarias gariepinnus). Ministry <strong>of</strong> foreign affairs <strong>of</strong> <strong>the</strong> Ne<strong>the</strong>rlands, Agricultural University <strong>of</strong><br />
Wageningen and University <strong>of</strong> Utrecht, Hague.<br />
Watanabe, T. 1988. Fish nutrition. In: Fish Nutrition and Mariculture, Pages 1-77, Japan International Cooperation Agency,<br />
Tokyo.<br />
Wiggins, T.A., T.R. Bender, Jr., V.A. Mudrak and J.A. Coil. 1985. The development, feeding, and survival <strong>of</strong> cultured American<br />
shad larvae through <strong>the</strong> transition from endogenous to exogenous nutrition. Prog. Fish-Cul., 47: 87-93.<br />
Yamashita, T. and T. Aoyama. 1985. Hatching time, yolk sac absorption, onset <strong>of</strong> feeding, and early growth <strong>of</strong> <strong>the</strong> Japanese sand<br />
eel Ammodytes personatus. Nippon Suisan Gakkaishi, 51: 1777-1780.
233<br />
Lake Malawi Fisheries Management Symposium - Proceedings<br />
Effect <strong>of</strong> temperature on oocyte development <strong>of</strong> Oreochromis karongae<br />
(TREWAVAS)<br />
L.J. Kamanga, 1 E. Kaunda, 1 J.P. Mtimuni 1 , A.O. Maluwa 2 and M.W. Mfitilodze 1<br />
1 Bunda College <strong>of</strong> Agriculture, P.O. Box 219, Lilongwe.<br />
2 National Aquaculture Centre P.O. Box 44, Domasi.<br />
Abstract<br />
Oreochromis karongae (Trewavas) is one <strong>of</strong> <strong>the</strong> indigenous Tilapias that exhibit favorable traits for aquaculture in Malawi. However,<br />
fingerling production has been a problem. An experiment was <strong>the</strong>refore carried out to find <strong>the</strong> effect <strong>of</strong> temperature on oocyte<br />
development <strong>of</strong> <strong>the</strong> fish. Female O. karongae were reared under two temperature regimes, room (20.3±� 0.8 o C) and raised (26.5 ± �<br />
�0.5 o C) for 90 days while changes in gonadosomatic index (GSI) and oocyte developmental stages were followed every 45 days.<br />
Fish samples from <strong>the</strong> pond in which experimental fish were collected were used for comparison. Results showed that raising<br />
temperature to 26.5 ± 0.5 o C significantly enhanced oocyte development. Higher GSI (p
234<br />
Lake Malawi Fisheries Management Symposium - Proceedings<br />
circulating throughout <strong>the</strong> experimental period and temperature was monitored daily in <strong>the</strong> morning and in <strong>the</strong><br />
afternoon.<br />
The fish were fed twice per day at 3 % body weight. Apart from <strong>the</strong> two treatments, some fish samples from <strong>the</strong><br />
pond in which experimental fish were collected were used for comparison.<br />
Sampling <strong>of</strong> oocytes<br />
Nine fish from each treatment were sacrificed after every 45 days. The fish were weighed and dissected. Ovaries<br />
were removed, weighed and gonadosomatic index (GSI) was calculated as:<br />
GSI = gonad mass (g) x 100/ total body mass (g) (Crim and Glebe 1990)<br />
Macroscopic stages <strong>of</strong> <strong>the</strong> gonads were observed and classified according to Ricker, (1971). Ovaries from 3 fish in<br />
each treatment were fixed in Bouin’s solution for histological purposes immediately after post mortem. After 4-24<br />
hrs, <strong>the</strong>y were washed in 50 % ethanol and stored in 70 % ethanol.<br />
Water quality <strong>management</strong><br />
To maintain suitable water quality, bi<strong>of</strong>ilters were placed in each aquarium and air was supplied continuously. Fish<br />
excreta and leftover feed were siphoned out daily. Water in <strong>the</strong> aquaria was changed once every week. Apart from<br />
temperature, dissolved oxygen, pH, and ammonia levels were monitored.<br />
Histological analyses<br />
Histological analyses were done at <strong>the</strong> College <strong>of</strong> Medicine, University <strong>of</strong> Malawi, in Blantyre. The middle, distal<br />
and proximal ends <strong>of</strong> each ovary were prepared according to Hinton (1990). In summary, tissues was washed in a<br />
series <strong>of</strong> formalin, alcohol, wax and toluene and <strong>the</strong>n embedded in wax blocks. The wax blocks were cut and<br />
stained with hematoxylin and eosin (H & E). The samples were <strong>the</strong>n mounted on slides and observed under a<br />
microscope.<br />
Observations on ovarian tissue from histological samples were classified into five stages <strong>of</strong> maturity based on <strong>the</strong><br />
abundant gametogenic cell types present (Table 1) after modification <strong>of</strong> <strong>the</strong> classification by Crim and Glebe (1990).<br />
Oocytes were observed under <strong>the</strong> microscope at x100 magnification. Three fields were sampled in each histological<br />
section and <strong>the</strong> different types <strong>of</strong> oocytes observed were counted. The number <strong>of</strong> a particular type <strong>of</strong> oocyte was<br />
<strong>the</strong>n expressed as a percentage <strong>of</strong> <strong>the</strong> total number <strong>of</strong> oocytes observed in <strong>the</strong> three fields.<br />
Table 1. Classification <strong>of</strong> maturity stages <strong>of</strong> oocytes in Oreochromis karongae<br />
Stage Description<br />
Immature Previtellogenic oocytes: small, spherical ovarian cells containing a central nucleus and<br />
increasing amounts <strong>of</strong> cytoplasm. The type <strong>of</strong> oocytes were <strong>the</strong> perinucleolar oocytes.<br />
Maturing Vitellogenic oocytes: oocytes that had incorporated <strong>the</strong> yolky material produced by <strong>the</strong><br />
liver. This consisted <strong>of</strong> early yolk vesicle and primary yolk granule oocytes.<br />
Mature These were largest oocytes and were filled with tertiary yolk granules<br />
Post<br />
follicles<br />
ovulatory Consisted <strong>of</strong> empty follicles and corpora lutea<br />
Dying Oocytes that showed signs <strong>of</strong> dying.<br />
Data analysis<br />
A t-test was used to analyze for differences in <strong>the</strong> GSI <strong>of</strong> fish. Percentages <strong>of</strong> oocytes from histological sections<br />
were transformed to natural logarithm (ln) and subjected to <strong>the</strong> general linear model (GLM) <strong>of</strong> Statistical Analysis<br />
System (SAS) package to test differences in <strong>the</strong> relative frequency <strong>of</strong> oocyte stages. Where significant differences<br />
appeared, means were separated using Scheffe’s test at 5 % probability.
Results<br />
235<br />
Lake Malawi Fisheries Management Symposium - Proceedings<br />
Gonad development<br />
Raised temperature was maintained at 26.5 ± 0.5 o C. Room temperature fluctuated between 18.5 ± 0.8°C in <strong>the</strong><br />
morning and 19.2 ± 0.8 o C in <strong>the</strong> afternoon during <strong>the</strong> first 45 days. In <strong>the</strong> next 45 days temperature was 21.4 ±<br />
0.7°C in <strong>the</strong> morning and 22.0 ± 0.8 o C in <strong>the</strong> afternoon. In ponds <strong>the</strong> temperature was 22.0 ± 1.9 o C. Some fish died<br />
during <strong>the</strong> acclimatization period. The mortality rate in raised and room temperatures was 4 and 37 %, respectively.<br />
Fish from raised temperature had higher GSI than fish at room temperature (p
236<br />
Lake Malawi Fisheries Management Symposium - Proceedings<br />
Table 3. Mean gonadosomatic index <strong>of</strong> Oreochromis karongae females from raised and pond<br />
temperature<br />
Day Raised temperature Pond temperature<br />
Mean GSI SE Mean GSI SE<br />
0 0.13 0.012 0.13 0.012<br />
45 0.817 0.657 a 0.217 0.012 b<br />
90 1.133 0.471 a 0.257 0.027 b<br />
Means with different superscripts in <strong>the</strong> same row<br />
are significantly different (p
Percentage (%)<br />
100<br />
90<br />
80<br />
70<br />
60<br />
50<br />
40<br />
30<br />
20<br />
10<br />
0<br />
im mg mt<br />
Oocyte type<br />
po dy<br />
237<br />
Lake Malawi Fisheries Management Symposium - Proceedings<br />
room<br />
raised<br />
pond<br />
Figure 3. Number <strong>of</strong> immature (im), maturing (mg), mature (mt), dying (dy) oocytes and post ovultory<br />
follicles (po) expressed as a percentage <strong>of</strong> <strong>the</strong> total number <strong>of</strong> oocytes in each histological section after<br />
45 days <strong>of</strong> <strong>the</strong> experiment<br />
Percentage (%)<br />
90<br />
80<br />
70<br />
60<br />
50<br />
40<br />
30<br />
20<br />
10<br />
0<br />
im mg mt po<br />
Oocyte type<br />
room<br />
raised<br />
pond<br />
Figure 4. Number <strong>of</strong> immature (im), maturing (mg), mature (mt) oocytes and post ovultory follicles (po)<br />
expressed as a percentage <strong>of</strong> <strong>the</strong> total number <strong>of</strong> oocytes in each histological section after 90 days <strong>of</strong> <strong>the</strong><br />
experiment<br />
Temperature influenced (p
238<br />
Lake Malawi Fisheries Management Symposium - Proceedings<br />
Table 5. Mean number <strong>of</strong> immature, maturing, mature, dying oocytes and post ovulatory follicles<br />
expressed as a percentage (transformed to natural logarithm) <strong>of</strong> <strong>the</strong> total number <strong>of</strong> oocytes in each<br />
histological section at different times and temperature regimes.<br />
Period Treatment Oocyte type/Mean percentage transformed to natural logarithm<br />
Immature Maturing Mature *POF Dying<br />
Initial 3.21 1.79 1.2 0.87 0.81<br />
Day 45 Room 0.90±0.45 a 4.49±0.67 a 0.45±0.38 b 1.11±0.33 a 2.78±0.55 a<br />
Raised 0.14±0.28 a 1.54±0.41 b 3.15±0.24 a 0.45±0.20 a 0.83±0.34 b<br />
Pond 1.06±0.46 a 4.82±0.68 a 0.13±0.39 b 0.57±0.34 a 1.12±0.56 b<br />
Day 90 Room 1.63±0.44 b 4.30±0.36 a 0.07±0.30 b 0.73±0.33 a 0<br />
Raised 3.47±0.38 a 4.13±0.31 a 1.33±0.26 a 0.78±0.29 a 0<br />
Pond 1.34±0.28 b 4.05±0.23 a 1.72±0.19 a 2.02±0.21 b 0<br />
a, b<br />
Means with different superscripts within <strong>the</strong> same column and period are significantly different (p
239<br />
Lake Malawi Fisheries Management Symposium - Proceedings<br />
Figure 5. Oocytes from Oreochromis karongae reared at room, raised and pond temperature. A: Oocytes<br />
from fish samples at <strong>the</strong> onset <strong>of</strong> <strong>the</strong> experiment (24 th July 2000); B, C, and D: Oocytes from fish samples<br />
from room, raised and pond temperature after 45 days, respectively. E, F and G: Oocytes from fish<br />
samples from room, raised and pond temperature, respectively after 90 days<br />
Brummet (1995) suggested that temperatures outside <strong>the</strong> range <strong>of</strong> 22-36 o C during normal reproduction might act as<br />
a terminating cue (a factor that may interfere with final ovulation and spawning) in Tilapia. Since room temperature<br />
was outside <strong>the</strong> ideal range for oocyte development, oocyte development in fish from room temperature was inferior<br />
to that from raised temperature. Poor oocyte development observed at room temperature may mean that <strong>the</strong> low<br />
temperature interfered with <strong>the</strong> release <strong>of</strong> GtH by <strong>the</strong> hypothalamo-hypophyseal complex, which in turn slowed<br />
down vitellogenesis. Barnabe (1994) stated that temperature directly affects <strong>the</strong> production <strong>of</strong> GtH and eventually<br />
affect <strong>the</strong> vitellogenesis process. Jalabert and Zohar (1982) reported that exogenous vitellogenesis seems to be<br />
completely inhibited by low temperatures and all yolk-bidden oocytes disappear during <strong>the</strong> cold season.
240<br />
Lake Malawi Fisheries Management Symposium - Proceedings<br />
Low temperatures (below 20 o C) also reduce activity and feeding <strong>of</strong> tilapias (Chervinski 1982, Piper et al. 1982).<br />
Reduced feeding could be <strong>the</strong> o<strong>the</strong>r factor that might have contributed to poor ovarian development in fish raised<br />
under room temperature. Generally, a relatively lower feed intake was observed in fish under room temperature.<br />
The reduced feeding may have resulted in <strong>the</strong> fish using fat reserves from <strong>the</strong> body to provide metabolites for<br />
survival. Barnabe (1994), reported that if fat reserves are totally depleted, gonads provide <strong>the</strong> metabolites which<br />
allow <strong>the</strong> animal to survive. This may have occurred in fish that were kept at room temperature <strong>the</strong>reby resulting in<br />
poor gonad development in <strong>the</strong> fish.<br />
At <strong>the</strong> onset <strong>of</strong> <strong>the</strong> experiment, <strong>the</strong>re were more immature oocytes than during <strong>the</strong> rest <strong>of</strong> <strong>the</strong> sampling days. This<br />
was expected for two reasons. Firstly, <strong>the</strong> experimental fish were still growing and <strong>the</strong>refore oocytes were just<br />
developing at that time. Secondly, this was <strong>the</strong> coolest time <strong>of</strong> <strong>the</strong> year (July), which is outside <strong>the</strong> breeding period<br />
<strong>of</strong> O. karongae (Brooks and Maluwa 1997). Therefore, it was expected that <strong>the</strong> ovarian activity would be dormant,<br />
hence <strong>the</strong> advanced oocyte stages were not expected to dominate. The percentage <strong>of</strong> immature oocytes was lowest<br />
after 45 days <strong>of</strong> <strong>the</strong> experiment and increased again after 90 days. Increase <strong>of</strong> immature oocytes after 90 days may<br />
mean that <strong>the</strong> gonadal regression that was taking place in <strong>the</strong> ovaries stimulated development <strong>of</strong> more oocytes.<br />
Mature oocytes were most abundant in raised temperature. This was expected because this temperature level was<br />
within <strong>the</strong> range suitable for normal oocyte development in Tilapia (Chervinski 1982, Brummet 1995). The mature<br />
oocytes were also present throughout <strong>the</strong> experimental period because immature and maturing oocytes that were<br />
present were developing fur<strong>the</strong>r.<br />
The high relative frequency <strong>of</strong> maturing oocytes from <strong>the</strong> pond and room temperature may reflect <strong>the</strong> unfavorable<br />
conditions for oocyte development. Oocyte development may have been arrested to this stage while waiting for<br />
suitable conditions for development. It is however interesting to note that <strong>the</strong> proportions <strong>of</strong> maturing oocytes<br />
increased with time and were highest after 90 days implying that development from immature to maturing oocytes<br />
was enhanced with time. As room and pond temperatures were not controlled, <strong>the</strong> temperature increased with time<br />
due to change in season. The temperature was thus getting more favorable for <strong>the</strong> oocytes to develop from<br />
immature to maturing types.<br />
The presence <strong>of</strong> almost all <strong>the</strong> maturity stages <strong>of</strong> oocytes in <strong>the</strong> ovaries are in agreement with what Msiska (1998)<br />
found. The results show that O. karongae has asynchronous ovaries. DeVlaming (1983) as cited by West (1990)<br />
reported that most fish with asynchronous ovaries have protracted spawning seasons with multiple spawnings.<br />
Therefore <strong>the</strong>re may be a possibility that O. karongae can have protracted spawning seasons and/or multiple<br />
spawnings. This is evident from studies on <strong>the</strong> breeding season <strong>of</strong> O. karongae, which show that it has a prolonged<br />
spawning period in Lake Malombe (July-October) while in Lake Malawi it has two spawning peaks, August-<br />
October and December-February (Pálsson et al 1999). In <strong>the</strong> sou<strong>the</strong>rn part <strong>of</strong> Malawi (Thyolo), farmers report that<br />
O. karongae spawns throughout <strong>the</strong> year except during <strong>the</strong> cold season, which is from May to July (Jamu 2001,<br />
personal communication). The results <strong>of</strong> <strong>the</strong> current experiment show <strong>the</strong> possibility to circumvert <strong>the</strong> seasonal<br />
breeding <strong>of</strong> O. karongae in hatcheries by raising temperature to 26.5 ± 0.5 o C during <strong>the</strong> cold season.<br />
References<br />
Admassu, D. 1996. The breeding season <strong>of</strong> Tilapia, Oreochromis niloticus L. in Lake Awassa (Ethiopian rift valley).<br />
Hydrobiologia, 337:77-83.<br />
Barnabè, G. 1994. Biological basis <strong>of</strong> fish culture. In Barnabè, G. (ed.) Aquaculture: Biology and ecology <strong>of</strong> cultured species.<br />
Ellis Horwood. New York. pp. 227-372.<br />
Bromage, N.R. 1995. Broodstock <strong>management</strong> and seed quality. In Bromage, N.R. and Roberts, R.J. (eds.). Broodstock<br />
<strong>management</strong> and egg and larval quality. Blackwell Science Ltd. Oxford UK. pp. 1-24.<br />
Brooks, A. C. & Maluwa, A. O. 1997. Fish farming in Malawi: A case study <strong>of</strong> <strong>the</strong> Central and Nor<strong>the</strong>rn Regions Fish Farming<br />
Project. Technical Supplement: On-station trials. Government <strong>of</strong> Malawi and European Commission. 37p.<br />
Brummett, R. E. 1995. Environmental regulation <strong>of</strong> sexual maturation and reproduction in Tilapia. Reviews in Fisheries Science,<br />
3:231-248.<br />
Chervinski, J. 1982. Environmental physiology <strong>of</strong> Tilapias. In R.S.V. Pullin and R.H. Lowe-McConnell (eds.) The biology and<br />
culture <strong>of</strong> Tilapias. ICLARM Conference Proceedings 432p. International Center for Living Aquatic Resources<br />
Management, Manila, Philippines. p.119-128.<br />
Chmilevskiy, D.A. 1995a. Effect <strong>of</strong> reduced temperature on oogenesis <strong>of</strong> <strong>the</strong> mouth brooder, Oreochromis mossambicus 2. Effect<br />
on fish twenty-two days after hatching. Journal <strong>of</strong> Ichthyology, 35:72-80.<br />
Chmilevskiy, D.A. 1995b. Effect <strong>of</strong> reduced temperature on oogenesis in Tilapia, Oreochromis mossambicus. 3. Impact on fish at<br />
age 30 and 60 days after hatching. Journal <strong>of</strong> Ichthyology, 35:119-129.<br />
Chmilevskiy, D.A. and Lavrova, T.V. 1990. The influence <strong>of</strong> temperature on oogenesis in Tilapia, Oreochromis<br />
mossambicus. Journal <strong>of</strong> Ichthyology, 30:14-24.
241<br />
Lake Malawi Fisheries Management Symposium - Proceedings<br />
Crim, L.W. & Glebe, B.D. 1990. Reproduction. In Shreck, C.B. and Moyle, P.B. (ed.) 1990. Methods for fish biology. American<br />
Fisheries Society. Be<strong>the</strong>sda, Maryland. pp. 529-553.<br />
Das, P. & Ponniah, A.G. 1993. Research needs in fish breeding and genetics in aquaculture for <strong>the</strong> year 2000. In aquaculture<br />
research needs for 2000 A.D. AA Balkema/Rotterdam. India. pp. 181-195.<br />
Hinton, D.E. 1990. Histological techniques. In Shreck, C.B. and Moyle, P.B. (ed.) 1990. Methods for fish biology. American<br />
Fisheries Society. Be<strong>the</strong>sda, Maryland. pp. 191-211.<br />
Jalabert, B. & Zohar, Y. 1982. Reproductive physiology in cichlid fishes with particular reference to Tilapia and Saro<strong>the</strong>rodon.<br />
In R.S.V. Pullin and R.H. Lowe-McConnell (eds.) The biology and culture <strong>of</strong> Tilapias. ICLARM Conference<br />
Proceedings 432p. International Center for Living Aquatic Resources Management, Manila, Philippines. p.129-140.<br />
Msiska, O.V. 1998. Reproductive biology and growth <strong>of</strong> Oreochromis (Nyasalapia) karongae in ponds and open water in<br />
Malawi. Ph.D. Thesis. University <strong>of</strong> Malawi. 221p.<br />
Msiska, O.V. & Costa-Pierce, B.A. 1997. Factors affecting <strong>the</strong> spawning success <strong>of</strong> Oreochromis karongae (Trewavas) in ponds.<br />
Aquaculture Research, 28:87-99.<br />
Pálsson, Ó. K., Bulirani, A. & Banda, A. 1999. A review <strong>of</strong> biology, <strong>fisheries</strong> and population dynamics <strong>of</strong> chambo (Oreochromis<br />
spp., CICHLIDAE) in Lakes Malawi and Malombe. Government <strong>of</strong> Malawi. Fisheries Department. Fisheries Bulletin<br />
No.38. 35p.<br />
Piper, R.G., McElwain, I.B., Orme, L.E., McCaren, J.P., Fowler, L.G., & Leonard, J.R. 1982. Fish Hatchery <strong>management</strong>. US<br />
Department <strong>of</strong> <strong>the</strong> Interior Fish and Wildlife Services. Washington D.C. 517p.<br />
Ricker, W.E. 1971. Methods for assessment <strong>of</strong> fish production in fresh waters. IBP Handbook 3:348p.<br />
SAS. 1996. The Statistical Analysis System. SAS Institute Inc. Cary, NC 27513. USA.<br />
Srisakultiew, P. & Wee, K.L. 1988. Synchronous spawning <strong>of</strong> Nile Tilapia through hypophysation and temperature manipulation.<br />
In Pullin, R.S.V.,Bhukaswan, T., Tonguthai, K. and Maclean, J.L. (eds.). The second international <strong>symposium</strong> on<br />
Tilapia on aquaculture. 623p. Department <strong>of</strong> Fisheries, Bangkok, Thailand and International Center for Living Aquatic<br />
Resources and Management. Manila, Philippines. ICLARM conference <strong>proceedings</strong>. p.275-284.<br />
Subasinghe, R.P. & Somerville, C. 1992. Effects <strong>of</strong> temperature on hatchability, development and growth <strong>of</strong> eggs and yolk-sac<br />
fry <strong>of</strong> Oreochromis mossambicus (Peters) under artificial incubation. Aquaculture and Fisheries Management, 23:31-<br />
39.<br />
West, G. 1990. Methods <strong>of</strong> assessing ovarian development in fishes: A review. Aust. J. Mar. Freshwater Res. 41:199-222.
242<br />
Lake Malawi Fisheries Management Symposium - Proceedings<br />
The Effect <strong>of</strong> Feeding Density on Survival 0f African Cat Fish Clarias gariepinus<br />
H. K. Zidana & A.O. Maluwa<br />
National Aquaculture Centre, P.O. Box 44, DOMASI. Malawi. E:mail-nac@sdnp.org.mw<br />
Abstract<br />
Results on <strong>the</strong> study <strong>of</strong> <strong>the</strong> relationship between feeding density and survival <strong>of</strong> Clarias gariepinus fry are presented. This study was<br />
carried out at National Aquaculture Centre with <strong>the</strong> objective <strong>of</strong> finding out <strong>the</strong> optimum number <strong>of</strong> zooplankton that can improve <strong>the</strong><br />
survival <strong>of</strong> fry to fingerling stage. C. gariepinus, fry 4 days, old were stocked in 50 litre tanks for 30 days at a rate <strong>of</strong> 20 fry in each<br />
tank. Four zooplankton densities were used 5, 10 and 30 zooplankton/ml <strong>of</strong> water, <strong>the</strong> control was 0 zooplankton /ml <strong>of</strong> water. Each<br />
density was replicated 3 times and every 3 days <strong>the</strong> number <strong>of</strong> fish in each tank was counted. Highest survival rates (80%) were<br />
obtained from tanks in which <strong>the</strong> fish were fed 30 zooplankton/ml and <strong>the</strong>se were significantly different (P
Copepoda<br />
Figure 1. Zooplankton used in <strong>the</strong> feeding experiment.<br />
Table 1. The lay out <strong>of</strong> <strong>the</strong> experiment according to different feeding levels<br />
Tank1<br />
5 zooplankton/ml<br />
Tank2<br />
10 zooplankton/ml<br />
Tank3<br />
30 zooplankton/ml<br />
Tank4<br />
10 zooplankton/ml<br />
Tank5<br />
5 zooplankton/ml<br />
Tank6<br />
0 zooplankton/ml<br />
243<br />
Lake Malawi Fisheries Management Symposium - Proceedings<br />
Tank7<br />
30 zooplankton/ml<br />
Tank8<br />
0 zooplankton<br />
Tank9<br />
10 zooplankton/ml<br />
Tank10<br />
0 zooplankton/ml<br />
Tank11<br />
30 zooplankton<br />
Tank12<br />
5 zooplankton/ml<br />
Results and discussion<br />
After 30 days <strong>of</strong> carrying out <strong>the</strong> experiment, <strong>the</strong> results showed that fish fed with 30 zooplanktons/ml had 80%<br />
survival rate, fish fed with 10 zooplanktons had survival rate <strong>of</strong> 67%, fish fed with 5 zooplanktons had a survival <strong>of</strong><br />
50% and fish not fed with zooplankton had 0% survival rate.<br />
All <strong>the</strong> fish in <strong>the</strong> 0 zooplankton/ml were dead by <strong>the</strong> 15 th day <strong>of</strong> <strong>the</strong> experiment and <strong>the</strong> experiment continued with<br />
<strong>the</strong> o<strong>the</strong>r three feeding levels as shown in Figure 2.<br />
SURVIVAL RATE (%)<br />
100<br />
80<br />
60<br />
Cladocera Rotifer<br />
40<br />
30 Zpl/ml<br />
10 Zpl/ml<br />
20<br />
5 Zpl/ml<br />
0<br />
0 Zpl/ml<br />
6 9 12 15 18 21 24 27 30<br />
CULTURE PERIOD (DYS)<br />
Figure 2. The trend <strong>of</strong> survival rate % <strong>of</strong> African catfish fed different density <strong>of</strong> zooplankton/ml <strong>of</strong> water<br />
during <strong>the</strong> period <strong>of</strong> <strong>the</strong> experiment.<br />
The results showed that <strong>the</strong>re is a positive relationship between <strong>the</strong> zooplankton density and <strong>the</strong> survival rate <strong>of</strong> <strong>the</strong><br />
fry i.e. <strong>the</strong> higher <strong>the</strong> zooplankton density <strong>the</strong> higher <strong>the</strong> survival rate <strong>of</strong> fry. However <strong>the</strong> number <strong>of</strong> zooplankton<br />
can only be increased up to a certain point, if <strong>the</strong> number <strong>of</strong> zooplankton increases up to 50/ml all <strong>the</strong> fry were dead<br />
within 3 days <strong>of</strong> culture.
244<br />
Lake Malawi Fisheries Management Symposium - Proceedings<br />
Apart from <strong>the</strong> feed density o<strong>the</strong>r factors also contributed to <strong>the</strong> death <strong>of</strong> <strong>the</strong> fry in this trial. In 30 zooplankton/ml<br />
feeding density <strong>the</strong> death <strong>of</strong> fry was mainly contributed by <strong>the</strong> aggressive territorial behavior <strong>of</strong> <strong>the</strong> fry. This was<br />
also reported by Hetch and Applebaum (1988), in <strong>the</strong>ir trial apart from cannibalism death <strong>of</strong> fry was due to fatal<br />
aggressive territorial encounters between two or more individuals which is a common behavior in young Clarias<br />
gariepinus.<br />
The lowest survival rate was in <strong>the</strong> 0 zooplankton/ml density was due to starvation. There were evidences <strong>of</strong> type-1<br />
cannibalism during <strong>the</strong> first 7 days <strong>of</strong> culture and after that <strong>the</strong> fry were very weak so much and <strong>the</strong>y died due to<br />
starvation.<br />
The data analysis showed that <strong>the</strong>re is a significant difference (P < 0.05) in feeding <strong>the</strong> fish with 30 zooplankton/ml<br />
against all <strong>the</strong> feeding densities and that <strong>the</strong>re is no significant difference (P < 0.05) in feeding <strong>the</strong> fish with 5 and 10<br />
zooplankton/ml. However all <strong>the</strong> feeding densities were significantly different (P
245<br />
Lake Malawi Fisheries Management Symposium - Proceedings<br />
Determination <strong>of</strong> <strong>the</strong> time interval between <strong>the</strong> prime and resolving dosages <strong>of</strong><br />
Cyprinus carpio hormone dose to artificially induce Opsaridium microlepis to<br />
breed<br />
P. Kataya, H. Zidana & A.O. Maluwa<br />
National Aquaculture Centre, P.O. Box 44, Domasi, Malawi.<br />
Abstract<br />
The Results on <strong>the</strong> study <strong>of</strong> final oocyte maturation <strong>of</strong> Opsaridium microlepis, “ Mpasa”, in response to <strong>the</strong> first (prime) dose and <strong>the</strong><br />
second (resolving) dose <strong>of</strong> Cyprinus carpio pituitary gland are presented. The objective was to determine <strong>the</strong> optimum time interval<br />
between <strong>the</strong> prime and resolving dosages to induce ovulation in <strong>the</strong> fish. Mature broodstock <strong>of</strong> 250g, that were collected directly<br />
from <strong>the</strong>ir wild source, i.e. Linthipe River, were injected with C. carpio pituitary gland extract at <strong>the</strong> rate <strong>of</strong> 5mg/kg female body<br />
weight. This dose was split into two, <strong>the</strong> prime and <strong>the</strong> resolving dosages. The fish received 10% <strong>of</strong> <strong>the</strong> total dose as a prime and<br />
90% as <strong>the</strong> resolving dose, at three time intervals <strong>of</strong> 9, 12 and 15 hours separating <strong>the</strong> dosages. All fish ovulated when <strong>the</strong> time<br />
interval between <strong>the</strong> first and second injection was 12 hours. When <strong>the</strong> eggs were fertilized, hatchability was 76.6%. The fish did not<br />
ovulate when <strong>the</strong> resolving dosages were given at 9 and 15 hours. The results are discussed with reference to application <strong>of</strong> <strong>the</strong><br />
protocols developed in this study to produce mass fingerling <strong>of</strong> this species for aquaculture.<br />
Introduction<br />
Opsaridium microlepis locally known as ‘mpasa’ is endemic to Lake Malawi and it attains a weight <strong>of</strong> at least 2.5kg<br />
(Msiska 1990). The fish is commonly caught in <strong>the</strong> nor<strong>the</strong>rn and central regions <strong>of</strong> Malawi, where it ascends rivers<br />
like Songwe, Bua and Linthipe to breed in clear running water in <strong>the</strong> rivers. O. microlepis is an important<br />
commercial species <strong>of</strong> Lake Malawi. The fish fetches high prices on <strong>the</strong> market and this has led to its over<br />
exploitation and hence <strong>the</strong> catches from <strong>the</strong> wild have declined (Tweddle 1981 in Msiska 1990).<br />
Research on <strong>the</strong> suitability <strong>of</strong> indigenous cyprinids for aquaculture has not been done in detail, despite <strong>the</strong> fact that<br />
Malawi has cyprinids in <strong>the</strong> genera, Barbus, Labeo and Opsaridum (Maluwa et al. 1997). In o<strong>the</strong>r countries<br />
cyprinids have been farmed in aquaculture for <strong>the</strong>ir high value and export potential, for example <strong>the</strong> Norwegian<br />
Salmon and Rainbow trout.<br />
The National Aquaculture Centre is screening indigenous cyprinids for <strong>the</strong>ir suitability in aquaculture in Malawi and<br />
O. microlepis would be <strong>the</strong> most suited candidate for commercial aquaculture development in Malawi because <strong>of</strong> its<br />
large maximum body weight, high market value and demand.<br />
Initial studies on <strong>the</strong> Gonad Somatic Index (GSI) show that <strong>the</strong> breeding season for <strong>the</strong> species is between May and<br />
August. As a fish that migrates to breed in clear running waters in <strong>the</strong> river, O. microlepis require artificial induced<br />
breeding. Previous efforts to breed <strong>the</strong> fish did not succeed because <strong>the</strong> time interval between <strong>the</strong> prime and<br />
resolving dosages were unknown. The objective <strong>of</strong> this study was to determine <strong>the</strong> optimum time interval between<br />
<strong>the</strong> prime and resolving dosages that would induce ovulation in <strong>the</strong> fish.<br />
Materials and Methods<br />
This study was conducted in <strong>the</strong> hatchery at National Aquaculture Centre (NAC). Mature females and males, <strong>of</strong><br />
250g body-weight were collected from Linthipe river in <strong>the</strong> central region. The fish were collected during <strong>the</strong><br />
months <strong>of</strong> January – October, as <strong>the</strong>y migrated to breeding grounds. The fish were transported to NAC and after<br />
initial quarantine exercise in tanks <strong>the</strong>y were taken into hatchery for artificial induced breeding.<br />
The fish were given a dose <strong>of</strong> 5mg/kg body weight <strong>of</strong> C. carpio pituitary gland extract. Of this dose, 10% was given<br />
as a prime dose and <strong>the</strong> rest 90% was given as a resolving dose. The gland was removed from a donor C. carpio<br />
obtained from <strong>the</strong> farm at NAC. The treatments were <strong>the</strong> time interval between <strong>the</strong> prime and resolving dosages.<br />
There were 3 time intervals that were tested, which were, 9, 12 and 15 hrs. Each treatment was replicated 4 times.<br />
The males were given 50% <strong>of</strong> <strong>the</strong> female dosege i.e. 2.5mg/kg body weight only once, when <strong>the</strong> females were given<br />
<strong>the</strong> resolving dose.<br />
The oocyte maturation stages were determined by sampling <strong>the</strong> oocytes from <strong>the</strong> ovary by using a plastic tube, and<br />
<strong>the</strong>n observing oocytes under <strong>the</strong> stereoscopic microscope. In order to observe <strong>the</strong> nucleus <strong>of</strong> <strong>the</strong> oocytes, <strong>the</strong>y were<br />
placed in petri dish with Sera’s solution (60 % ethanol, 30 % formalin and 10% acetic acid). In maturing oocytes <strong>the</strong><br />
nucleus (Germinal Vesicle) migrates to <strong>the</strong> animal pole where it breaks and disappears in mature oocytes. This
246<br />
Lake Malawi Fisheries Management Symposium - Proceedings<br />
phenomenon known as geminal vesicle migration and break down was used as a biological indicator to determine<br />
<strong>the</strong> oocyte maturation stages as shown in<br />
Figure1: Discrimination on position <strong>of</strong> Germinal Vesicle in Oocytes with Sera’s solution<br />
When oocyte development processes are completed (vitellogenesis), <strong>the</strong> oocytes reach stage I <strong>of</strong> maturation, in<br />
which <strong>the</strong> germinal vesicle is at <strong>the</strong> center. The final oocyte maturation process follows <strong>the</strong> migration <strong>of</strong> <strong>the</strong><br />
germinal vesicle from <strong>the</strong> center to <strong>the</strong> animal pole, where it breaks down at stage V and <strong>the</strong> oocyte is ovulated into<br />
a fertilizable egg in stage VI. When <strong>the</strong> egg reaches stage VII, it is degenerated and hence not fertilizable. This<br />
phenomenon is known as over ripening. The injected brood stock were put in 500 litre conical tanks at a ratio <strong>of</strong> 1:1<br />
(Male:female). The fish were expected to ovulate within 18 hours at <strong>the</strong> incubation temperature <strong>of</strong> 26 0 C. After 18<br />
hours, <strong>the</strong> fish were stripped <strong>of</strong>f <strong>the</strong>ir eggs and artificially fertilized with sperm contained in milt that was stripped<br />
from <strong>the</strong> males. The fertilized eggs were incubated in zug jars in <strong>the</strong> laboratory at NAC. The incubation temperature<br />
was 26 0 C. The eggs hatched after 24 hours and hatchability was determined from <strong>the</strong> total number <strong>of</strong> fertilized eggs<br />
and that number which hatched.<br />
Results<br />
All <strong>the</strong> fish that were given <strong>the</strong> second resolving dose 9 hrs and 15 hrs after <strong>the</strong> prime dose did not ovulate. The<br />
oocytes in fish given <strong>the</strong> resolving dose at 9 hours passed through <strong>the</strong> stages <strong>of</strong> oocyte maturation and degenerated<br />
in stage VII. These eggs did not hatch when fertilized. The fish that were given a resolving dose 15 hours after <strong>the</strong><br />
prime dose, <strong>the</strong>ir oocytes never matured beyond stage IV, i.e. <strong>the</strong> oocyte maturation processes were arrested at stage<br />
IV. These eggs when stripped and fertilized after 18 hours, did not hatch. Ovulation at stage VI occurred when <strong>the</strong><br />
fish were given a resolving dose 12 hours after <strong>the</strong> prime dose. These eggs when stripped were fertilizable and<br />
hatched after 24 hours <strong>of</strong> incubation. The hatchability rate was 76.6%. The relationship between time intervals,<br />
number <strong>of</strong> eggs stripped, fertilization and hatchability rates is shown in Table 1.<br />
Table 1: The relationship between time interval separating <strong>the</strong> prime and resolving dosages and number<br />
<strong>of</strong> eggs produced and fertilization and hatchability rates.<br />
Time Interval (Hours) Eggs Produced Fertilization rate (%) Hatchability (%)<br />
9<br />
12<br />
15<br />
6,500<br />
6,994<br />
6,000<br />
There was no significant difference in <strong>the</strong> number <strong>of</strong> eggs stripped across <strong>the</strong> three time intervals. However, <strong>the</strong> 12<br />
hour interval gave significantly (P< 0.01) higher rate <strong>of</strong> fertilized eggs and hatchability (Table 1).<br />
0<br />
84<br />
0<br />
0<br />
76.6<br />
0
247<br />
Lake Malawi Fisheries Management Symposium - Proceedings<br />
Discussion<br />
Most <strong>of</strong> <strong>the</strong> work on induced breeding <strong>of</strong> cyprinids, show that <strong>the</strong> fish require two injections, i.e. <strong>the</strong> prime and<br />
resolving dosages. The prime dose is used to induce final oocyte maturation and <strong>the</strong> second dose to induce<br />
ovulation. Similar work on cyprinids with <strong>the</strong> Indian major carps, <strong>the</strong> time period between <strong>the</strong> prime and resolving<br />
dosages was 6 hours. The priming dose was 20% and <strong>the</strong> resolving dose was 80%. With <strong>the</strong>se dosages and times,<br />
spawning was expected 4 to 6 hours after <strong>the</strong> resolving dose (Pullin and Jhingran 1985). The results in this trial<br />
show that O. microlepis has lower priming dose <strong>of</strong> 10% and higher resolving dose <strong>of</strong> 90%. In addition O. microlepis<br />
has a longer oocyte maturation period (18 hours).<br />
Having defined <strong>the</strong> right time interval for <strong>the</strong> fish to breed successfully, fur<strong>the</strong>r work is underway to establish <strong>the</strong><br />
production <strong>of</strong> mass fingerlings using <strong>the</strong> protocols developed in this study.<br />
Acknowledgements<br />
This work forms part <strong>of</strong> <strong>the</strong> JICA Aquaculture Project activities at <strong>the</strong> National Aquaculture Centre. The project was<br />
jointly funded by <strong>the</strong> Malawian and Japanese Governments.<br />
References<br />
Maluwa, A. O., Kamakura, M & Sakai, K. 1997. Induced Maturation and Ovulation <strong>of</strong> Grass Carp (Ctenopharygodon idellus). In<br />
<strong>proceedings</strong> <strong>of</strong> <strong>the</strong> first Regional Workshop on Aquaculture, Bunda College <strong>of</strong> agriculture, Lilongwe, Malawi.<br />
1997:86-92.<br />
Msiska, O.V. 1990. Reproductive Strategies <strong>of</strong> two cyprinid fishes in Lake Malawi and <strong>the</strong>ir relevance for aquaculture<br />
development. In aquaculture and Fisheries Management 1990, 21, 67-75.<br />
Msiska, O. V. 1991. Induced spawning and Early growth <strong>of</strong> Mpasa (Opsaridium microlepis) and Ntchila (Labeo mesops) in tanks<br />
and ear<strong>the</strong>rn ponds. In Aquaculture Research in Africa, Pudoc Wagenigeni,:P 159-168.<br />
Pullin, R. S. V & Jhingran, V.G.1985. A hatchery manual for <strong>the</strong> common, Chinese and Indian major carps. ICLARM studies<br />
and Reviews 11, 191 p. Asian Development Bank, Manila, Phillipines and International Centre for Living Aquatic<br />
Resources Management, Manila, Phillipines.<br />
Tweddle, D. 1987. An Assesment <strong>of</strong> <strong>the</strong> Growth Rate <strong>of</strong> Mpasa, Opsaridium miclolepis, by length frequency analysis. In Journal<br />
<strong>of</strong> Limnology Society Sou<strong>the</strong>rn Africa 13(2), 52-57.
248<br />
Lake Malawi Fisheries Management Symposium - Proceedings<br />
Determination <strong>of</strong> biological reference points for Lake Malawi cichlids<br />
Anthony J. Booth<br />
Department <strong>of</strong> Ichthyology and Fisheries Science, Rhodes University, P.O. Box 94 Grahamstown 6140, SOUTH AFRICA Email:<br />
t.booth@ru.ac.za<br />
Abstract<br />
Biological reference points (BRPs) - values that represent <strong>the</strong> state <strong>of</strong> a fishery or population - are commonly used to guide<br />
<strong>management</strong> decisions. BRPs are expressed as a function <strong>of</strong> fishing mortality and are derived from models that describe <strong>the</strong><br />
population dynamics <strong>of</strong> a resource. These models include dynamic pool, spawner-recruit and production models. Unfortunately, in<br />
<strong>the</strong> absence <strong>of</strong> long-term <strong>fisheries</strong> data, such as abundance indices and catches-at-age, it is only dynamic pool models, usually<br />
known as yield-per-recruit and spawner biomass-per-recruit models, that are known with any degree <strong>of</strong> certainty. BRPs that have<br />
been proposed in <strong>the</strong> literature have been calculated for temperate demersal marine species with life-history characteristics that<br />
include high fecundity, pelagic spawning and little or no parental care. In contrast, cichlids have low fecundities and exhibit varying<br />
levels <strong>of</strong> parental care ranging from guarding to mouthbrooding. Cichlid specific BRPs, calculated with combinations <strong>of</strong> two<br />
spawner-recruit relationships within deterministic and stochastic frameworks, were shown to be highly dependent on <strong>the</strong> degree <strong>of</strong><br />
density-dependence in <strong>the</strong> spawner-recruit relationship. Overall, cichlid specific BRPs were similar to than temperate groundfish<br />
species and it is suggested that fishing mortality be maintained at no more than that required to reduce spawner biomass-per-recruit<br />
to 40% <strong>of</strong> pristine levels if <strong>the</strong> form <strong>of</strong> <strong>the</strong> spawner-recruit relationship is unknown. If a Beverton-Holt spanwer-recruit relationship is<br />
assumed, a biologically plausible relationship given cichlid life-histories, <strong>the</strong>n it is suggested that spawner biomass-per-recruit is not<br />
reduced below 50% <strong>of</strong> unfished levels.<br />
Introduction<br />
Biological reference points (BRPs) are commonly used to guide <strong>management</strong> decisions. BRPs are values that<br />
represent <strong>the</strong> state <strong>of</strong> a resource and whose characteristics are believed to be useful for <strong>the</strong> <strong>management</strong> <strong>of</strong> a unit<br />
stock through <strong>the</strong> provision <strong>of</strong> information regarding its status relative to an acceptable value or range (Caddy and<br />
Mahon, 1995). There is also a need by <strong>management</strong> to quantify potential long-term trade-<strong>of</strong>fs between maximising<br />
yield, ei<strong>the</strong>r by mass or economic gain, while limiting <strong>the</strong> risk <strong>of</strong> possible reproductive failure. Applying a constant<br />
fishing mortality to maximise yield i.e., FMSY, would clearly be advantageous, however, knowledge <strong>of</strong> <strong>the</strong> biomass<br />
required to achieve MSY is difficult to determine, principally because <strong>of</strong> <strong>the</strong> lack <strong>of</strong> information on <strong>the</strong> functional<br />
form <strong>of</strong> <strong>the</strong> spawner-recruit relationship, hampering understanding <strong>of</strong> <strong>the</strong> biomass-production relationship<br />
(Sissenwine and Shepherd, 1987; Clark, 1991).<br />
BRPs are most <strong>of</strong>ten expressed as a function <strong>of</strong> fishing mortality and are derived from models that describe <strong>the</strong><br />
population dynamics <strong>of</strong> a resource. These interrelated models include dynamic pool, spawner-recruit and<br />
production models. For a graphical illustration see Sissenwine and Shepherd (1987). Unfortunately, in <strong>the</strong> absence<br />
<strong>of</strong> data, which is usually <strong>the</strong> case for most <strong>fisheries</strong> including those that are cichlid dominated, only <strong>the</strong> dynamic<br />
pool models, <strong>of</strong>ten termed as yield-per-recruit and spawner biomass-per-recruit, are known with any degree <strong>of</strong><br />
certainty. Quantifying and understanding <strong>the</strong> spawner-recruit relationship and <strong>the</strong> productivity <strong>of</strong> <strong>the</strong> resource at<br />
various abundances is, <strong>the</strong>refore, imperative.<br />
BRPs that have been proposed in <strong>the</strong> literature have been calculated for temperate marine species with life-history<br />
characteristics that include high fecundity, pelagic spawning and little or no parental care (Clarke, 1991; 1993; Mace<br />
1994). In contrast, cichlids have relatively low fecundities and have various levels <strong>of</strong> parental care ranging from<br />
guarding to mouth brooding (Lowe, 1959; Trewavas, 1983). Could BRPs be similar for two groups <strong>of</strong> fishes with<br />
different life-history characteristics? This study provides <strong>the</strong> first quantitative examination into <strong>the</strong> relationships<br />
between yield and spawner biomass-per-recruit for a wide variety <strong>of</strong> cichlid specific life-history parameters, in an<br />
attempt to propose BRPs that would be beneficial for <strong>management</strong>.<br />
Materials and methods<br />
Modelling framework<br />
A two-phase age-structured modeling framework was developed. Firstly, a deterministic model incorporating a<br />
stock-recruit (S-R) relationship was used to estimate instantaneous rates <strong>of</strong> fishing mortality (F) required to achieve<br />
several BRPs. The procedure was based on those outlined by Sissenwine and Shepherd (1987) and Clarke (1991).<br />
The second phase included a stochastic extension to test <strong>the</strong> robustness <strong>of</strong> <strong>the</strong> BRPs and to assess <strong>the</strong> trade-<strong>of</strong>fs<br />
between yield and spawner biomass, and <strong>the</strong> potential risk <strong>of</strong> reproductive failure.
249<br />
Lake Malawi Fisheries Management Symposium - Proceedings<br />
The stochastic model was similar to <strong>the</strong> deterministic model but incorporated recruitment variability and simulated<br />
an age-structured population that was fished at <strong>the</strong> desired fishing mortality necessary to achieve <strong>the</strong> desired BRP.<br />
2<br />
ε −σ<br />
/ 2<br />
2<br />
Age-structure within <strong>the</strong> population was estimated with stochastic recruitment R = e with ε ~ N ( 0,<br />
σ ) .<br />
2<br />
−σ<br />
/ 2<br />
The constant e ensured that E [ R]<br />
= 1.<br />
Age-structure was estimated by projecting <strong>the</strong> population forward by<br />
20 years at <strong>the</strong> required fishing mortality rate. This “burn-in” period provided <strong>the</strong> initial age structure for a 50-year<br />
projection at <strong>the</strong> required fishing intensity. It was assumed that a CV <strong>of</strong> 0.4 was sufficient for <strong>the</strong> recruitment<br />
variability such that σ ≈ CV = 0.<br />
4 . Error was assumed to occur in <strong>the</strong> BRP determination (for reasons such as<br />
sampling and ageing errors) such that F = Fˆ<br />
BRP e where FBRP ˆ is <strong>the</strong> predicted BRP fishing mortality and<br />
2<br />
ε ~ N(<br />
0,<br />
0.<br />
1 ) . A total <strong>of</strong> 100 50-year simulations were conducted.<br />
0. 1<br />
2<br />
2<br />
ε −<br />
Dynamic pool models<br />
Two dynamic pool models, yield-per-recruit and spawner biomass-per-recruit as functions <strong>of</strong> fishing mortality F,<br />
were calculated as<br />
where wa is <strong>the</strong> mass at age a, Sa is <strong>the</strong> selectivity for age class a, Ma is <strong>the</strong> rate <strong>of</strong> natural mortality at age a, ψa <strong>the</strong><br />
maturity-at-age a and max is <strong>the</strong> maximum recorded age and is considered a lumped-plus group. A time step <strong>of</strong> one<br />
month (∆a) was used in <strong>the</strong> simulations.<br />
The relative proportion <strong>of</strong> fish at age a ( N a<br />
~ ) was expressed as recursively as<br />
~<br />
N<br />
a<br />
Weight-at-age was described as [ ( ) ] ω −Ka<br />
Wa<br />
ψ L∞<br />
− e<br />
selection-at-age (Sa) and maturity-at-age (ψa) was estimated by a logistic <strong>of</strong> <strong>the</strong> form ( ) 1<br />
−(<br />
a−a50<br />
) / δ −<br />
= 1 where ψ and ω describe <strong>the</strong> length-weight relationship,<br />
P a = 1+<br />
e<br />
where<br />
Pa is <strong>the</strong> proportion selected/mature at age a, a50 <strong>the</strong> age-at-(50%) selection/maturity and δ <strong>the</strong> steepness <strong>of</strong> <strong>the</strong><br />
ogive.<br />
Spawner-recruit models<br />
The Beverton-Holt (1957) and Ricker (1954) stock-recruit (S-R) curves are expressed as ( ) 1 −<br />
R<br />
YPR<br />
⎧<br />
⎪ R = 1<br />
⎪ ~<br />
= ⎨ N a−1e<br />
⎪ ~<br />
N a−1e<br />
⎪ −<br />
⎩ 1−<br />
e<br />
α′<br />
Se<br />
F<br />
=<br />
−FS<br />
−FS<br />
FS<br />
max<br />
∑<br />
a=<br />
0<br />
a−1<br />
a−1<br />
max<br />
⎡ ~<br />
⎢wa<br />
N<br />
⎣<br />
−M<br />
−M<br />
−M<br />
a = 0<br />
0 < a < max<br />
a = max<br />
( 1−<br />
e<br />
−S<br />
F −M<br />
R = S α + βS<br />
and<br />
−β<br />
′ S<br />
= , respectively where α ,α′ , β and β ′ determine <strong>the</strong> shape <strong>of</strong> <strong>the</strong> curves, R is <strong>the</strong> predicted<br />
recruitment at a specified level <strong>of</strong> spawner biomass S.<br />
a<br />
Sa<br />
F<br />
S F + M<br />
a<br />
a<br />
a [<br />
a<br />
⎤<br />
) ⎥∆a<br />
⎦<br />
~<br />
w N ] ∆a<br />
Both S-R curves were reparameterised as a function <strong>of</strong> a “steepness” parameter h , which expresses that fraction <strong>of</strong><br />
pristine recruitment (R0) when spawner biomass (S0) is reduced to θ % <strong>of</strong> pristine levels, such that hR0 = f ( θS0<br />
)<br />
where f (⋅)<br />
is <strong>the</strong> S-R curve <strong>of</strong> interest (Figure 1). This formulation reduces valid portion <strong>of</strong> <strong>the</strong> S-R curve between<br />
<strong>the</strong> origin and <strong>the</strong> replacement point (S0, R0). The “steepness” parameterisation was originally proposed by Mace and<br />
Doonan (1988) but most commonly ascribed to Francis (1992).<br />
SBR<br />
max<br />
F = ∑<br />
a=<br />
0<br />
a<br />
a
250<br />
Lake Malawi Fisheries Management Symposium - Proceedings<br />
Figure 1. Relationship between recruitment and spawner biomass to <strong>the</strong> replacement line that joins <strong>the</strong><br />
points (0,0) and (R0, S0) and can be used to reparameterise <strong>the</strong> spawner-recruit relationship to a single<br />
“steepness” parameter h. The “steepness” parameter h expresses <strong>the</strong> fraction <strong>of</strong> pristine recruits when<br />
spawner biomass is reduced to θ% <strong>of</strong> pristine levels. In this scenario θ = 0.2. The solid lines are <strong>the</strong><br />
Ricker and <strong>the</strong> dotted lines <strong>the</strong> Beverton-Holt curves used in <strong>the</strong> analysis.<br />
When <strong>the</strong> S-R shape parameters are simultaneously estimated <strong>the</strong>n<br />
θS0<br />
( 1−<br />
h)<br />
α =<br />
hR ( 1−θ<br />
)<br />
0<br />
α θ<br />
,<br />
h −θ<br />
β =<br />
hR0<br />
( 1−θ<br />
)<br />
for <strong>the</strong> Beverton-Holt curve, and<br />
θ ⎡ ⎛ hS ⎞ ⎤<br />
0 R)<br />
ln( hθ<br />
)<br />
′ = exp⎢ln<br />
⎜<br />
⎟ /( 1−θ<br />
) ⎥ , β ′ = for <strong>the</strong> Ricker curve.<br />
⎣ ⎝ θS0R<br />
⎠ ⎦ S0<br />
( 1−θ<br />
)<br />
When h = 0.2, <strong>the</strong> replacement line in Figure (1), <strong>the</strong>n <strong>the</strong> equations for <strong>the</strong> Beverton-Holt curve reduce to <strong>the</strong><br />
S0 ( 1−<br />
h)<br />
familiar =<br />
4hR0<br />
θ<br />
5h<br />
−1<br />
α , β = . For <strong>the</strong> purposes <strong>of</strong> this study, pristine recruitment was set to unity, and<br />
4hR0<br />
<strong>the</strong>refore, in <strong>the</strong> S-R model pristine biomass (S0) was replaced by unexploited spawner-biomass per-recruit (SBR0).<br />
As recruitment was estimated from a per-recruit perspective, equilibrium spawner biomass as a function <strong>of</strong> fishing<br />
SBRF<br />
−α<br />
ln( α′<br />
SBRF<br />
)<br />
mortality F was calculated as S * =<br />
for <strong>the</strong> Beverton-Holt and S* =<br />
for <strong>the</strong> Ricker<br />
β ′<br />
β ′<br />
curves. Equilibrium recruitment * R was estimated by substituting S* into <strong>the</strong> relevant S-R curves (Figure 5).<br />
Production model<br />
Equilibrium yield as function <strong>of</strong> spawner biomass or spawner biomass-per-recruit was calculated as Y* = YPRF<br />
R*<br />
because spawner biomass-per-recruit was calculated as a function <strong>of</strong> fishing mortality F. Yield as a function <strong>of</strong><br />
spawner biomass or spawner biomass-per-recruit was obtained by iteratively solving for a specific fishing mortality<br />
required to reduce <strong>the</strong> spawner biomass or spawner biomass-per-recruit to <strong>the</strong> desired level.
251<br />
Lake Malawi Fisheries Management Symposium - Proceedings<br />
Parameter estimates used in <strong>the</strong> simulations<br />
A review <strong>of</strong> <strong>the</strong> cichlid literature summarizing trends between growth, maturity and natural mortality is illustrated in<br />
Figure 2. Growth and mortality data were selected from studies that aged fish with hard tissues such scales and<br />
otoliths, with natural mortality calculated using Hoenig’s (1983) empirical formula that relates mortality as a<br />
function <strong>of</strong> maximum age where ln( M ) = 1.44 - 0.982ln( max)<br />
. Length frequency methods <strong>of</strong> ageing are<br />
fraught with error because cichlids are long lived and <strong>the</strong>ir growth zones <strong>of</strong>ten stack in <strong>the</strong>ir otoliths (Booth et al.,<br />
1995; Booth and Merron, 1996; Weyl and Hecht, 1998) decreasing age estimates <strong>of</strong> old fish. Length frequency<br />
analysis, <strong>the</strong>refore, over-estimates <strong>the</strong> growth co-efficient <strong>of</strong> <strong>the</strong> von Bertalanffy growth equation and introduces<br />
substantial errors into <strong>the</strong> commonly used Pauly’s (1980) estimate <strong>of</strong> natural mortality. It was assumed that Hoenig’s<br />
formula was most suitable for cichlid species because <strong>of</strong> life-history characteristics such as longevity, low fecundity<br />
and parental care. The regression results <strong>of</strong> natural mortality vs <strong>the</strong> growth co-efficient was unfortunately weak,<br />
only explaining 16% <strong>of</strong> <strong>the</strong> variation, but illustrates a slight negative correlation between M and K.<br />
Based on <strong>the</strong> regression equations in Figure 2, and <strong>the</strong> average growth co-efficient from <strong>the</strong> literature cited in Figure<br />
2, parameter estimates used in <strong>the</strong> base-case simulations are L∞ = 200 mm, K = 0.38 .yr -1 , ψ = 0.01 mm, ω = 3 .yr -<br />
1 -1<br />
, M = 0.45 .yr , ψ 50 = S50 = 2.16 yrs, and δψ = δS = 0.25 .yr -1 . A base-case scenario assumed that both <strong>the</strong> maturity<br />
and selectivity schedules coincided, whereas an alternative scenario, closely resembling most cichlid harvesting<br />
gears, assessed selection by <strong>the</strong> fishing gear one year prior to maturity i.e., ψ 50 = 1.16 yrs.<br />
Selection <strong>of</strong> values that determine maximum <strong>the</strong>oretical length and <strong>the</strong> length weight parameters are essentially<br />
arbitrary, provided that growth in weight is (close to) isometric to length. The most influential parameters are,<br />
<strong>the</strong>refore, <strong>the</strong> ratio <strong>of</strong> K to M and <strong>the</strong> ratio between selectivity and maturity. A maximum age <strong>of</strong> 10 years was<br />
considered sufficient as a plus group and had little effect on <strong>the</strong> analyses.<br />
Figure 2. Relationships between length-at-maturity ( 50<br />
ψ ) and maximum length (L∞) (top panel), and<br />
natural mortality (M) based on maximum age (max) and Brody’s growth coefficient (K) (lower panel).<br />
Lines represent linear regression and <strong>the</strong>ir 95% confidence intervals. Data from Bruton and Allanson<br />
(1974), Bruton and Boltt (1975), Tweddle and Turner (1977), Hecht (1980), Van der Waal (1985), Booth<br />
et al. (1995), Booth and Merron (1996), Jambo, (1997) and Weyl and Hecht (1998).
252<br />
Lake Malawi Fisheries Management Symposium - Proceedings<br />
The S-R curve reparameterisation expresses relative recruitment as a function <strong>of</strong> relative spawning biomass, both<br />
measured relative to unfished levels, and described by <strong>the</strong> “steepness” parameter θ. The value <strong>of</strong> <strong>the</strong> “steepness”<br />
parameter determines <strong>the</strong> potential for density-dependent increases in specific reproductive rate – <strong>the</strong> relative<br />
increase in recruits per unit spawning biomass. Three curves were estimated corresponding to relative increases in<br />
reproductive rate <strong>of</strong> 4, 8 and 16 times. Essentially when spawner biomass is reduced to extremely low levels<br />
spawning is 4 - 16 times more successful. Clarke (1991) argued that this range is acceptable as it covers <strong>the</strong><br />
extremes <strong>of</strong> most known S-R relationships, albeit for temperate groundfish species. The values <strong>of</strong> h, when θ = 0.2,<br />
were estimated as 0.749, 1.249, 2.070 for <strong>the</strong> Ricker and 0.566, 0.711, 0.823 for <strong>the</strong> Beverton-Holt S-R curves.<br />
These values were estimated by setting θ = 1×10 -5 and h = 4 – 16 times θ and solving for <strong>the</strong> fishing mortality that<br />
would result in extinction, i.e., R = 0. The resultant extinction F estimates are used to recalculate h when θ = 0.2, a<br />
commonly used value for this parameter used in meta-analysis <strong>of</strong> stock-recruit data for stock assessments (Myers et<br />
al., 1985).<br />
Estimation <strong>of</strong> biological reference points<br />
Various commonly used BRPs were calculated in this study. These were FMAX (that fishing mortality that maximise<br />
yield-per-recruit in <strong>the</strong> absence <strong>of</strong> a S-R relationship), F0.1 (that fishing mortality that is 10% <strong>of</strong> <strong>the</strong> slope <strong>of</strong> <strong>the</strong><br />
yield-per-recruit curve at <strong>the</strong> origin in <strong>the</strong> absence <strong>of</strong> a S-R relationship) (Gulland and Boerema, 1973), FSB40 (that<br />
fishing mortality that reduces spawner biomass-per-recruit to 40% <strong>of</strong> unfished levels in <strong>the</strong> absence <strong>of</strong> a S-R<br />
relationship) and FMMY (that fishing mortality that is <strong>the</strong> maximum <strong>of</strong> all minimum yields given <strong>the</strong> predetermined S-<br />
R relationships) (Clarke 1991).<br />
During <strong>the</strong> stochastic simulations, cumulative catch over <strong>the</strong> simulation period, depletion (spawner biomass as a<br />
fraction <strong>of</strong> pristine levels) at <strong>the</strong> end <strong>of</strong> <strong>the</strong> 50-year simulation, <strong>the</strong> lowest deletion during <strong>the</strong> simulation and <strong>the</strong><br />
number <strong>of</strong> times depletion was reduced below 20% were noted.<br />
Results<br />
Typical per-recruit effects can be noticed in Figures 3 and 4 (top left panels) with relative yield-per-recruit<br />
increasing quicker if fish are harvested before sexual maturity. Similarly, spawner biomass-per-recruit decreased<br />
more rapidly with small increases in fishing mortality in <strong>the</strong> second scenario with earlier gear selection.<br />
The relationship between spawner biomass-per-recruit and yield provides a proxy strategy to <strong>the</strong> spawner biomass<br />
approach (Figures 3 and 4 - bottom panels). If spawner biomass-per-recruit was dropped with <strong>the</strong> range <strong>of</strong> 20-60%<br />
<strong>of</strong> unfished levels, at least 75% <strong>of</strong> MSY was realised. In contrast to spawner biomass, relative yield as a function <strong>of</strong><br />
relative spawner biomass per recruit was more strongly dependent on <strong>the</strong> choice <strong>of</strong> S-R curve. The maximum <strong>of</strong> <strong>the</strong><br />
minimum yields - FMMY – suggests that at least 75% <strong>of</strong> MSY can be attained if spawner biomass-per-recruit was not<br />
depleted below 20 and 60% <strong>of</strong> unfished levels.
253<br />
Lake Malawi Fisheries Management Symposium - Proceedings<br />
Figure 3. Per-recruit and yield for a typical cichlid fish that with co-incidental gear selection and maturity<br />
schedules. The solid lines are <strong>the</strong> Ricker and <strong>the</strong> dotted lines <strong>the</strong> Beverton-Holt curves.
254<br />
Lake Malawi Fisheries Management Symposium - Proceedings<br />
Figure 4. Per-recruit and yield for a typical cichlid fish that with selection by <strong>the</strong> fishing gear occurring 1<br />
years prior to maturity. The solid lines are <strong>the</strong> Ricker and <strong>the</strong> dotted lines <strong>the</strong> Beverton-Holt curves.
255<br />
Lake Malawi Fisheries Management Symposium - Proceedings<br />
Figure 5. Mean and standard deviation <strong>of</strong> 100 simulations <strong>of</strong> four <strong>management</strong> quantities to assess <strong>the</strong><br />
robustness <strong>of</strong> four biological reference points to two scenarios <strong>of</strong> life-history parameters and fishery<br />
characteristics. Cumulative catch is expressed as <strong>the</strong> fraction <strong>of</strong> <strong>the</strong> highest mean value for all biological<br />
reference points.
256<br />
Lake Malawi Fisheries Management Symposium - Proceedings<br />
The F0.1 and FSB40 BRPs were similar, estimated between 0.43 and 0.46.yr -1 for <strong>the</strong> base-case scenario and between<br />
0.28 .yr -1 and 0.32 .yr -1 when fish are exposed to fishing pressure prior to maturity. FMAX was consistently <strong>the</strong><br />
highest BRP estimated, ranging between 0.53 .yr -1 and 1.16 .yr -1 . Spawner biomass-per-recruit was reduced <strong>the</strong> most<br />
with <strong>the</strong> FMAX BRP. FMMY had intermediate values to <strong>the</strong> o<strong>the</strong>r BRPs ranging between 0.59 for <strong>the</strong> base case scenario<br />
and 0.35 .yr -1 in <strong>the</strong> lower selection scenario. Both FMMY BRPs reduced spawner biomass-per-recruit to ~32% <strong>of</strong><br />
unfished levels. As fish are selected later into <strong>the</strong> fishery fishing mortalities required to harvest <strong>the</strong> resource at levels<br />
approaching MSY were increased due to per-recruit effects where a “reserve” <strong>of</strong> spawner biomass-per-recruit was<br />
unfished, <strong>the</strong>reby reducing extinction at higher levels <strong>of</strong> fishing mortality.<br />
Results from <strong>the</strong> stochastic trials were not unexpected (Figure 5). Fishing <strong>the</strong> FMAX strategy resulted in slightly<br />
higher yields at <strong>the</strong> expense <strong>of</strong> reducing spawner biomass to <strong>the</strong> lowest levels. In contrast <strong>the</strong> FSB40 and F0.1<br />
strategies maintained spawner biomass at <strong>the</strong> expenses <strong>of</strong> ~10% <strong>of</strong> maximum yield. FMMY was intermediate and<br />
achieved 95% <strong>of</strong> MSY while maintaining spawner biomass above 35% <strong>of</strong> pristine levels. The number <strong>of</strong> simulations<br />
where spawner biomass dropped below 20% - effectively <strong>the</strong> risk <strong>of</strong> possible recruitment failure - was <strong>the</strong> highest<br />
for FMAX and lowest for <strong>the</strong> FSB40 and F0.1 BRPs.<br />
Discussion<br />
Fisheries dominated by one or more cichlid species are common in tropical and subtropical Africa, Central and<br />
South Americas. Cichlids also dominate Sri Lanka freshwater catches since <strong>the</strong> introduction <strong>of</strong> Oreochromis<br />
mossambicus and O. niloticus (De Silva, 1988). Gears utilised are varied and range from mosquito meshing to<br />
harvest juveniles and “fry”, hook and line and different net configurations. With <strong>the</strong> exception <strong>of</strong> size-selective<br />
gillnets, fish are usually harvested prior to sexual maturity as fish are usually caught for subsistence or marketed by<br />
number ra<strong>the</strong>r than mass (Weyl and Booth, unpublished data). Management is at best ad hoc, with most <strong>fisheries</strong> in<br />
an overfished state with catches and catch-rates dropped steadily over time (Pálsson et al., 1999; Ogutu-Owayo,<br />
1990).<br />
Lake Malawi is no exception. Chambo, a complex comprising four economically and socially important<br />
Oreochromis species, has dominated landings. Unfortunately <strong>the</strong>se stocks are considered to heavily depleted with<br />
large fish rarely seen in catches and catch rates at all-time low levels (Pálsson et al., 1999). Effort has now been<br />
shifted onto less utilised pelagic cichlid resources. Management intervention is urgently required.<br />
Cichlid life-history patterns are complex and have evolved in various habitats differing in biotic and abiotic<br />
variability. Overall, cichlids are considered K-selected as <strong>the</strong>y have a high longevity, lay relatively few but large<br />
eggs, exhibit parental care and mature at a high fraction <strong>of</strong> <strong>the</strong>ir maximum length (Bruton, 1989). Parental care has<br />
been shown to resolve taxonomic issues as Saro<strong>the</strong>rodon spp. are paternal mouthbrooders, Oreochromis spp.<br />
mouthbrood, and Tilapia spp. are guarders (Trewavas, 1983). All cichlid genera in Lake Malawi, with <strong>the</strong> exception<br />
<strong>of</strong> Serranochromis and Tilapia, are considered to be maternal mouthbrooders. Nests <strong>of</strong> those species residing on<br />
unconsolidated sediments are usually constructed within a lek (McKaye, 1984).<br />
O<strong>the</strong>r aspects relating to <strong>the</strong> interaction between cichlid life-histories and <strong>the</strong> characteristics <strong>of</strong> <strong>the</strong>ir harvesting<br />
<strong>fisheries</strong> are that maturity and gear selectivity schedules rarely co-incide and that natural mortality is, deduced from<br />
o<strong>the</strong>r life-history traits, probably density dependent. Considering <strong>the</strong> dependence on suitable inshore habitats for<br />
juveniles and space required for elaborate nest building, fish are easily targeted and spawning habitat destroyed by<br />
gears such as large seine nets. Lake Malawi cichlids are also highly habitat specific. All <strong>of</strong> <strong>the</strong>se factors have<br />
<strong>management</strong> implications.<br />
It would appear that BRPs based on groundfish life histories (Clarke 1991; 1993; Mace; Thompson) are similar to<br />
those <strong>of</strong> cichlids. The stochastic trials, however, suggested that <strong>the</strong> deterministic BRPs were too low and prompted<br />
<strong>the</strong> need for a slightly more conservative approach in selecting for suitable spawner biomass–per-recruit level to<br />
sustain a fishery indefinitely. Conserving more spawner biomass-per-recruit would have a marginal difference in<br />
yield.<br />
Two <strong>management</strong> strategies emerged from <strong>the</strong> analysis. If spawner biomass can be estimated and <strong>the</strong>n maintained<br />
between 30 - 60% <strong>of</strong> unfished levels <strong>the</strong>n surplus production can be safely harvested. Alternatively, spawner<br />
biomass-per-recruit should be maintained at levels <strong>of</strong> >40%. The broad summit between relative yield and relative<br />
spawner biomass suggests that a biomass based strategy would be <strong>the</strong> most suitable than one based on <strong>the</strong> regulation<br />
<strong>of</strong> fishing mortality. At least 75% <strong>of</strong> MSY can be attained by simply maintaining <strong>the</strong> spawner biomass in <strong>the</strong> range <strong>of</strong>
257<br />
Lake Malawi Fisheries Management Symposium - Proceedings<br />
30-50% <strong>of</strong> pristine levels without increasing <strong>the</strong> risk <strong>of</strong> recruitment failure beyond an unacceptable limit.<br />
Unfortunately, for cichlid directed <strong>fisheries</strong>, <strong>the</strong> second option is <strong>the</strong> most feasible prompting an investigation into a<br />
suitable S-R curve to fine-tune BRP recommendations.<br />
The Beverton-Holt (1957) S-R curve is probably <strong>the</strong> most biologically plausible in a cichlid context. The derivation<br />
<strong>of</strong> <strong>the</strong> curve assumes that juvenile competition leads to linearly dependent mortality rate relative <strong>the</strong> number <strong>of</strong> fish<br />
alive in <strong>the</strong> cohort at any point in time. When <strong>the</strong> cohort grows in number <strong>the</strong>n individuals will disappear faster. If<br />
fecundity remains constant <strong>the</strong>n <strong>the</strong>re will be compensation, i.e., recruits per spawner decrease as a function <strong>of</strong> <strong>the</strong><br />
number <strong>of</strong> spawners. The net result is a plateau in recruits per spawner. This model has also been shown to<br />
approximate situations with territorial interactions, disruption <strong>of</strong> nesting, gradation in habitat suitability for nesting<br />
and juvenile survival, and competition for food or space (Hilborn and Walters, 1992).<br />
Figure 6. Relative yield as a function <strong>of</strong> relative spawner biomass per recruit for a typical cichlid fish given<br />
that harvesting occurs prior to sexual maturity. The maximin yield is illustrated for all <strong>the</strong> spawner-recruit<br />
curves and only <strong>the</strong> Beverton-Holt curves. The solid lines are <strong>the</strong> Ricker and <strong>the</strong> dotted lines <strong>the</strong><br />
Beverton-Holt curves.<br />
Consider cichlid reproduction from a simplified perspective. Spawning occurs within a lek with males constructing<br />
nests that are <strong>of</strong>ten large and elaborate (McKaye, 1984). Habitats are also species specific and could be considered a<br />
limited resource. Utaka are an exception as <strong>the</strong>y do not construct nests but form dense reproductive shoals above<br />
deep rocky outcrops in upwelling areas. Female mating success is not necessarily hampered by a reduction in<br />
suitable habitat as <strong>the</strong>y have <strong>the</strong> opportunity to choose suitable mate(s) (Kellogg et al., 1995). After spawning,<br />
females ga<strong>the</strong>r <strong>the</strong> eggs and mouthbrood <strong>the</strong>m before releasing few, well-developed juveniles into suitable nursery<br />
habitats – inshore areas in <strong>the</strong> case <strong>of</strong> <strong>the</strong> sandy substrate spawners such as Oreochromis spp. and Lethrinops spp.,<br />
or near <strong>the</strong> parent’s territories in <strong>the</strong> case <strong>of</strong> <strong>the</strong> rock dwelling haplochromine mbuna. It can also be assumed that<br />
paedophagy would linearly dependent on mouthbrooding females. Suitable nursery ground habitat would
258<br />
Lake Malawi Fisheries Management Symposium - Proceedings<br />
unfortunately facilitate differential mortality compounding depensation resulting in a S-R curve approximating that<br />
<strong>of</strong> <strong>the</strong> Beverton-Holt form.<br />
The Beverton-Holt S-R curve is also <strong>the</strong> most conservative from a harvesting perspective, because with <strong>the</strong> lack <strong>of</strong><br />
depensation (or at least reduced compensation), recruits decrease with a reduction <strong>of</strong> spawning biomass. A<br />
conservative approach is not necessarily a poor <strong>management</strong> option given <strong>the</strong> largely artisanal nature <strong>of</strong> cichlid<br />
directed <strong>fisheries</strong>. Figure 6 illustrates an alternative <strong>management</strong> strategy when <strong>the</strong> maximin BRP is calculated for<br />
<strong>the</strong> Beverton-Holt curve only, and is contrasted when <strong>the</strong> BRP is calculated with all S-R curves combined. Fishing<br />
at FMMY decreases fishing mortality and increases spawner biomass-per-recruit by ~10% than <strong>the</strong> previous BRP, a<br />
substantial difference in <strong>the</strong> provision against recruitment failure. Yield is unfortunately compromised for <strong>the</strong><br />
maintenance <strong>of</strong> sufficient spawner biomass but only marginally, at levels <strong>of</strong> ~80% that <strong>of</strong> MSY. The deterministic<br />
model as shown by <strong>the</strong> stochastic simulations is probably over-estimates fishing mortality and it is <strong>the</strong>refore<br />
proposed that <strong>the</strong> revised BRP be decreased to increase spawner biomass-per-recruit to 50% <strong>of</strong> unfished levels. The<br />
precautionary approach prevails in <strong>the</strong> cichlid situation, and if effective fishing mortality is maintained at this rate,<br />
could assist with sustaining <strong>the</strong> livelihood <strong>of</strong> artisanal fishing communities.<br />
References<br />
Beverton, R.J.H and Holt, S.J. 1957. On <strong>the</strong> dynamics <strong>of</strong> exploited fish populations. Fish. Invest. Ser. II (London)<br />
19: 1-533.<br />
Booth, A.J., Merron, G.S. and Buxton, C.D. 1995. The growth <strong>of</strong> Oreochromis andersonii (Pisces : Cichlidae) from<br />
<strong>the</strong> Okavango Delta, Botswana, and a comparison <strong>of</strong> <strong>the</strong> scale and otolith methods <strong>of</strong> ageing. Env. Biol.<br />
Fish. 43: 171-178.<br />
Booth, A.J. and Merron, G.S. 1996. The age and growth <strong>of</strong> <strong>the</strong> greenhead tilapia Oreochromis macrochir<br />
(Pisces:Cichlidae) from <strong>the</strong> Okavango Delta, Botswana. Hydrobiologia 321: 29-34.<br />
Bruton, M.N. 1989. The ecological significance <strong>of</strong> alternative life-history styles. In Alternative life-history styles.<br />
M.N. Bruton (ed.) Kluwer, Dordrecht. 503-553.<br />
Bruton, M.N. and Allanson, B.R. 1974. The growth <strong>of</strong> Tilapia mossambica Peters (Pisces:Cichlidae) is Lake Sibaya,<br />
South Africa. J. Fish Biol. 6: 701-705.<br />
Bruton, M.N. and Boltt, R.E. 1975. Aspects <strong>of</strong> <strong>the</strong> biology <strong>of</strong> Tilapia mossambica Peters (Pisces: Cichlidae) in a<br />
natural freshwater <strong>lake</strong> (Lake Sibaya, South Africa). J. Fish Biol. 7: 423-445.<br />
Caddy, J.F. and Mahon, R. 1995. Reference points for <strong>fisheries</strong> <strong>management</strong>. FAO Fish. Tech. Pap. No. 347.<br />
Clark, W.G. 1991. Groundfish exploitation rates based on life history parameters. Can. J. Fish. Aquat. Sci. 48: 734-<br />
750.<br />
Clark, W.G. 1993. The effect <strong>of</strong> recruitment variability on <strong>the</strong> choice <strong>of</strong> a target level <strong>of</strong> spawning biomass per<br />
recruit. In Proceedings <strong>of</strong> <strong>the</strong> International Symposium on Management Strategies for Exploited Fish<br />
Populations. Kruse, G., Eggers, D. M., Marasco, R. J., Pautzke, C. and T. J. Quinn (Eds). University <strong>of</strong><br />
Alaska, Fairbanks; Alaska Sea Grant College Program Report 93-02: 233–246.<br />
De Silva, SS. 1988. Reservoir <strong>of</strong> Sri Lanka and <strong>the</strong>ir <strong>fisheries</strong>. FAO Fish. Tech. Pap. No. 298. 128pp.<br />
Francis, R. I. C. C. 1992 – Use <strong>of</strong> risk analysis to assess fishery <strong>management</strong> strategies: a case study using orange<br />
roughy (Hoplostethus atlanticus) on <strong>the</strong> Chatham Rise, New Zealand. Can. J. Fish. Aquat. Sci. 49: 922–<br />
930.<br />
Gulland, J.A. and Boerema, L.K. 1973. Scientific advice on catch levels. U.S. Fish. Bull. 71: 325-335.<br />
Hecht, T. 1980. A comparison <strong>of</strong> <strong>the</strong> otolith and scale methods <strong>of</strong> ageing, and <strong>the</strong> growth <strong>of</strong> Saro<strong>the</strong>rodon<br />
mossambicus (Pisces:Cichlidae) in a Venda mpoundment (Sou<strong>the</strong>rn Africa). S. Afr. J. Zool. 15: 222-228.<br />
Hilborn, R. and Walters, C. J. 1992 – Quantitative Fisheries Stock Assessment. Choice, Dynamics and Uncertainty.<br />
Chapman and Hall, New York. 570 pp.<br />
Hoenig, J.M. 1983. Empirical use <strong>of</strong> longevity rates to calculate mortality rates. U.S. Fish. Bull. 82: 898-903.<br />
Jambo, C. M. 1997. Aspects <strong>of</strong> <strong>the</strong> ecology and reproductive biology <strong>of</strong> three cichlid species <strong>of</strong> <strong>the</strong> sou<strong>the</strong>rn Lake<br />
Malombe (Malawi). Unpublished MSc <strong>the</strong>sis, Rhodes University. 126pp.<br />
Kellogg, K.A., J.A. Markert, J.R. Stauffer Jr. and T.D. Kocher. 1995. Microsatellite variation demonstrates multiple<br />
paternity in lekking cichlid fishes from Lake Malawi, Africa. Proc. R. Soc. Lond. B.260:79-84.<br />
Lowe [McConnell], R.H. 1959. Breeding behaviour patterns and ecological differences between Tilapia species and<br />
<strong>the</strong>ir significance for evolution within <strong>the</strong> genus Tilapia (Pisces: Chlidae). Pro. Zool. Soc. Lond. 132: 1-30.<br />
Mace, P.M. 1994. Relationships between common biological points used as thresholds and targets <strong>of</strong> <strong>fisheries</strong><br />
<strong>management</strong> strategies. Can. J. Fish. Aquat. Sci.51: 110-122.
259<br />
Lake Malawi Fisheries Management Symposium - Proceedings<br />
Mace, P.M. and Doonan, I.J. 1988. A generalized bioeconomic simulation model for fish population dynamics. N.J.<br />
Fish. Assess. Doc. 88/4.<br />
McKaye, K.R. 1984. Behavioural aspects <strong>of</strong> cichlid reproductive strategies: patterns <strong>of</strong> territoriality and brood<br />
defence in Central African substratum spawners and African mouthbrooders. In G.W. Potts. & R.J. Wooton<br />
(Eds.) Fish reproduction: strategies and tactics. Academic Press, London. pp 245-273.<br />
Myers, R. A, Bridson, J. And Barrowman, N. J. 1995 – Summary <strong>of</strong> worldwide spawner and recruitment data. Can.<br />
tech. Rep. Fish. Aquat. Sci. 2024: iv + 327 pp.<br />
Ogutu-Ohwayo, R. 1990. The decline <strong>of</strong> <strong>the</strong> native fishes <strong>of</strong> Lakes Victoria and Kyoga (East Africa) and <strong>the</strong> impact<br />
<strong>of</strong> introduced species, especially <strong>the</strong> Nile perech Lates niloticus, and <strong>the</strong> Nile tilapia, Oreochromis<br />
niloticus. Env. Biol. Fish. 27: 81-96.<br />
Pálsson, Ó.K., Bulirani and Banda, M. 1999. A review <strong>of</strong> biology, <strong>fisheries</strong> and population dynamics <strong>of</strong> chambo<br />
(Oreochromis spp., Cichlidae) in Lakes Malawi and Malombe. Government <strong>of</strong> Malawi, Fisheries Bulletin.<br />
38. 35pp.<br />
Pauly, D. 1980. On <strong>the</strong> interrelationship between natural mortality, growth parameters and mean environmental<br />
temperature in 175 stocks <strong>of</strong> fish. J. Cons. Int. Explor. Mer. 39: 175-192.<br />
Sissenwine, M.P. and Shepherd, J.G. 1987. An alternative perspective on recruitment overfishing and biological<br />
reference points. Can. J. Fish. Aquat. Sci.44: 913-918.<br />
Trewavas, E. 1983. Tilapiine fishes <strong>of</strong> <strong>the</strong> genera Saro<strong>the</strong>rodon, Oreochromis and Danakilia. London.<br />
Tweddle, D. and J.L. Turner, 1977. Age, growth and natural mortality rates <strong>of</strong> some cichlid fishes <strong>of</strong> Lake Malawi.<br />
J. Fish Biol. 10:385-395.<br />
Van der Waal, B.C.W. 1985. Aspects <strong>of</strong> <strong>the</strong> biology <strong>of</strong> larger fish species <strong>of</strong> Lake Liambezi, Caprivi, South West<br />
Africa. Madoqua 14: 101-144.<br />
Weyl, O.L.F. and Hecht, T. 1998. The biology <strong>of</strong> Tilapia rendalli and Oreochromis mossambicus (Pisces:<br />
Cichlidae) in a subtropical <strong>lake</strong> in Mozambique. S. Afr. J. Zool. 33: 178-188.
260<br />
Lake Malawi Fisheries Management Symposium - Proceedings<br />
Appendix I: Abstracts <strong>of</strong> papers not submitted for publication<br />
(with comments from floor)<br />
Ecological aspects <strong>of</strong> <strong>the</strong> ornamental fish <strong>of</strong> Lake Malawi and <strong>the</strong>ir implications in<br />
relation to exploitation and conservation<br />
A. Msukwa<br />
Department <strong>of</strong> National Parks and Wildlife, cape MacClear. Malawi<br />
Abstract<br />
Lake Malawi has diverse ichthy<strong>of</strong>auna estimated at over 1000 species. The food fish industry (artisanal and mechanized<br />
commercial <strong>fisheries</strong>) exploit many species with <strong>the</strong> exception <strong>of</strong> <strong>the</strong> colourful rock dwelling cichlids locally known as mbuna. The<br />
mbuna are exploited by licenced exporters for <strong>the</strong> aquarium trade. The food fish exploitation industry has enjoyed monitoring and<br />
<strong>management</strong> attention from <strong>the</strong> Fisheries Department that <strong>the</strong> aquarium fish export industry has not. Management regulations <strong>of</strong> a<br />
fishery are based on <strong>the</strong> way <strong>the</strong> fish are exploited and <strong>the</strong> biological and ecological information concerning <strong>the</strong> fish. Due to this<br />
background some biological and ecological aspects <strong>of</strong> mbuna were studied at <strong>the</strong> three Maleri Islands in Lake Malawi National Park<br />
with a view to assessing <strong>the</strong> impact <strong>of</strong> <strong>the</strong>ir exploitation for ornamental trade. The mbuna were sampled by 1 hour gillnetting at 2, 5<br />
and 10 m depths around <strong>the</strong> three Maleri Islands between January and May 2000. The following aspects were assessed: <strong>the</strong><br />
distribution and relative abundance, female reproductive stages and size at maturity and sex ratios. Two licenced exporters <strong>of</strong><br />
mbuna were visited to assess species and numbers exploited. All sites sampled had diverse fish species ranging from 19 to 25<br />
mbuna species and 15 to 34 non-mbuna species per site. A majority <strong>of</strong> <strong>the</strong>se species were found at all three islands with a few<br />
restricted to one or two <strong>of</strong> <strong>the</strong> three islands. There were significant (p
261<br />
Lake Malawi Fisheries Management Symposium - Proceedings<br />
Determination <strong>of</strong> species diversity in various areas <strong>of</strong> Lake Malombe<br />
B. Chirwa*, A. Ambali, M. Chagunda & E. Kaunda<br />
Molecular Biology and Ecology Research Unit (MBERU), AMBAKA Building, Chancellor, College Campus, Box 403, Zomba<br />
Abstract<br />
Lake Malombe is <strong>the</strong> third largest <strong>lake</strong> in Malawi and contributes substantially to <strong>the</strong> country's fish production. The <strong>lake</strong>'s fishery<br />
started to decline since <strong>the</strong> early 1980s when <strong>the</strong> Oreochromis Nyasalapia species were replaced by <strong>the</strong> small cichlids collectively<br />
known as Kambuzi. The fishery has currently collapsed and in attempt to improve <strong>the</strong> situation, <strong>the</strong> Government <strong>of</strong> Malawi<br />
established a reserve area in <strong>the</strong> <strong>lake</strong> that acts as stock recovery area. The study assessed species diversity in <strong>the</strong> eastern and<br />
western fishing sites and sanctuary area. A total <strong>of</strong> 39 species were sampled; 33 in <strong>the</strong> eastern side and 25 in <strong>the</strong> western side. Fish<br />
species diversity was high in <strong>the</strong> eastern than <strong>the</strong> western sites, mean H' value 2.127 and 1.77, respectively. Fish species are more<br />
abundant in eastern sites than western sites, mean D' value 3.93 and 2.57, respectively and more evenly distributed in eastern sites<br />
than western sites, mean J'' value 0.73 and 0.63, respectively. Laboratory studies are currently underway to determine whe<strong>the</strong>r <strong>the</strong><br />
sanctuary is contributing to recruitment in <strong>the</strong> fishing grounds and if <strong>the</strong>re is migration between <strong>the</strong> eastern and western sides<br />
Questions and Comments<br />
Q: What is <strong>the</strong> difference between total alleles and effective alleles?<br />
A: Total alleles are all alleles present. Effective alleles are those that affect <strong>the</strong> character controlled by that<br />
locus and can be used as a measure <strong>of</strong> inbreeding or migration between populations.<br />
Q: What mesh size did you use in your sampling? Does your low sample species richness (39) as opposed to<br />
Kissa’s over 60 species not invalidate your findings?<br />
A: My results are in agreement with FAO’s and Jambo’s findings, with around 40 species for <strong>the</strong> <strong>lake</strong>. We<br />
used 19 mm mesh size nets since that is <strong>the</strong> mesh size used by <strong>the</strong> nkacha net fishermen.<br />
Q: Did you get samples from fishers or did you conduct experimental fishing as this is important in relation to<br />
depth?<br />
A: My samples were obtained from fishermen; I followed up from Jambo’s study by using a similar strategy<br />
for sampling.<br />
Comment: The low species number obtained in this study may be due to species identification problems (B.<br />
Ngatunga).<br />
A: For identification, <strong>the</strong> Fisheries Research Unit, Monkey Bay, staff were used.<br />
Q: How many samples did you use in this study?<br />
A: I used four replicates per site.<br />
Comment: It should be kept in mind that <strong>the</strong> number <strong>of</strong> samples in this study were much less than Kissa’s study<br />
who used over 100 samples, thus it is not surprising that Kissa had a higher number <strong>of</strong> species in his study<br />
(G. Turner).
262<br />
Lake Malawi Fisheries Management Symposium - Proceedings<br />
River discharge and water quality<br />
M. Gondwe, M. Kingdon, H. Bootsma, J. Mwita, B. Mwichande & R. Hecky<br />
SADC/GEF Project, P.O. Box 311, Salima, Malawi<br />
Abstract<br />
Phytoplankton in Lake Malawi support a high fish biodiversity. On <strong>the</strong> o<strong>the</strong>r hand phytoplankton productivity and composition in <strong>the</strong><br />
productive layer <strong>of</strong> <strong>the</strong> <strong>lake</strong> water is largely determined by nutrients availability. One <strong>of</strong> <strong>the</strong> major ways nutrient loading into <strong>the</strong><br />
productive layer occurs is through river discharge. The level <strong>of</strong> nutrient loading by a river depends on land use and human activities<br />
in <strong>the</strong> watershed <strong>of</strong> <strong>the</strong> river. Deforestation, bush fires and washing away <strong>of</strong> farmland due to poor agricultural practices have been<br />
observed to increase nutrient levels in run<strong>of</strong>f to <strong>lake</strong>s. Such situations have led to eutrophication <strong>of</strong> <strong>the</strong> <strong>lake</strong>s and consequent<br />
decline and/or extinction <strong>of</strong> biodiversity as experienced in Lake Victoria.<br />
The importance <strong>of</strong> rivers in respect <strong>of</strong> <strong>the</strong> foregoing was recognized by <strong>the</strong> SADC/GEF Lake Malawi Biodiversity Conservation<br />
Project. As such, Limnology section <strong>of</strong> <strong>the</strong> project sampled Lake Malawi rivers from 1996 through 1999 with <strong>the</strong> aim <strong>of</strong>:<br />
Determining <strong>the</strong> annual loading <strong>of</strong> nutrients and sediments into <strong>the</strong> <strong>lake</strong> from <strong>the</strong> rivers for inclusion in <strong>the</strong> whole <strong>lake</strong> budget.<br />
Assessing <strong>the</strong> current water quality <strong>of</strong> <strong>the</strong> in-flowing rivers, especially for parameters such as phosphorus, nitrogen, silica and<br />
suspended solids that are most likely to affect <strong>the</strong> limnology <strong>of</strong> <strong>the</strong> <strong>lake</strong> and its budget. Suggesting sensitive chemical parameters<br />
that are particularly important to <strong>the</strong> <strong>lake</strong>'s water quality and biodiversity and which should be <strong>the</strong> focus <strong>of</strong> <strong>the</strong> future<br />
monitoring/research programs.<br />
Among <strong>the</strong> many findings are: No statistically valid relationship was observed to exist between daily river discharge and nutrient<br />
concentration. For all rivers <strong>the</strong> early part <strong>of</strong> <strong>the</strong> flow season exhibited a flushing effect for most nutrients. In December 1996, TSS,<br />
TDN and TDP were 79.03mg/l, 1.352 and 0.075 mmoles/m2 <strong>lake</strong> surface area while in May 1997 concentrations were 0.45mg/l<br />
0.138 and 0.005 mmoles/m2 <strong>lake</strong> surface area. Loading <strong>of</strong> all nutrients and sediments was significantly higher in <strong>the</strong> southwestern<br />
catchment and nor<strong>the</strong>astern catchment <strong>of</strong> <strong>the</strong> <strong>lake</strong>. Northwestern catchment accounts for only 6.3% <strong>of</strong> <strong>the</strong> total for all nutrients.<br />
Loading <strong>of</strong> all dissolved nutrients except SO4 was similar in southwestern catchment and nor<strong>the</strong>astern catchment, however loading<br />
<strong>of</strong> total suspended solids (TSS) and all suspended nutrients was higher in nor<strong>the</strong>astern catchment than in southwestern catchment.<br />
Majority <strong>of</strong> <strong>the</strong> flux to <strong>the</strong> <strong>lake</strong> was in form <strong>of</strong> particulate nutrients, and <strong>the</strong> concentrations <strong>of</strong> total nitrogen (N), total phosphorus (P)<br />
and available silica (Si) were all correlated with suspended solids concentration.<br />
NOTE: Southwestern catchment has Linthipe, Bua and Dwangwa rivers. Northwestern catchment has Songwe, South and North<br />
Rukuru rivers. Nor<strong>the</strong>astern catchment has Ruhuhu river.<br />
Questions and Comments<br />
Q: Are algal blooms <strong>the</strong> only factor causing fish kills?<br />
A: No, but mostly it is due to algal blooms. When diatoms die <strong>the</strong>y sink and do not fix nitrogen; whilst some<br />
green algae (some <strong>of</strong> which fix nitrogen) do not sink, thus contributing to oxygen depletion.<br />
Q: Is <strong>the</strong>re any information on <strong>the</strong> phytoplankton for Lake Malawi or <strong>the</strong> blue-green algae composition?<br />
A: Yes it is available, a UK/SADC publication edited by Menz.
263<br />
Lake Malawi Fisheries Management Symposium - Proceedings<br />
Metals, Pesticides And O<strong>the</strong>r Persistent Contaminants In Water, Sediments And<br />
Biota From Lake Malawi/Nyasa<br />
A. Bulirani*, K. Kidd, W. Lockhart, P. Wilkinson & D. Muir<br />
SADC/GEF Project, P.O. Box 311, Salima, Malawi<br />
Abstract<br />
Lake Malawi is a valuable resource to <strong>the</strong> populations along its shores in <strong>the</strong> riparian countries. Among <strong>the</strong> major resources are fish<br />
that provides about 75% <strong>of</strong> <strong>the</strong> much essential animal protein and water for irrigation, domestic use and recreation. In <strong>the</strong> event <strong>of</strong><br />
<strong>the</strong> availability <strong>of</strong> micro-contaminants such as PCBs and organochlorine pesticides at toxic concentrations in <strong>the</strong> <strong>lake</strong>, <strong>the</strong>se uses<br />
would obviously constitute health risk for <strong>the</strong> people. Previous work elsewhere on PCBs and organochlorine pesticides has shown<br />
that <strong>the</strong>y reach toxic concentrations through bioaccumulation in food chains as a result <strong>of</strong> <strong>the</strong>ir very strong persistency in soil, air<br />
and water. One strong effect <strong>of</strong> micro-contaminants such as <strong>the</strong>se PCBs and organochlorine pesticides at toxic concentrations to<br />
fish in a <strong>lake</strong> is fish kills. In 1999, PCBs and organochlorines were linked, in <strong>the</strong> minds <strong>of</strong> some many individuals in Malawi, to <strong>the</strong><br />
famous <strong>lake</strong>-wide fish kills experienced in Lake Malawi during <strong>the</strong> windy August - November period, which was unusually long.<br />
One <strong>of</strong> <strong>the</strong> research interests <strong>of</strong> <strong>the</strong> SADC/GEF Lake Malawi Biodiversity Conservation Project was to determine <strong>the</strong> concentration<br />
<strong>of</strong> microcontaminants such as PCBs and organochlorine pesticides in fish, mud and wake water.<br />
The project's research findings on PCBs and organochlorines in <strong>the</strong> <strong>lake</strong> water and fish biota did not confirm <strong>the</strong> fears and<br />
suspicions that <strong>the</strong>y were a possible cause for <strong>the</strong> fish kills. Organochlorine pesticides and PCBs were detected at low<br />
concentrations in surface as well as in subsurface waters <strong>of</strong> <strong>the</strong> <strong>lake</strong>. PCBs were <strong>the</strong> major organochlorines in surface waters and<br />
<strong>the</strong>ir concentrations ranged from 165-854pg/l. Deep water samples (e.g. 80m) gave lower concentrations ranging from 100-187pg/l.<br />
Oftenly <strong>the</strong> results were found to be below <strong>the</strong> detection limit which is approximately 100pg/l.<br />
Concentrations <strong>of</strong> persistent pesticides and PCBs in fish from Lake Malawi were low in all fish analysed. Examination <strong>of</strong> <strong>the</strong><br />
Canadian Bureau <strong>of</strong> Chemical Safety's tolerable daily intakes (TDIs) <strong>of</strong> 1.0ug.kg body weight-1day-1 for PCBs and <strong>the</strong>ir<br />
concentrations in Lake Malawi fish revealed that a 60kg person can safely consume on a daily basis over a lifetime up to 34.6kg/day<br />
Mcheni, 235kg/day Chambo, 2.9kg/day Mpasa, 4.1kg/day Usipa and 17.7kg/day Kampango. This confirms that consumption <strong>of</strong><br />
Lake Malawi fishes does not pose any health risk to humans especially because fish is never consumed daily and in <strong>the</strong>se<br />
quantities.<br />
Questions and Comments<br />
Q: What is <strong>the</strong> significance <strong>of</strong> using muscle tissue ra<strong>the</strong>r than using bony structure in <strong>the</strong> analysis?<br />
A: To my understanding people consume <strong>the</strong> fleshy part <strong>of</strong> <strong>the</strong> fish thus <strong>the</strong> analysis used muscle tissue.<br />
Q: Is <strong>the</strong>re any plan to study how different fish eating habits <strong>of</strong> people reflect <strong>the</strong> levels <strong>of</strong> contamination?<br />
A: The contamination levels so far are too low to be <strong>of</strong> concern, <strong>the</strong>refore <strong>the</strong>re are no plans to do research on<br />
<strong>the</strong> eating habits <strong>of</strong> people.<br />
Q: How do chemicals accumulate in upper layers when your colleague (M. Gondwe) indicates that most <strong>of</strong> <strong>the</strong><br />
chemicals accumulate below <strong>the</strong> <strong>the</strong>rmocline? How do <strong>the</strong> contaminants that have settled down below <strong>the</strong><br />
<strong>the</strong>rmocline affect <strong>the</strong> fish?<br />
A: Due to wave action and upwelling, <strong>the</strong> contaminants from <strong>the</strong> bottom reach <strong>the</strong> upper layers where <strong>the</strong> fish<br />
are and eventually accumulate in <strong>the</strong> food web.<br />
Q: Why did you not use <strong>the</strong> World Health Organization’s (WHO) or <strong>the</strong> Malawi Bureau <strong>of</strong> Standards<br />
standards for tolerance levels <strong>of</strong> contaminants?<br />
A: The Canadian standards were adopted because <strong>the</strong> contract was awarded to a water quality analysis institute<br />
<strong>of</strong> Winnipeg, Canada. The values were thought to be representative.
264<br />
Lake Malawi Fisheries Management Symposium - Proceedings<br />
The Traditional Gillnet Fisheries In Metangula, Lake Malawi/Niassa, East Africa<br />
J. Halafo<br />
Fisheries Research Institute, P.O. Box 4603, Maputo, Mozambique E-mail: halafo@iip.co.mz<br />
Abstract<br />
Metangula is <strong>the</strong> principal village on <strong>the</strong> Mozambique coast <strong>of</strong> Lake Malawi/Niassa. It has 9 human settlements<br />
where fishing occurs over about 40 km <strong>of</strong> shoreline. This village is one <strong>of</strong> <strong>the</strong> few places where <strong>the</strong> gillnet catches <strong>of</strong><br />
Labeo mesops (nchila), and Opsaridium microcephalus (sanjika) occur, due perhaps to <strong>the</strong> low fishing pressure in<br />
that area. Although <strong>the</strong> gillnet fishery catches a wider variety <strong>of</strong> commercial fish than any o<strong>the</strong>r gear type used by<br />
<strong>the</strong> fishermen, nchila, and sanjika are <strong>the</strong> most important species in <strong>the</strong> catches. The seasonality <strong>of</strong> habitats appears<br />
to be a key factor affecting many interrelated aspects <strong>of</strong> life cycle for this species. Their movements to feed or<br />
spawn are tied up with seasonal and o<strong>the</strong>r changes in <strong>the</strong> environment.<br />
The traditional <strong>fisheries</strong> <strong>of</strong> Labeo mesops, and Opsaridium microcephalus, mainly from gillnets, have decreased<br />
seriously in <strong>the</strong> past 10 years over <strong>the</strong> <strong>lake</strong>. These species are reported as being missed from <strong>the</strong> catches in gillnet<br />
<strong>fisheries</strong> <strong>of</strong> Malawi. Smith (1993a) found CPUE = 0 for those species in Chembe village. Few years ago, L. mesops<br />
was <strong>the</strong> most important fish in <strong>the</strong> riverine fishery in Malawi. It has been depleted due to intensive gillnetting <strong>of</strong><br />
gravid individuals on breeding migrations.<br />
This paper presents preliminary results on traditional gillnet <strong>fisheries</strong> in Metangula, focusing on 2 important<br />
commercial species referred above. I'm also trying to arise here <strong>the</strong> concrete need for <strong>fisheries</strong> <strong>management</strong> and<br />
biodiversity conservation particularly related to <strong>the</strong>se species. It's not clear yet whe<strong>the</strong>r <strong>the</strong>se species are represented<br />
by a single population that is widespread in <strong>the</strong> <strong>lake</strong>, or by different populations with distinctive morphometric,<br />
genetic and life history characteristics. Therefore, <strong>the</strong> studies in near future will focus on distribution along <strong>the</strong><br />
shore, comparison <strong>of</strong> its morphometric and genetic characteristics, and life history, in order to know whe<strong>the</strong>r <strong>the</strong>se<br />
species return to <strong>the</strong> same rivers for reproduction or <strong>the</strong>y go to any river. The studies will also include issues <strong>of</strong><br />
economic value and conservation status.<br />
Questions and Comments<br />
Q: The gillnet effort per 100m; are <strong>the</strong>y mounted or not?<br />
A: Mounted gear used for effort estimate.<br />
Q: Don’t you think that <strong>the</strong> sampling duration <strong>of</strong> December 1998 to March 1999 was too short to come up<br />
with reliable conclusions and solutions?<br />
A: I agree.<br />
Q: Do fishermen use multi or mon<strong>of</strong>ilament gill nets?<br />
A: The fishermen use both types, however mon<strong>of</strong>ilament gill nets are uncommon.<br />
Comment: There is data available for <strong>the</strong> next 8 months after this study and it should be included in <strong>the</strong> analysis<br />
(G.F. Turner).<br />
Q: The disappearance <strong>of</strong> adults (Cyprinids) in December may be due to migration and not due to fishing.<br />
What is known about <strong>the</strong> migratory patterns <strong>of</strong> <strong>the</strong> fish studied?<br />
A: There is a possibility that migration may be playing a role, however it has not been studied. It may be<br />
looked into next time.
265<br />
Lake Malawi Fisheries Management Symposium - Proceedings<br />
Genetic diversity distribution <strong>of</strong> tasselled tilapias (Oreochromis nyasalapia spp.:<br />
Cichlidae) in Lake Malawi using microsatellite DNA markers<br />
D. Kafumbata* & A. Ambali<br />
Molecular Biology and Ecology Research Unit (MBERU), AMBAKA Building, Chancellor College Campus, Box 403, Zomba<br />
Abstract<br />
A study was carried out to investigate <strong>the</strong> genetic diversity distribution <strong>of</strong> three species <strong>of</strong> O. Nyasalapia in Lake Malawi. Five<br />
polymorphic loci were scored in 12 populations. The total number <strong>of</strong> alleles ranged from 13.0(4.4 to 18.4(5.9; mean effective number<br />
<strong>of</strong> alleles ranged from 8.0( 4.0 to 11.09(4.0 in O. karongae, 9.09(2.3 to 10.2(3.8 in O. lidole and 8.8(4.8 to 11.9(4.7 in O.<br />
squamipinnis. The mean heterozygosity per population ranged from 0.45(0.17 to 0.66(0.16, which is higher than reported in<br />
allozyme loci. There is high genetic variation in O. squamipinnis, followed by O. karongae and O. lidole. The populations are not<br />
highly differentiated. These results suggest that <strong>the</strong> O. Nyasalapia flock has still maintained a reasonable level <strong>of</strong> genetic variation in<br />
<strong>the</strong> face <strong>of</strong> intense fishing pressures.<br />
Comments from floor<br />
Q: With what gears were <strong>the</strong> samples collected from?<br />
A: Nkacha nets.<br />
Q: What about species identification, for instance, how did you deal with <strong>the</strong> juvenile chambo?<br />
A: We used FRU technicians for identification and small chambo were not included in <strong>the</strong> analysis.<br />
Q: If two populations are not genetically different, does it mean that <strong>the</strong>re is migration?<br />
A: Not always true.<br />
Q: Did you statistically test for genetic differences among <strong>the</strong> three species from <strong>the</strong> same location?<br />
A: Yes. There was no difference between <strong>the</strong> species. The Fst values were very small and <strong>the</strong>refore cannot be<br />
considered as significant. There was a lot <strong>of</strong> overlap even among species <strong>of</strong> <strong>the</strong> same area.<br />
Q: What does <strong>the</strong> 5 migrants per generation mean?<br />
A: It refers to actual individuals (i.e. 5) migrating out per generation from a population.
266<br />
Lake Malawi Fisheries Management Symposium - Proceedings<br />
Genetic population structure <strong>of</strong> Oreochromis mossambicus in <strong>the</strong> Shire River<br />
system<br />
M. Chimenya* & A, Ambale<br />
Molecular Biology and Ecology Research Unit (MBERU), AMBAKA Building, Chancellor College Campus, Box 403, Zomba<br />
Abstract<br />
An investigation in <strong>the</strong> Lower Shire River fishery was carried out to assess <strong>the</strong> status <strong>of</strong> genetic variation <strong>of</strong> O. mossambicus using<br />
microsatellite DNA markers. Five polymorphic loci (OS08, OS64, OS75, UNH154 and UNH103) were scored in 11 populations.<br />
Number <strong>of</strong> alleles per locus ranged from 4 in OS64 to 40 in UNH154. Cluster analysis grouped populations into three, (1) those<br />
found in Chikwawa, (2) those that are found at Elephant Marsh and (3) those that are found at Ndinde Marsh.<br />
Genepop program was used to calculate allelic diversity <strong>of</strong> each <strong>of</strong> <strong>the</strong> 11 populations. The mean number <strong>of</strong> alleles ranged from 8.2<br />
to 11.0 with mean heterozygosity range <strong>of</strong> 0.48 to 0.68. All populations exhibited considerable genetic diversity. WHICHRUN<br />
program was used to assign individuals to <strong>the</strong>ir right strata/populations based multi-locus genotype data. Probability <strong>of</strong> assigning <strong>of</strong><br />
a population to its right strata ranged from 52-100%. Probability <strong>of</strong> assigning <strong>of</strong> an individual to its right population ranged from 57-<br />
95%. Populations from <strong>the</strong> market were assigned to different sources than indicated by <strong>the</strong> fish traders and <strong>the</strong>se tended to reduce<br />
<strong>the</strong> probability <strong>of</strong> right assignment <strong>of</strong> individuals to source.<br />
Comments from floor<br />
Q: Have you used fish from <strong>the</strong> ponds, e.g. from Domasi and those in <strong>the</strong> Lower Shire?<br />
A: Yes, some work has been done on O. mossambicus from <strong>the</strong> ponds in Domasi by Dr. A. Ambali.<br />
Q: What are <strong>the</strong> differences between <strong>the</strong> fish from <strong>the</strong> ponds and those in <strong>the</strong> Lower Shire?<br />
A: From Dr. Ambali’s samples from Domasi he identified three alleles, however, in this study (samples from<br />
<strong>the</strong> Lower Shire) four alleles were identified. This may be due to different environmental conditions<br />
encountered by fish in captivity.<br />
Q: How cost effective is your analysis process?<br />
A: It is a very expensive process. The cost is about MK15,000.00 per 20 samples.
267<br />
Lake Malawi Fisheries Management Symposium - Proceedings<br />
Zoogeographical distribution and population structure <strong>of</strong> Taeniolethrinops<br />
praeorbitalis exploited by artisanal fishermen in <strong>the</strong> inshores <strong>of</strong> Lake Malawi<br />
W. Changadeya* & A. Ambali<br />
Molecular Biology and Ecology Research Unit (MBERU), AMBAKA Building, Chancellor College Campus, Box 403, Zomba<br />
Abstract<br />
Lethrinops species flock (Chisawasawa/mbaba) is among <strong>the</strong> major commmercially important fish species exploited in Lake Malawi.<br />
Their catches started declining as early as 1975 due to overexploitation especially in <strong>the</strong> sou<strong>the</strong>rn part <strong>of</strong> <strong>the</strong> <strong>lake</strong> yet <strong>the</strong>re are no<br />
deliberate measures put in place to conserve <strong>the</strong>se vital populations. A study was carried out to determine <strong>the</strong> genetic diversity and<br />
population structure <strong>of</strong> Taeniolethrinops praeorbitalis populations in traditional <strong>fisheries</strong> <strong>of</strong> Sou<strong>the</strong>ast and Southwest arms <strong>of</strong> <strong>the</strong><br />
<strong>lake</strong>, Mangochi District and Nkhota -kota <strong>lake</strong>shore area. A total <strong>of</strong> 10 populations with 40 individuals as sample size were analyzed<br />
at 6 polymorphic microsatellite loci. The populations were not in Hardy-Weinberg equilibrium possibly due to Wuhlund effect. This is<br />
supported by inter-deme migration <strong>of</strong> more than seven individuals per generation as determined by a multilocus estimate <strong>of</strong> number<br />
<strong>of</strong> migrants using private alleles method. However this rate <strong>of</strong> migration has not reduced population differentiation in T. praeorbitalis,<br />
mean Fst <strong>of</strong> 0.152.<br />
Comments from floor<br />
Q: Are <strong>the</strong> Nkhota-kota and Mangochi populations <strong>of</strong> Taeniolethrinops praeorbitalis different?<br />
A: Yes.<br />
Q: Who identified <strong>the</strong> species used?<br />
A: Dr. B. Ngatunga did <strong>the</strong> identification.<br />
Comment by Dr. B. Ngatunga: I was involved in <strong>the</strong> initial start-up <strong>of</strong> <strong>the</strong> research by helping <strong>the</strong> student with <strong>the</strong><br />
identification <strong>of</strong> <strong>the</strong> fish species, however, I wish to express that one <strong>of</strong> <strong>the</strong> pictures in <strong>the</strong> student’s<br />
presentation showing <strong>the</strong> fish species he analysed was not Taeniolethrinops praeorbitalis as he claimed, but<br />
I suspect that it was an Aulonocara species.
268<br />
Lake Malawi Fisheries Management Symposium - Proceedings<br />
Feeding ecology <strong>of</strong> Bathyclarias nyasensis (Siluroidei: Clariidae) in Lake Malawi<br />
E. Kaunda 1* &T. Hecht 2<br />
1 Dept <strong>of</strong> Aquaculture and Fisheries Science, University <strong>of</strong> Malawi, Bunda College, Box 219 Lilongwe, Malawi.<br />
2 Rhodes University, P.O. Box 6140, Grahamstown R.S.A.<br />
Abstract<br />
The ecological role <strong>of</strong> B. nyasensis in Lake Malawi was identified from studies on life history raits, ecological and functional<br />
morphology in addition to diet and food habits <strong>of</strong> <strong>the</strong> species conducted between 1996-1998. The maximum age for B. nyasensis<br />
was estimated at 14 years. Growth was best described by <strong>the</strong> four parameter Schnute model:<br />
for female and<br />
for male fish. Age-at-50% maturity for females and males were estimated at 7 years and 4 years, respectively. Typically, fish grew<br />
rapidly in <strong>the</strong> first year, but slower during subsequent years. Smaller fish were found inshore while larger fish were found in <strong>of</strong>fshore<br />
regions. It was hypo<strong>the</strong>sised that <strong>the</strong> rapid growth in <strong>the</strong> first year and slower growth later is a consequence <strong>of</strong> change in diet from<br />
high quality and abundant food source to a more dilute food and that this may be associated with a shift in habitat.<br />
Changes in fish growth synchronised with dietary changes and morphology particularly changes in buccal cavity volume. These<br />
changes occurred when fish reached 500-600 mm TL, concomitant with habitat shifts that probably imply a mechanism to open <strong>the</strong><br />
inshore habitat to <strong>the</strong> next cohort, <strong>the</strong>reby maintaining a stable population. In inshore areas, B. nyasensis was primarily piscivorous<br />
and was zooplanktivorous in <strong>of</strong>fshore regions.<br />
On <strong>the</strong> basis <strong>of</strong> <strong>the</strong> <strong>the</strong>oretical migratory life history cycle <strong>of</strong> B. nyasensis, and “bottom-up” and trophic cascade <strong>the</strong>ories, it is<br />
postulated that perturbations <strong>of</strong> <strong>the</strong> B. nyasensis stock would be discernible both at <strong>the</strong> top and lower trophic levels. As a piscivore<br />
and <strong>the</strong>refore apex predator, effects <strong>of</strong> overfishing B. nyasensis in <strong>the</strong> inshore region could cascade to unpredictable ecological<br />
changes in inshore areas and, due to <strong>the</strong> ontogenetic habitat shift, in <strong>the</strong> <strong>of</strong>fshore regions. It is recommended that <strong>the</strong> current<br />
interest in increasing fishing effort in <strong>of</strong>fshore areas should proceed with caution.<br />
Questions and Comments<br />
Q: In your presentation you pointed out that Bathyclarias nyassensis is a pelagic species, yet during <strong>the</strong> UK<br />
SADC project only 27 specimens were caught. Is it really pelagic?<br />
A: It is not really pelagic, although sometimes it can behave like a pelagic species.<br />
Q: The deepwater fishery targets <strong>the</strong> small species (chisawasawa), and <strong>the</strong> catfishes caught as bycatch and are<br />
not considered in <strong>management</strong>. How do you manage this fishery?<br />
A: There is no policy for <strong>the</strong> catfishes at present.<br />
Q: How did you validate your aging?<br />
A: I used marginal zone analysis for validation.<br />
lt ={42+(81 1.8 - 42 1.8 )x 1-e -0.05(t-1) } 1/1.8<br />
1-e -(-0.05)(11)<br />
lt ={41+(98 1.2 - 41 1.2 )x 1-e -0.02(t-1) } 1/1.2<br />
1-e -(-0.02)(13)<br />
Q: Concerning your observation on feeding aggregations <strong>of</strong> juveniles and adults, could you verify this<br />
observation?<br />
A: My data indicated that feeding aggregations <strong>of</strong> Bathyclarias nyassensis took place.
269<br />
Lake Malawi Fisheries Management Symposium - Proceedings<br />
Land use patterns in <strong>the</strong> Domasi and Likangala catchments and <strong>the</strong>ir effects on<br />
soil erosion, water quality, river flow rates, siltation rates and Barbus<br />
reproduction in Lake Chilwa<br />
D. Jamu*, J. Chimphamba & R. Brummett<br />
ICLARM, P.O. Box 229 Zomba<br />
A study to examine trends in land use practices, and to establish linkages between river flow, soil erosion rates, catchment sediment<br />
yield, river water quality, migratory patterns and reproductive success <strong>of</strong> Barbus species in <strong>the</strong> Likangala and Domasi rivers was<br />
conducted between November 2000 and November 2001. Participatory rural appraisals, to obtain information on current and past<br />
land use and <strong>management</strong> practices and <strong>the</strong> effects <strong>of</strong> <strong>the</strong>se practices on <strong>the</strong> river ecosystem health, were conducted in four<br />
villages in <strong>the</strong> Likangala catchment and in Mtwiche village in <strong>the</strong> Domasi catchment. Land use cover change analysis was<br />
accomplished by aerial photograph interpretation <strong>of</strong> black and white aerial photographs for 1982 and 1995 covering <strong>the</strong> study area.<br />
Soil erosion rates were estimated using <strong>the</strong> Soil Erosion Model for Sou<strong>the</strong>rn Africa (SLEMSA) by delineating soil erosion<br />
<strong>management</strong> units with homogeneous areas with similar slope, class, soil group, annual mean rainfall, and vegetation cover type<br />
and density. Catchment sediment yields were obtained by multiplying <strong>the</strong> estimated soil loss for each soil erosion <strong>management</strong> unit<br />
with a delivery ratio, which was defined as <strong>the</strong> ratio <strong>of</strong> soil eroded that had been carried downstream to that remaining within <strong>the</strong><br />
field. Barbus and water quality sampling in <strong>the</strong> Likangala and Domasi Rivers was conducted biweekly from December 2000 up to<br />
June 2000 and <strong>the</strong>reafter monthly until November 2001. The Barbus were sampled at <strong>the</strong> river mouth using a multi-mesh gillnet to<br />
determine <strong>the</strong>ir total number and <strong>the</strong>y were assessed for <strong>the</strong>ir position in <strong>the</strong> net to determine direction <strong>of</strong> migration. Adult females<br />
were assessed for <strong>the</strong>ir gonadosomatic index. The gonadosomatic index was used to determine <strong>the</strong> seasonal reproductive status <strong>of</strong><br />
Barbus. The water quality parameters measured were dissolved oxygen, electrical conductivity, pH and total suspended solids.<br />
River flow rate was measured using a current flow meter and <strong>the</strong> float method. Water quality, river flow, sediment yield,<br />
reproductive and fish migration data were subjected to multiple regression analysis to determine <strong>the</strong> major factors affecting<br />
reproductive status and migration. The land use analysis results showed that land use practices in <strong>the</strong> two catchments are<br />
characterized by a combination <strong>of</strong> destructive forces mainly <strong>the</strong> expansion and intensification <strong>of</strong> cultivation <strong>of</strong> maize on marginal<br />
land using inappropriate practices. The participatory rural appraisal sessions in both catchments revealed that <strong>the</strong> number <strong>of</strong> trees in<br />
<strong>the</strong> upland and along <strong>the</strong> rivers, <strong>the</strong> size and number <strong>of</strong> fish caught in <strong>the</strong> two rivers had drastically declined over <strong>the</strong> past fifty years.<br />
The highest amount <strong>of</strong> soil loss (>100t.ha -1 .yr -1 ) was estimated in <strong>the</strong> upland areas <strong>of</strong> <strong>the</strong> Likangala River catchment and field<br />
walks in <strong>the</strong> area revealed wide spread evidence <strong>of</strong> very severe erosion, exposed soils and numerous deep gullies. The most<br />
critical factors contributing to high soil loss were rainfall high kinetic energy and poor vegetation cover. High vegetation cover and<br />
relatively flat plains resulted in low soil loss in <strong>the</strong> wetland. The Likangala River catchment had a higher annual sediment yield <strong>of</strong><br />
374 t.km -2 .yr -1 compared to 315 t.km -2 .yr -1 for <strong>the</strong> Domasi catchment. A situation analysis for <strong>the</strong> Likangala River catchment<br />
showed that increasing maize yield was more efficient in reducing soil loss than contour ridging, and <strong>the</strong> highest reduction in soil<br />
loss was predicted when a combined 20% increase <strong>of</strong> contour ridging, maize yield and tree canopy was assumed. Multiple<br />
regression analysis results showed that reproductive success <strong>of</strong> females migrating upstream was negatively correlated with total<br />
suspended solids and positively correlated with electrical conductivity in <strong>the</strong> Domasi River. On <strong>the</strong> o<strong>the</strong>r hand, <strong>the</strong> upstream<br />
migration <strong>of</strong> Barbus juveniles was positively correlated to sediment yield in both rivers, and also to river flow rate in <strong>the</strong> Domasi<br />
River. The Barbus reproductive status was not correlated to any <strong>of</strong> <strong>the</strong> physico-chemical variables that were measured in <strong>the</strong><br />
Likangala River. The major recommendations <strong>of</strong> <strong>the</strong> study were as follows: (i) land use practices that tackle <strong>the</strong> most critical soil loss<br />
factor should form an integral part <strong>of</strong> soil conservation measures in each soil erosion <strong>management</strong> unit; (ii) a combination <strong>of</strong> contour<br />
ridging, increases in crop yield and vegetation cover should be promoted as strategies for reducing soil loss in <strong>the</strong> Likangala River<br />
catchment; (iii) appropriate <strong>management</strong> actions that reduce fishing pressure on breeding Barbus females in <strong>the</strong> influent rivers<br />
should be formulated to ensure <strong>the</strong> success <strong>of</strong> spawning migrations <strong>of</strong> breeding females into <strong>the</strong> influent rivers, and (iv) marginal<br />
vegetation in <strong>the</strong> breeding grounds along <strong>the</strong> <strong>lake</strong> should be protected from burning and o<strong>the</strong>r forms <strong>of</strong> destruction in order to<br />
maintain breeding and feeding grounds for juvenile Barbus in <strong>the</strong> dry season.<br />
Questions and Comments<br />
Q: How does maize reduce soil erosion?<br />
A: Maize grows faster and provides <strong>the</strong> best canopy to reduce soil erosion during <strong>the</strong> period when <strong>the</strong> rains are<br />
<strong>the</strong> heaviest.<br />
Q: What factors were considered to use Barbus as an ecosystem indicator?<br />
A: Barbus species migrate from <strong>the</strong> <strong>lake</strong> to breed in <strong>the</strong> rivers and, <strong>the</strong>refore, <strong>the</strong>ir reproductive success is<br />
related to <strong>the</strong> condition <strong>of</strong> <strong>the</strong> rivers.<br />
Q: What mechanism would be put in place to protect breeding individuals?<br />
A: The Fisheries policy needs to take into consideration no fishing during <strong>the</strong> breeding season, i.e. considering<br />
banning fish traps or fish weirs that cross <strong>the</strong> entire river system.
Appendix II: List <strong>of</strong> participants<br />
270<br />
Lake Malawi Fisheries Management Symposium - Proceedings<br />
Name Address Tel E-mail<br />
Allison E. School <strong>of</strong> Development Studies, University <strong>of</strong> East<br />
Anglia, Norwich NR4 7TJ, UK<br />
Ambali A. Molecular Biology and Ecology Research Unit<br />
(MBERU), AMBAKA Building, Chancellor, College<br />
Campus, Box 403, Zomba<br />
Balarin J. C/O Royal Danish Embassy, Pvt. Bag 396, Lilongwe,<br />
Malawi<br />
Banda M. Fisheries Research Unit, P.O. Box 27, Monkey Bay,<br />
Malawi<br />
Bandula D. Department <strong>of</strong> Fisheries - Headquarters, P.O. Box<br />
539, Lilongwe, Malawi<br />
Booth A. J. DIFS, Rhodes University, P.O. Box 94, 6140,<br />
Grahamstown, South Africa<br />
Bulirani A. SADC/GEF Project, P.O. Box 311, Salima, Malawi<br />
Changadeya W. Molecular Biology and Ecology Research Unit<br />
(MBERU), AMBAKA Building, Chancellor, College<br />
Campus, Box 403, Zomba, Malawi<br />
Chimenya M. Molecular Biology and Ecology Research Unit<br />
(MBERU), AMBAKA Building, Chancellor, College<br />
Campus, Box 403, Zomba, Malawi<br />
Chirwa W. Centre for Social Research, University Office,<br />
University <strong>of</strong> Malawi, P.O. Box 278, Zomba, Malawi<br />
Chisambo J. Fisheries Research Unit, P.O. Box 27, Monkey Bay,<br />
Malawi<br />
Darwall W. Overseas Development Group University <strong>of</strong> East<br />
Anglia, Norwich NR4 7TJ, UK<br />
44 1603 593724(t)44<br />
1603 451999(f)<br />
e.allison@uea.ac.uk<br />
aambali@sdnp.org.mw<br />
836533 DESP@<strong>malawi</strong>.net<br />
587 440 fru@<strong>malawi</strong>.net<br />
6038415 T.Booth@ru.ac.za<br />
263432<br />
524888<br />
44 1603 593922(t) 44<br />
1603 505262(f)<br />
Dobson T. Michigan State University 13 Natural Resources Bldg. 517-1711(t)<br />
E. Lansing 48824-1222<br />
432-1699(f)<br />
Ellis F. Overseas Development Group University <strong>of</strong> East<br />
Anglia Norwich NR4 7TJ, UK<br />
Gondwe M. SADC/GEF Project, P.O. Box 311, Salima, Malawi<br />
Halafo J. Fisheries Research Institute, P.O. Box 4603,<br />
Maputo, Mozambique<br />
Hecht T. DIFS, Rhodes University, P.O. Box 94,<br />
6140 Grahamstown, South Africa<br />
Jambo C. Department <strong>of</strong> Fisheries, Mangochi District Office,<br />
P.O. Box 47, Mangochi, Malawi<br />
Jamu D. ICLARM, P.O. Box 229, Zomba<br />
44 1603 504455(t)<br />
44 1603 464267(f)<br />
W.Darwall@uea.ac.uk<br />
dobson@msu.edu<br />
dobson@pilot.msu.edu<br />
f.ellis@uea.ac.uk<br />
263432 nyasa@<strong>malawi</strong>.net<br />
halafo@iip.co.mz<br />
6038415 t.hecht@ru.ac.za<br />
584813, 584 211<br />
536274(t) iclarm@sdnp.org.mw
271<br />
Lake Malawi Fisheries Management Symposium - Proceedings<br />
Name Address Tel E-mail<br />
Jarchau P. NARMAP, P.O. Box 31131, Lilongwe, Malawi<br />
Kachinjika O. Department <strong>of</strong> Fisheries - Headquarters, P.O. Box<br />
539, Lilongwe, Malawi<br />
Kafumabata D. Molecular Biology and Ecology Research Unit<br />
(MBERU), AMBAKA Building, Chancellor, College<br />
Campus, Box 403, Zomba, Malawi<br />
831 825 narmapllw@<strong>malawi</strong>.net<br />
788865, 788511<br />
Kamanga L.<br />
277222/277214 staff@aquadept.<strong>malawi</strong>.net<br />
Kanyerere G.<br />
Dept <strong>of</strong> Aquaculture and Fisheries Science, University<br />
<strong>of</strong> Malawi, Bunda College, Box 219 Lilongwe, Malawi<br />
Fisheries Research Unit, P.O. Box 27, Monkey Bay,<br />
Malawi<br />
587 440 fru@<strong>malawi</strong>.net<br />
Kataya P. National Aquaculture Centre, P.O. Box 44,<br />
Domasi, Malawi<br />
536215 nac@sdnp.org.mw<br />
Kaunda E. Dept <strong>of</strong> Aquaculture and Fisheries Science, University<br />
<strong>of</strong> Malawi, Bunda College, Box 219 Lilongwe, Malawi<br />
Kihedu J. TAFIRI, Kyela Centre, P.O. Box 98, Kyela, Mbeya<br />
Region, Tanzania<br />
Makuwila M. P.O. Box 593, Lilongwe<br />
277214(t)(f) staff@aquadept.<strong>malawi</strong>.net<br />
tafirik@africaonline.co.tz<br />
788511 sadcfish@<strong>malawi</strong>.net<br />
Maluwa A. NAC, P.O. Box 44, Domasi 536215 aomaluwa@sdnp.org.mw<br />
Manase M. Fisheries Research Unit, P.O. Box 27, Monkey Bay,<br />
Malawi<br />
Mapila S.A. Department <strong>of</strong> Fisheries - Headquarters, P.O. Box<br />
539, Lilongwe, Malawi<br />
Morioka S. JICA, P.O. box 3032, Lilongwe<br />
Msowoyo N. Department <strong>of</strong> Fisheries - Headquarters, P.O. Box<br />
539, Lilongwe, Malawi<br />
Msukwa A. P.O. Box 48, Moneky Bay<br />
Mvula P. Center for Social Research, University Office,<br />
University <strong>of</strong> Malawi, P.O. Box 278, Zomba, Malawi<br />
Mwakiyongo K. Fisheries Research Unit, P.O. Box 27, Monkey Bay,<br />
Malawi<br />
Mwambungu J.A. TAFIRI, Kyela Center, P.O. Box 98, Kyela, Mbeya<br />
Region, Tanzania<br />
Ngatunga B. TAFIRI, Kyela Center, P.O. Box 98, Kyela, Mbeya<br />
Region, Tanzania<br />
Ngochera M. Fisheries Research Unit, P.O. Box 27, Monkey Bay,<br />
Malawi<br />
Ngombe T. Department <strong>of</strong> Fisheries - Headquarters, P.O. Box<br />
539, Lilongwe, Malawi<br />
Nyasulu T. Fisheries Research Unit, P.O. Box 27, Monkey Bay,<br />
Malawi<br />
Nyirenda M. Department <strong>of</strong> Fisheries - Headquarters, P.O. Box<br />
539, Lilongwe, Malawi<br />
Peschke J. MBZDP, P.O. Box 627, Mzuzu, Malawi<br />
Russell A. Dept <strong>of</strong> Fisheries and Wild life, 16 Natural Resources<br />
BLDG, E. Lansing, MI 48824, USA<br />
587 440 fru@<strong>malawi</strong>.net<br />
788511<br />
755734 morioko@<strong>malawi</strong>.net<br />
788511<br />
584657/784<br />
587 440 fru@<strong>malawi</strong>.net<br />
tafirik@africaonline.co.tz<br />
tafirik@africaonline.co.tz<br />
587 440 fru@<strong>malawi</strong>.net<br />
788511<br />
587 440 fru@<strong>malawi</strong>.net<br />
788511<br />
333563 peschke@<strong>malawi</strong>.net<br />
517 332 4931 aaron_belgium@yahoo.com
272<br />
Lake Malawi Fisheries Management Symposium - Proceedings<br />
Name Address Tel E-mail<br />
Sambo E. Center for Social Research, University Office,<br />
University <strong>of</strong> Malawi, P.O. Box 278, Zomba, Malawi<br />
Seymour T. Bryn Eryr Uchaf, Llandadwrn, Anglesey LL59 5SA UK 44 1248 712540 seymourevans@hotmail.com<br />
Sipawe R. Fisheries Research Unit, P.O. Box 27, Monkey Bay,<br />
Malawi<br />
Turner G.F. University <strong>of</strong> Southampton, Bassett Crescent East,<br />
Southampton SO16 7PX, England UK<br />
Tweddle D. c/o DIFS, Rhodes University, P.O. Box 94, 6140,<br />
Grahamstown, South Africa<br />
Weyl O.L.F. NARMAP , P.O. Box 27, Monkey Bay, Malawi 587 754<br />
935 259<br />
Zidana H. National Aquaculture Centre, Box 44,<br />
Domasi, Malawi<br />
587 440 fru@<strong>malawi</strong>.net<br />
44 2380 593217(t)<br />
44 2380 594397(f)<br />
536215(t)<br />
536203(f)<br />
gft@soton.ac.uk<br />
d.tweddle@ru.ac.za<br />
narmapbay@<strong>malawi</strong>.net<br />
nac@sdnp.org.mw<br />
Acknowledgements<br />
The Lake Malawi Fisheries Management Symposium was organised and funded by <strong>the</strong> GTZ supported<br />
NARMAP Programme <strong>of</strong> <strong>the</strong> Department <strong>of</strong> Fisheries. However, considerable inputs and support to<br />
participants was received from <strong>the</strong> SADC/GEF Project, <strong>the</strong> World Bank, ICLARM, JICA, Rhodes<br />
University, <strong>the</strong> EU and <strong>the</strong> ODG funded Malawi/Indonesia Fluctuating Fisheries Project. In addition, this<br />
<strong>symposium</strong> would not have been possible without <strong>the</strong> commitment <strong>of</strong> <strong>the</strong> authors, whose presentations<br />
are <strong>the</strong> basis for <strong>the</strong> <strong>symposium</strong>. In addition, we would also like to thank <strong>the</strong> <strong>symposium</strong> committee for<br />
<strong>the</strong>ir committed work on this project.